National Energy Services Reunited Corp. The National Champion of MENA - Sherif Foda
←
→
Page content transcription
If your browser does not render page correctly, please read the page content below

National Energy Services Reunited Corp.
    The National Champion of MENA
                                          June 2021

Sherif Foda
Chairman and Chief Executive Officer
Safe Harbor and Other Disclaimers
          This presentation (the “Presentation”) is for informational purposes only and does not constitute an offer to sell, a solicitation of an offer to buy, or a recommendation to purchase any equity, debt or other financial instruments of National Energy Services Reunited
          Corp. and its group companies (“NESR” or “the Company”), or its respective affiliates’ securities (as such term is defined under the U.S. Federal securities laws). This Presentation does not purport to contain all of the information that may be required to evaluate a
          potential investment in the Company, and you should seek your own legal, accounting and other relevant professional advice.
          All information herein speaks only as of the date hereof, unless stated otherwise. Neither NESR nor its affiliates undertake any obligation to update or otherwise revise any information contained in this Presentation.
          Use of Projections: This Presentation contains certain financial forecasts with respect to the Company. These financial projections have been provided by the Company’s management team, and their independent auditors have not audited, reviewed, compiled,
          or performed any procedures with respect thereto for the purpose of their inclusion in this Presentation, and accordingly, do not express an opinion or provide any other form of assurance with respect thereto for the purpose of this Presentation. These financial
          projections should not be relied upon as being necessarily indicative of future results. The inclusion of such information is not an admission or representation by them that such information is material. In this Presentation, certain of the above-mentioned financial
          projections (in each case, with an indication that the information is an estimate and is subject to the qualifications presented herein) have been prepared for purposes of providing comparisons with historical data. The assumptions and estimates underlying the
          projections are inherently uncertain and are subject to a wide variety of significant business, economic and competitive risks and uncertainties that could cause actual results to differ materially from those contained in the projections. Accordingly, there can be no
          assurance that the prospective results are indicative of the future performance of NESR or that actual results will not differ materially from those presented. Inclusion of the financial projections in this Presentation should not be regarded as a representation by any
          person that the results contained in the projections will be achieved. The information contained herein is not a guarantee of future performance.
          Forward-Looking Statements: This presentation contains “forward-looking statements” within meaning of the U.S. federal securities laws — that is, statements about the future, not about past events. Such statements often contain words such as “expect,” “may,”
          “believe,” “plan,” “estimate,” “intend,” “anticipate,” “should,” “could,” “will,” “see,” “likely,” and other similar words. Forward looking statements address matters that are, to varying degrees, uncertain, such as statements about our financial and performance targets
          and other forecasts or expectations regarding business outlook; growth of NESR as a whole and of each of our product lines or group companies (and for specified product lines or products or countries); oil and natural gas demand and production growth; oil and
          natural gas prices; rig activity; pricing; improvements in operating procedures and technology; capital expenditures by NESR and the oil and gas industry; the business strategies of NESR’s customers, joint ventures and alliances; future global economic conditions;
          geopolitical situations and future results of operations. These statements are subject to risks and uncertainties, including, but not limited to, global economic conditions; changes in exploration and production spending by NESR’s customers and changes in the level
          of oil and natural gas exploration and development; general economic, political and business conditions in the MENA regions; foreign currency risk; pricing pressure; weather and seasonal factors; the inability to recognize the benefits of NESR’s recent business
          combination; changes in government regulations and regulatory requirements, including those related to onshore and offshore oil and gas exploration, radioactive sources, explosives, chemicals, in country value creation and climate-related initiatives; the inability
          of technology to meet new challenges in exploration or improvements in production; risks stemming from COVID-19; and other risks and uncertainties detailed in our most recent reports filed with or furnished to the U.S. Securities and Exchange Commission. If one
          or more of these or other risks or uncertainties materialize (or the consequences of such a development changes), or should underlying assumptions prove incorrect, actual outcomes may vary materially from those reflected in our forward-looking statements. The
          forward-looking statements speak only as of the date of this presentation, and NESR disclaims any intention or obligation to update publicly or revise such statements, whether as a result of new information, future events or otherwise.
          The foregoing list of factors is not exclusive. Additional information concerning these and other risk factors is contained in NESR’s most recent filings with the SEC. All subsequent written and oral forward-looking statements concerning NESR or other matters and
          attributable to NESR or any person acting on their behalf are expressly qualified in their entirety by the cautionary statements above.
          Non-GAAP Financial Measures: This Presentation includes certain financial measures not presented in accordance with generally accepted accounting principles (“GAAP”) including, but not limited to, EBITDA, adjusted EBITDA, Free Cash Flow and certain ratios
          and other metrics derived there from. NESR believes that these non-GAAP measures of financial results provide useful information to management and investors regarding certain financial and business trends relating to NESR’s financial condition and results of
          operations. NESR’s management uses these non-GAAP measures to compare its performance to that of prior periods for, among other reasons, trend analysis and for budgeting and planning purposes. NESR believes that the use of these non-GAAP measures
          provides an additional tool for investors to use in evaluating ongoing operating results and trends and in comparing NESR’s financial measures with other peer companies, many of which present similar non-GAAP measures to investors. Management of NESR
          does not consider these non-GAAP measures in isolation or as an alternative to financial measures determined in accordance with GAAP. The principal limitation of these non-GAAP measures is that they exclude significant expenses that are required by GAAP to
          be recorded in the Company’s financial statements. In addition, these measures are subject to inherent limitations as they reflect the exercise of judgment by management about which expenses and income are excluded or included in determining these non-GAAP
          measures. You should not place undue reliance on these non-GAAP measures. We urge you to review NESR’s financial statements, which are included in NESR’s SEC Filings. Certain non-GAAP financial information included in this investor presentation is
          preliminary, unaudited and subject to revision upon completion of the Company's closing and audit processes. As such, potential investors are cautioned not to rely on such information, as audited results may differ materially from the information provided herein.

                                                                                                                                                                                                                                                                               |2
Strictly confidential – Do not reproduce or distribute                                                                              Copyright NESR Corp.
NESR – Largest Indigenous OFS in the Region
                                                                      Iraq Bahrain UAE                                 § Head office in Houston and regional offices across
                                                                                                                         MENA and Asia Pacific
                                                                                                                       § Operations Bases: 15 Countries

                                                                      Egypt                                            § 5,500+ Employees
                                     USA
                                                         Algeria
                                                                     Libya                                             § 20 Product Lines
                                                                                     India
                                                           Chad
                                                                   Saudi Arabia
                                                                                                                       § Clients Portfolio: 30+ Customers
                                                                                             Indonesia                   (Major IOCs | NOCs | Independents)

                                                                                                                       § Major Operations: KSA | Oman | Iraq | Algeria | UAE |
                                                                                  Oman                                   Egypt | Kuwait | Qatar
                                                                                  Qatar
                                                                                  Yemen                                § Top Tier service provider in the region
                                                                                  Kuwait

                                                                                                                                                                        |3
Strictly confidential – Do not reproduce or distribute                                          Copyright NESR Corp.
Global Demand Expected to Rebound into 2022

                                                                                |4
        Note: Assumes $70 crude
StrictlySource:
         confidential – Do notJames
                IEA, Raymond   reproduce or distribute
                                    Research             Copyright NESR Corp.
OPEC+ Must Maximize Production by 2022

                                                                                |5
        Note: Assumes $70 crude
StrictlySource:
         confidential – Do notJames
                IEA, Raymond   reproduce or distribute
                                    Research             Copyright NESR Corp.
US Activity is highly dependent on Oil Price

                                                                                |6
Strictly confidential – Do not reproduce or distribute   Copyright NESR Corp.
       Source: IEA, Raymond James Research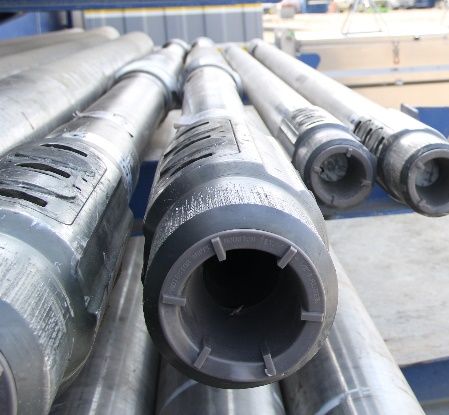
Most Resilient, Lowest Cost Markets to Meet Increasing Demand
                                                                                                      NESR is Exclusively Focused on Mission Critical Oil and Gas Regions
                                                                                                                  Gulf Cooperation Council (GCC) is a More Resilient Onshore Rig Market¹
    350                                      GCC Rig Count

    300
    250                                                                                                                                                                                                     Rig Count Decline Mar-14 to Mar-21

    200                                                                                                                                                                                                           GCC        North America

    150                                                                                                                                                                                                            -21%
    100
      50                                                                                                                                                                                                                           -77%

                  –
                                 Mar-14                                              Mar-15                        Mar-16                Mar-17                          Mar-18                   Mar-19                            Mar-20                        Mar-21

                                                                                                                            CY2020-CY2021 Global Supply Growth Driven by OPEC²
      % of Global Production Growth

                                                            69 %

                                                                                                      12 %                      11 %
                                                                                                                                                             7%                       5%
                                                                                                                                                                                                                    2%

                                                                                                                                                                                                                                                     (5)%

                                                           OPEC                                  Non-OPEC Latam                 Asia                        Europe                North America        Non-OPEC Middle East & Africa             Non-OPEC Asia

                                      Source: ¹ Baker Hughes Rig Count, ² Wall Street Research
                                                                                                                                                                                                                                                                 |7
Strictly confidential – Do not reproduce or distribute                                                                                            Copyright NESR Corp.
NESR – We are unique

             § Started as a SPAC in May 2017                                                   Enhanced services portfolio

             § Agreed to merge National Petroleum                                                          WL   WL
                                                                                       Stim   Coil   Cem             DM   DTR SWT Fluids AL       WS
               Services (NPS) and Gulf Energy                                                              OH   CH

               SAOC (GES) in November 2017                                      NPS

                                                                                GES
             § Transaction closed June 2018                                     NESR

             § Trades under the “NESR” ticker on
               NASDAQ
                                                                                              Extended geographic footprint
             § The first and only NASDAQ-listed
               national oilfield services company                                      Saudi Oman UAE Kuwait Iraq     Egypt Qatar Algeria Libya Outside

               focused on the MENA region                                       NPS

             § Diverse shareholder base and board                               GES

               representation                                                   NESR

                                                                                                                                                       |8
Strictly confidential – Do not reproduce or distribute   Copyright NESR Corp.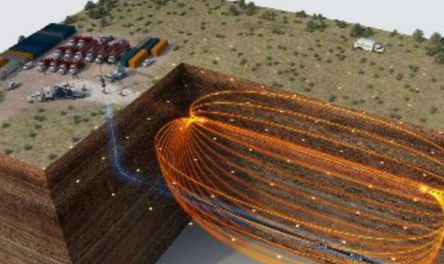
Executing on Our MENA Consolidation Thesis
                                                                     NESR Strategy                                                                                                              2021 Action Energy Company Acquisition

                §     Build the “National Champion” of MENA                                                                                                                                                     Background

                §     Cultivate relationships with major upstream operators across footprint
                                                                                                                                                                             §   Action Energy is one of the leading indigenous oilfield services companies
                §     Deliver superior service and technology                                                                                                                    in Kuwait with multiple oilfield services contracts across both drilling and
                                                                                                                                                                                 production operations
                §     Drive revenue and cost synergies through integrated solutions

                §     Disciplined acquisitions at attractive valuation
                                                                                                                                                                             §   The transaction comprises oil services contracts in certain services lines
                                                                                                                                                                                 worth more than $200 million, accretive from day one.

                                            M&A and Strategic Partnership Track Record                                                                                       §   Transaction started operationally effective April 1, 2021

                  2018                      2019                   2020                                                  2021                                                                                     Rationale

                                          (Partnership)                                   (Early Stage Investment)
                                                                                                                                                                             §   Anchor Country as one of the top reserves of the world.
                                                                                                                                          OFS lines of Action Energy
                                                                                                                                                  Company

                                                                                                                                                                             §
                                                                  (Partnership)                                                                   (Acquisition)
                                                                                                                     (Partnership)                                               Positions NESR to be top-tier provider in Kuwait, with operations across the
                                      ü    Share leading      ü   NESR entry into Egypt     ü    Geothermal &        ü   Opportunity to
                                                                                                                                                                                 Production and Drilling and Evaluation segments
          ü    Integrated solutions        unconventional         market                         clean water in          showcase         ü    Larger market share
               across MENA                 operational                                           the ESG                 NESR’s                in Kuwait
          ü                                                   ü   Creation of 600 job                                                     ü
                                                                                                                                                                             §
               Long-term                   technologies and                                      IMPACT                  leading               Creation of new
               relationships               processes with
                                           customers
                                                                  opportunities in Oman
                                                                  and abroad
                                                                                                 investment
                                                                                                 portfolio
                                                                                                                         technologies &
                                                                                                                         partnerships
                                                                                                                                               service line                      Presents the opportunity to enter a new service line offering across the region

                                                                                                                                                                                                                                                        |9
Strictly confidential – Do not reproduce or distribute                                                                                                Copyright NESR Corp.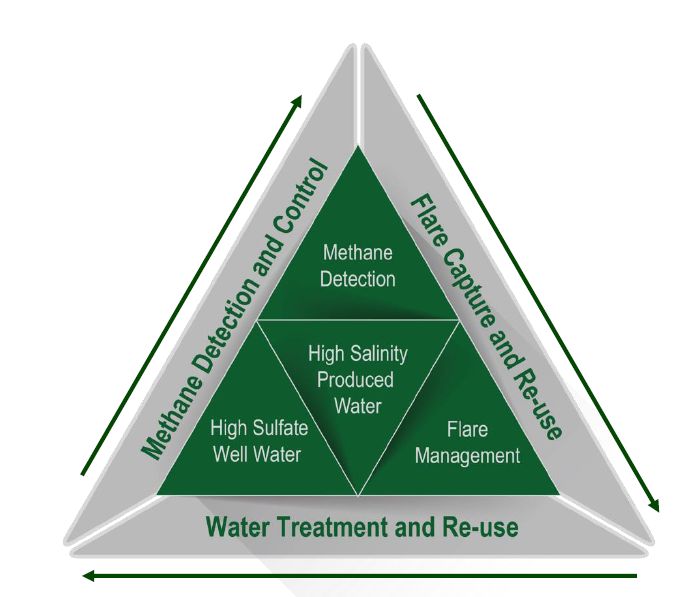
NESR is a unique OFS play
                                           OFS…                                                                  NESR

                 “… is going to be affected long term    In forecasts that predict a drastic shift away from Oil and 70% reduction in carbon emissions by 2050, the Middle East
                  changes by the energy transition”      is the major oil producer with the lowest cost/bbl, in countries where NESR not only operates, but is considered “local”

            “…will be affected by short term demand
                                                                              Incremental supply for 2021 will come from OPEC+ based on IEA estimates
                     changes post COVID”

                                                            NESR operates in a 20B$ market, largely controlled by the “Big 3” , with a 4% market share today and enough
                      “…in an oversupplied market”
                                                                       headroom to go to 10% market share (Execution, Open Source Tech, ICV tailwinds)

                       “…does not deliver real EPS”           NESR delivers positive EPS without any adjustments, write-offs, impairments - an exception in the Industry

          ”...is over-levered with no FCF generation”                        NESR Net Debt/EBITDA is less than 2x and decreasing, with a 10% FCF yield

            “…higher beta vs oil and gas landscape”       Historically true but NESR has produced consistent growth for the last 3 years and has clear path to double in size

           “…beholden to what happens in elections”          NESR is insulated from US elections. In either case NESR benefits (more regulated North America will lead to
                                                                                                             higher prices)

                “…better positioned for the upside in    NESR has been historically undervalued vs International or US Peers so if Oil price goes up and valuations improve,
                               NAM”                                NESR has the same upside as any distressed US peer with minimal risk of operating activity

                                                           NESR leads in ESG regionally. Local Govts have stated targets of >50% In-Country Value Creation and NESR is| 10
                                “…behind on ESG”
                                                          ahead of the curve. NESR is the first regional company listed on a US exchange, following a US governance model
Strictly confidential – Do not reproduce or distribute                              Copyright NESR Corp.
Our Investment in New ESG IMPACT Initiative
Our target return for investments in these initiatives will be substantially similar to those in the existing business segments
The Need Our Strong Commitment and Objectives
§ Drive increased conversion of produced water to fresh water
§ Become a force for positive impact on the environment
Largest Byproduct 200 Billion bbls Recycle / Re-Use
Produced water is the 200 billion bbls Only 50% of produced § Enhance the life of communities around us
largest volume generated by oil and water is currently
byproduct of the oil and gas industry recycled or re-used
gas sector From powering the planet to delivering water,
NESR is committed at all levels
ESG IMPACT Triangle Our Partnerships
Through the new initiative, we expect to
introduce and develop a portfolio of
High Salinity Technology
product lines and services to mitigate Produced Water Partner
Fresh Water
climate change, enhance water
management and conservation,
minimize environmental waste in the
industry, and introduce innovative High Sulfate Technology Sulfate
Well / Sea Water Partner Free Water
energy solutions
| 11
Strictly confidential – Do not reproduce or distribute Copyright NESR Corp.Open Platform approach on Technology
Strategic partnerships for R&D and portfolio expansion
Rotary Steerable System Multiphase Flow Meter Perforation Systems Wireless Tools for Production Chemicals
(RSS) (MPFM) (PERF) Slickline (CHEM)
Advanced Production Well Head System for Next Gen Well Head Downhole Coil Tools Fracturing and
Logging Coil, WL and SL System And Intelligent Coil Stimulation Monitoring
| 12
Strictly confidential – Do not reproduce or distribute Copyright NESR Corp.NESR Oilfield Research and Innovation (NORI)
NORI’s model, akin to the larger technological changes
we are seeing globally, will create an open platform for
innovative technology companies in the upstream space
to come to the Kingdom and will benefit the Saudi oil
and gas industry - Dr. Mohammed Y. Al-Qahtani, Saudi
Aramco's Senior Vice President for Upstream
| 13
Strictly confidential – Do not reproduce or distribute Copyright NESR Corp.Exceptional and Unmatched Growth to continue
1,213 On target to
Growth in the
worst surpass the +1B$
downturn in mark
25 years
992
CAGR
2 1% 834
658
9% CAGR
553
458
415 431
369
328 315
246
213
186
141 147 162
111 129
104
2013 2014 2015 2016 2017 2018 2019 2020 2021 2022
Revenue ($mm) Analyst Analyst
Adjusted EBITDA ($mm)
| 14
NPS financial results for 2013, 2014 are prepared under IFRS and 2015-2017 are prepared under USGAAP; GES 2013-2017 financial results are prepared under IFRS.
2019 and 2020 from Company financial information as published in fourth quarter earnings releases.
2021E and 2022E from Bloomberg as June 8, 2021
Adjusted EBITDA is not recognized as part of EBITDA under US GAAP.
Strictly confidential – Do not reproduce or distribute Copyright NESR Corp.and Significant Upside Potential
TEV/EBITDA 2021E TEV/EBITDA 2022E
(1%) 4% 0% 0% (11%) 19% YOY Rev Growth* 17% 26% 10% 12% 24% 22%
14.7x
23.8x
Significant
19.7x 10.3x valuation
Significant 10.0x upside
valuation 8.1x potential
upside
12.8x 12.2x 6.3x
11.6x potential
5.3x
6.8x
Equipment North International European North Equipment North International European North
America diversified OFS America America diversified OFS America
onshore onshore onshore onshore
services drillers services drillers
Source: Bloomberg Estimates as of June 8, 2021 including NESR estimates of 2021 and 2022 EBITDA
Note: North America onshore services includes NexTier Oilfield Solutions, ProPetro Holding Corp., Liberty Oilfield Services, and Superior Energy Services; North America onshore drillers includes Patterson, Helmerich & Payne, and Nabors Industries; Equipment includes Cactus, Drill-
| 15
Quip, TechnipFMC, National Oilwell Varco, and Oil States International; International diversified includes Schlumberger, Halliburton, and Baker Hughes; European OFS includes Schoeller-Bleckmann Oilfield Equipment, Hunting plc and Fugro.
*2020 Actual Revenue, and Projected 2021 and 2021 Revenue – Bloomberg Estimates as of June 8, 2021
Strictly confidential – Do not reproduce or distribute Copyright NESR Corp.Outperforming the Big 3 in Critical Markets
Why NESR? NESR Outperforms the Big 31 in International Revenue Growth
Indexed to International Revenue
ü Superior execution and efficiency 175
150
ü Leading edge products and techniques 125
100
ü Local content in workforce
75
Q2 18 Q3 18 Q4 18 Q1 19 Q2 19 Q3 19 Q4 19 Q1 20 Q2 20 Q3 20 Q4 20 Q1 21
ü NESR culture OFS 1 OFS 2 OFS 3 NESR
Indexed to Middle East / Asia Revenue
175
ü Proactive Covid-19 response
150
ü On-the-ground customer relationships 125
100
ü At-site knowledge of customer needs 75
Q2 18 Q3 18 Q4 18 Q1 19 Q2 19 Q3 19 Q4 19 Q1 20 Q2 20 Q3 20 Q4 20 Q1 21
OFS 2 OFS 3 NESR
| 16
Source: Company filings
Note: Charts are indexed to a starting point in Q2 2018 and each subsequent quarter reflects the percentage increase or decrease compared to Q2 2018.
1
The Big 3 are defined as Schlumberger, Baker Hughes and Halliburton.
Strictly confidential – Do not reproduce or distribute Copyright NESR Corp.NESR beats the Big 3 in every metric…
Ø Superior projected financial performance
2020 – 2022 Revenue Change % 2022 EBITDA % 2022 Net Margin %
45.4% 26.0% 11.4%
22.2% 9.1%
18.4% 7.4%
14.1%
17.6% 4.1%
6.6% 6.4%
OFS 1 OFS 2 OFS 3 NESR OFS 1 OFS 2 OFS 3 NESR OFS 1 OFS 2 OFS 3 NESR
Ø Significant upside valuation potential
2022 EV / EBITDA 2022 EV / FCF 2022 FCF Yield (FCF/EV)
11.5 25.3 8.8%
23.6 23.3
9.7 9.5
4.2% 3.9% 4.3%
5.3 11.4
OFS 1 OFS 2 OFS 3 NESR OFS 1 OFS 2 OFS 3 NESR
| 17
OFS 1 OFS 2 OFS 3 NESR
StrictlySource:
confidential – DoEstimates
Bloomberg not reproduce or distribute
as of June 8, 2021 Copyright NESR Corp.And beats the US Top Tier Independent Frac
Ø Also exceeding in projected financial performance
2020 – 2022 Revenue Change % 2022 EBITDA % 2022 Net Margin %
45.4% 26.0% 11.4%
34.0% 33.7% 20.4%
24.8%
13.1% 13.0%
2.8% 2.8%
-0.9%
OFS 4 OFS 5 OFS 6 NESR OFS 4 OFS 5 OFS 6 NESR OFS 4 OFS 5 OFS 6 NESR
Ø Also showing significant upside valuation potential
2022 EV / EBITDA 2022 EV / FCF 2022 FCF Yield (FCF/EV)
20.2 8.8%
7.9
16.0 16.7
6.0 6.2% 6.0%
5.1 5.3 5.0%
11.4
| 18
OFS 4 OFS 5 OFS 6 NESR OFS 4 OFS 5 OFS 6 NESR OFS 4 OFS 5 OFS 6 NESR
StrictlySource:
confidential – DoEstimates
Bloomberg not reproduce or distribute
as of June 8, 2021 Copyright NESR Corp.NESR is the First and Only NASDAQ listed MENA Energy Company
Adjusted EBITDA by Quarter
           (Non-GAAP reconciliation)

                                                                                                      NESR ($million)                               Q1 2021
                                                                                                      Revenue                                         212.4
                                                                                                      Operating Income                                 15.7
                                                                                                      Depreciation and amortization                    31.8
                                                                                                      Other income/expense, net                         0.7
                                                                                                      Transaction, Integration and Start-
                                                                                                      Up Costs                                          2.0
                                                                                                      Adjusted EBTIDA                                  50.2

        Source: Company financial information as published in 2021 first quarter earnings releases.

                                                                                                                                                              | 20
Strictly confidential – Do not reproduce or distribute                                                                       Copyright NESR Corp.
2019/2020 Adjusted EBITDA
(Non-GAAP reconciliation)
NESR ($million) 2020 2019
Revenue 834.1 658.4
Net income (loss) 50.1 39.4
Depreciation and amortization 128.6 93.8
Finance cost 15.9 19.0
Tax 10.7 13.1
Charges & credits 7.9 20.7
Adjusted EBTIDA 213.2 186.0
| 21
As reported in quarterly earnings press releases
(1)
Strictly confidential – Do not reproduce or distribute Copyright NESR Corp.Historical Adjusted EBITDA
(Non-GAAP reconciliation)
Adjusted EBITDA
NPS financial results for 2013, 2014 are prepared under IFRS, and 2015-2017 are prepared under US GAAP; GES 2013-2017 financial results are prepared under IFRS.
| 22
EBITDA is adjusted for impairment, which is not recognized as part of EBITDA under US GAAP.
Strictly confidential – Do not reproduce or distribute Copyright NESR Corp.You can also read