Brookfield Renewable Partners - Presentation
←
→
Page content transcription
If your browser does not render page correctly, please read the page content below
Brookfield Renewable Partners
I N V E S T O R D AY
SEPTEMBER 26, 2018

Agenda

Overview                                  3
Sachin Shah, Chief Executive Officer

Performance Case Studies                 13
Ruth Kent, Chief Operating Officer

Balance Sheet Review                     34
Wyatt Hartley, Chief Financial Officer

Bringing It All Together                 53
Sachin Shah, Chief Executive Officer

                                              2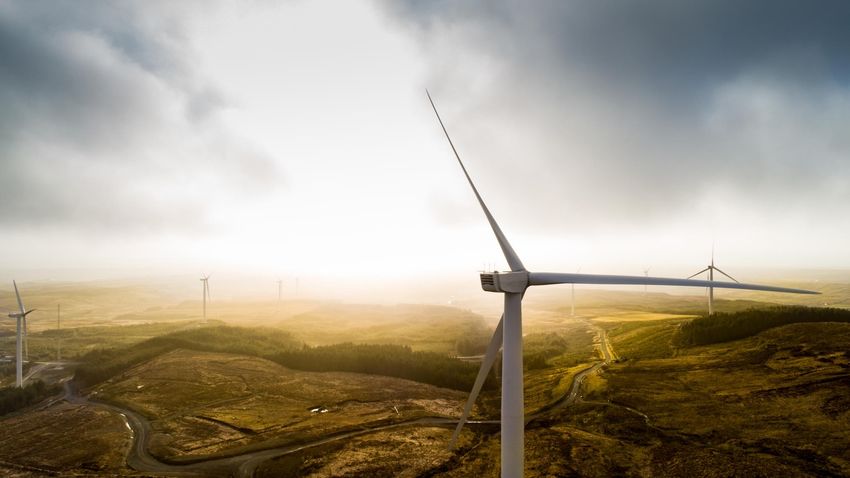
Overview: Sachin Shah, Chief Executive Officer

                                                 3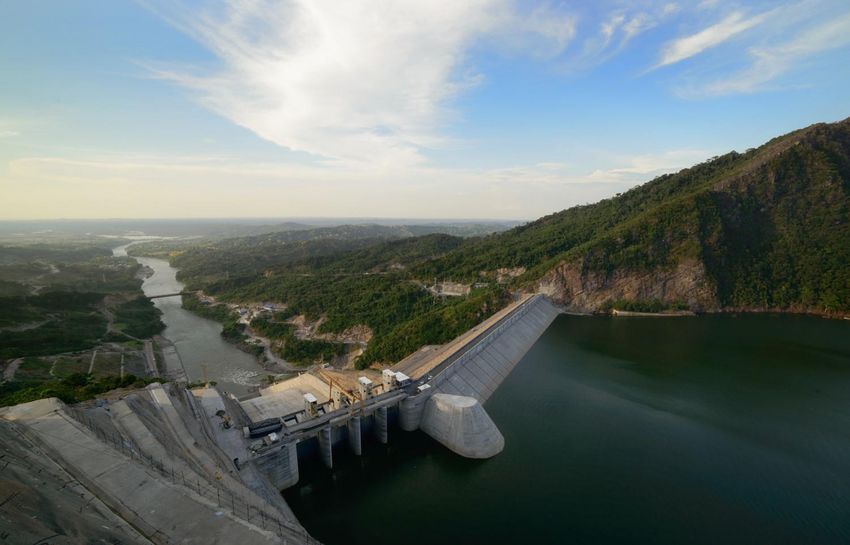
We are a leading owner and operator
               of renewable power assets

$43 billion      5 sectors    10 countries 15%
ASSETS UNDER     MULTI-       GLOBALLY      TOTAL RETURNS
MANAGEMENT       TECHNOLOGY   DIVERSIFIED   SINCE INCEPTION

                                                              4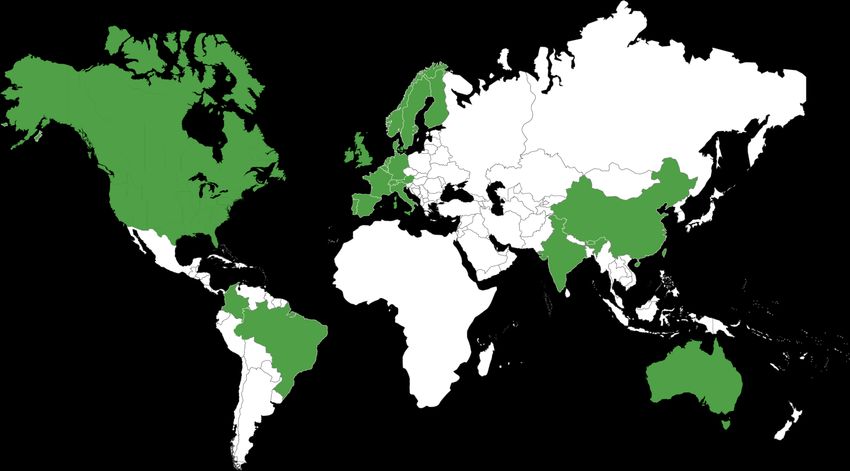
The world is in the early stages of a
  decades-long transformation
  from fossil fuels to renewables

                                        5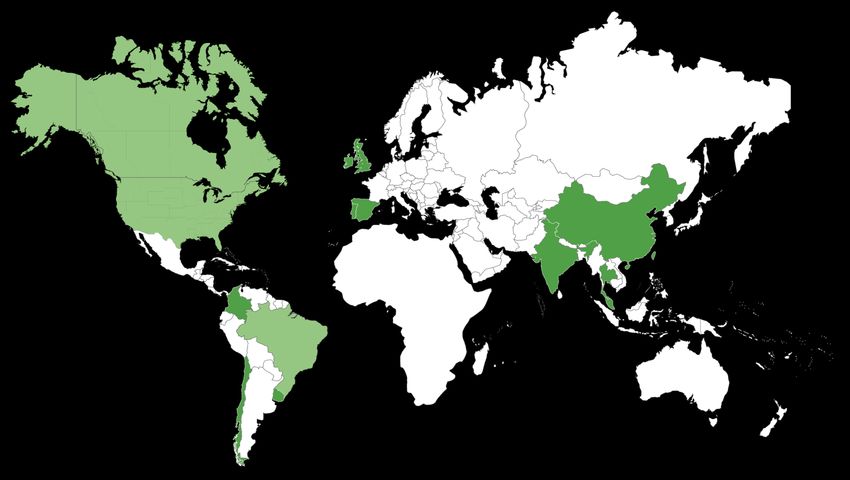
This global transformation is being led by…

                  Climate change

                  Government policy and subsidies

                  Historically low cost of capital

                  Increased demand from financial investors for
                  long-duration renewable assets

                                                                  6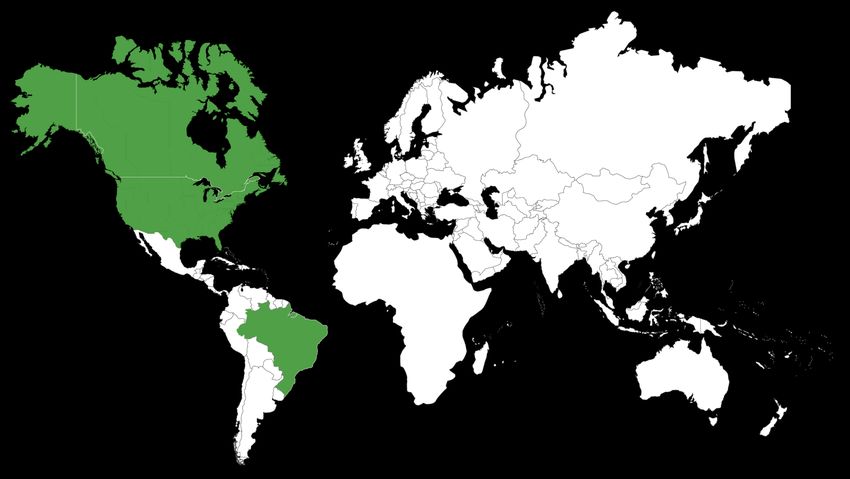
In the last 5 years, $1.5 trillion
                              has been invested in renewables…

                                        17%
                                        HYDRO

            1%                                               47%
            OTHER                                             SOLAR

                                                               35%
                                                                 W IND

Please refer to endnotes at the end of the presentation

                                                                         7
…And over 1 million megawatts of new renewable
capacity has been added to global grids
20%
HYDRO
5% 42%
SOLAR
OTHER
33%
W IND
Please refer to endnotes at the end of the presentation
8This has all been done at
high valuations and low returns
IRR
Operating Development
Europe 4% – 7% 7% – 9%
North America 6% – 8% 8% – 10%
Asia 8% – 10% +12%
Latin America +10% +12%
Please refer to endnotes at the end of the presentation
9So we have set out to do the following…
Look for unique hydro opportunities leveraging our scale
Invest in wind and solar and build operating expertise
Globalize the business
Maintain our financial discipline and investment grade balance sheet
10Our targets during this period and
into the future have not changed:
12% to 15% long-term total returns
11We have a proven, disciplined and repeatable strategy to create value
1 2 3
Invest on a Operating Capital
Value Basis Expertise Discipline
12Performance Case Studies – Ruth Kent, Chief Operating Officer
Marquee Transactions

          1             2         3
       Bord Gáis       Isagen   TerraForm
                                Companies

                                            14
Slievecallan, Ireland
320 MW 340 MW 60
BORD GÁIS OPERATING CONSTRUCTION EXPERIENCED
PORTFOLIO PIPELINE OPERATORS
15Acquisition of Bord Gáis in 2014
Eurozone Financial Crisis
Devaluation of the Euro
Brookfield Complex government privatization
STRENGTHS
Renewables, retail & gas businesses
Operating history: track record
16Bord Gáis | Business Plan
1 Advance development pipeline
2 Expand revenue through power marketing
3 Pursue further growth opportunities in Europe
17Bord Gáis | Organic Growth
1 Advance development pipeline
• Developed ~200 MW of wind farms from proprietary pipeline
• Efficiently tucked-in ~55 MW of wind facilities through opportunistic
acquisitions
• Added 1,200 MW of new development opportunities
2 Source new revenue opportunities through power marketing and direct
contracting
3 Pursue further growth opportunities in Europe
18Bord Gáis | Enhanced the Revenue Profile
1 Advance development pipeline
2 Source new revenue opportunities through power marketing
and direct contracting
• Sold power and green attributes into the U.K.’s higher power price
market securing an additional £12/MWh of revenue
• Established a corporate customer base
• Surfaced new ancillary services through our U.K. pumped storage plants
3 Pursue further growth opportunities in Europe
19Bord Gáis | Expanded Our Presence in Europe
1 Advance development pipeline
2 Source new revenue opportunities through power marketing and
direct contracting
3 Pursue further growth opportunities in Europe
• Leveraged knowledge of European markets to expand into the U.K.
and Iberia
• Today we have 3,700 MW of operating wind, solar and storage and a
1,500 MW development pipeline
20Sogamoso, Colombia
3,000 MW 3rd 3,800 MW
ISAGEN OPERATING LARGEST GENERATOR DEVELOPMENT
PORTFOLIO IN COLOMBIA PIPELINE
21Acquisition of Isagen in 2016
Government privatization
Commodity slowdown and COP devaluation
BROOKFIELD
Brookfield $5 billion EV transaction
STRENGTHS
STRENGTHS
Hydro operating and development expertise
Failed auction process
22Isagen | Business Plan
1 Extend the term of our PPAs
2 Reduce costs and improve margins
3 Pursue select development opportunities
23Isagen | Contracting
1 Extend the term of our PPAs
• Acquired a business with 1 to 2 year contract durations two years ago
• We have since increased contract terms such that 15% of our contracts
have 5 to 10 years of duration today
2 Reduce costs and improve margins
3 Pursue select development opportunities
24Isagen | Cost Reduction Strategy
1 Extend the term of our PPAs
2 Reduce costs and improve margins
• Improved processes and reduced reliance on external contractors
• Realized ~$75 million in operating and interest savings to date
3 Pursue select development opportunities
25Isagen | Development
1 Extend the term of our PPAs
2 Reduce costs and improve margins
3 Pursue select development opportunities
• Wind and solar represent a significant growth opportunity
• We acquired a 3,800 MW development pipeline and are advancing over
300 MW of wind projects
26Alamosa, United States
TERRAFORM 3,600 MW 10 countries 3 sectors
OPERATING GLOBAL MULTI-
COMPANIES PORTFOLIO REACH TECHNOLOGY
27Acquisition of TerraForm Power and TerraForm Global in 2017
Large scale bankruptcy of SunEdison
Complex stakeholder group
Brookfield Ability to create a tailored solution
STRENGTHS
Global operating capabilities
Immediate financial stabilization
28TerraForm Power and Global | Business Plan
1 Stabilize the business post-SunEdison bankruptcy
2 Reduce costs while enhancing operational focus
3 Ready businesses for growth in core regions and rationalize portfolio
29TerraForm Power and Global | Business Stabilization
1 Stabilize business post SunEdison bankruptcy
• Moved all employees into Brookfield offices in New York, Rio de Janeiro,
Mumbai and Shanghai
• Inserted local Brookfield senior executives
• Re-established relations with regulators and stakeholders to ensure
uninterrupted operations
2 Reduce cost structure through operational focus
3 Focus business on core regions and rationalize portfolio
30TerraForm Power and Global | Cost Savings Initiatives
1 Stabilize business post SunEdison bankruptcy
2 Reduce cost structure through operational focus
• Implemented a long-term service agreement for TerraForm Power’s
North American wind portfolio securing cost savings of $20 million
• Rationalized headcount, reduced contractor dependency, in-sourced
back office functions and realized interest savings, driving in excess of
$80 million of cost savings
3 Focus business on core regions and rationalize portfolio
31TerraForm Power and Global | Focus on Core Markets
1 Stabilize business post SunEdison bankruptcy
2 Reduce cost structure through operational focus
3 Focus businesses on core regions and rationalize portfolio
• Inserted growth teams in India and China
• TerraForm Power secured a 1,028 MW wind and solar portfolio in Western
Europe
• Announced sale of non-core South Africa portfolio for total proceeds of
$166 million
32Looking Ahead…
Our priorities over the next five years:
Deliver $60 million Continue to secure Build out our
through cost long-term PPAs to development pipeline
saving initiatives support growing at premium returns
cash flows
33Balance Sheet Review: Wyatt Hartley, Chief Financial Officer
34PO L L I N G Q U ESTI O N # 1
What is the primary measure you look at to
assess the sustainability of distributions?
a) Visibility of growth
b) Payout ratio
c) Balance sheet strength
d) Quality of cash flows
35Our Priorities
1 2 3
Embed business Maintain a Manage risk for
with operating best-in-class the long-term
levers that drive balance sheet
cash flow growth
36We have a high degree of visibility into our
cash flow growth over the next five years
37Growing cash flows through operational levers
Embedded Expected Advanced FFO per Unit
Inflation Margin Development Growth
Escalation Expansion Pipeline Potential
(1% to 2%) (2% to 4%) (3% to 5%) (6% to 11%)
Please refer to endnotes at the end of the presentation
38Embedded Inflation Escalation
Embedded Expected Advanced FFO per Unit
Inflation Margin Development Growth
Escalation Expansion Pipeline Potential
(1% to 2%) (2% to 4%) (3% to 5%) (6% to 11%)
Inflation indexation in our contracts providing $50 million of FFO growth
39Expected Margin Expansion
Embedded Expected Advanced FFO per Unit
Inflation Margin Development Growth
Escalation Expansion Pipeline Potential
(1% to 2%) (2% to 4%) (3% to 5%) (6% to 11%)
Up to $125 million of FFO growth from expected margin expansion:
• Execute on cost reduction programs across our business, with the majority of
savings from North American (including TerraForm) and Colombian businesses
• Advancing contract and commercial initiatives to enhance revenues
40Advanced Development Pipeline
Embedded Expected Advanced FFO per Unit
Inflation Margin Development Growth
Escalation Expansion Pipeline Potential
(1% to 2%) (2% to 4%) (3% to 5%) (6% to 11%)
Aim to develop 1,000 MW generating $125 million of FFO through targeted build out of
our extensive global development pipeline:
• Wind farms in Europe, Colombia and Brazil
• Small hydro facilities in Brazil
• Distributed solar generation in North America and China
41Proven track record of delivering strong FFO per unit growth
FFO per Unit Growth¹
~$3.30
~$2.40 8.5%
CAGR
$1.61
7%
CAGR
2012 2018 PF 2022
Please refer to endnotes at the end of the presentation
42Which translates into sustainable distributions over the long term…
…Given our visibility over cash flow growth and the minimal annual investment
required to maintain cash flows
($millions) 2018 PF 2022 PF
FFO1 750 1,039
Sustaining Capex (72) (78)
Return of Capital2 (38) (52)
Adjusted FFO 641 909
FFO Payout Ratio3 87% 79%
AFFO Payout Ratio3 100% 90%
Please refer to endnotes at the end of the presentation
43Our balance sheet is in great shape
44We maintain a conservative capitalization strategy
BBB+ Highest rating in the sector
INVESTMENT GRADE
BALANCE SHEET
>10 YEARS No material maturities with refinancing risk
AVERAGE PROJECT DEBT
TERM TO MATURITY over the next 5 years
~75% Structured on an investment grade basis
NON-RECOURSE,
with attractive covenant packages
FIXED RATE FINANCINGS
45We have access to significant liquidity
$0.3bn
CASH &
MARKETABLE SECURITIES
$1.7bn
AVAILABLE LIQUIDITY
$1.4bn
CREDIT FACILITIES
We have secured corporate credit facilities with 20 high quality
lenders totaling $2.1 billion with 5 year terms
46Our multiple funding levers provide access to a deep pool of capital
1 2 3
Raised ~$3 billion in Advanced our capital Have access to
corporate debt and equity recycling program, ~$5 billion of partner
capital markets since announcing $315 million capital to invest
2015 of initiatives in last alongside us
18 months
47We have high quality cash flows
48Cash flows underpinned by a largely perpetual asset base
Hydro facilities are designed, constructed and maintained to operate
over a perpetual life with minimal annual re-investment
~80% 75+ years 95%
FFO FROM AVERAGE REMAINING RETURN ON
HYDRO ASSET LIFE CAPITAL IN FFO
49We actively manage our exposure to financial risks
Interest
FFO
Rates
~90% debt is financed on a fixed
rate basis with no meaningful
100bps near-term maturitiesRisk-reward that is aligned
Peers BEP
8% to 10% IRR
12% to 15% IRR
Investment Grade
Non-amortizing debt backed by
perpetual hydro assets
Converts, tax equity and other
deferral structures
51We offer the lowest risk distribution in our sector
Visibility on 6% to 11% per unit FFO
growth through operational levers
Improving payout ratio
Investment grade
balance sheet
Cash flows supported by a
largely perpetual asset base
52Bringing It All Together – Sachin Shah, Chief Executive Officer
53We have invested over $3 billion of BEP equity since 2013…
2013:
NORTH AMERICA
5,200MW 5,900 MW
TOTAL CAPACITY
BRAZIL
700MW
54…To create a global business with a diverse technology base
Today:
NORTH AMERICA EUROPE
8,300MW 3,700MW 17,400 MW
TOTAL CAPACITY
SOUTH AMERICA ASIA PACIFIC
4,800MW 530MW
55And we have done it on a value basis
Returns
Capital
Deployed
Year (BEP Share) Underwriting Current
Bord Gáis 2014 $280 million 13%+ 18%+
Isagen 2016 $670 million 13%+ 18%+
TerraForm Companies 2017 $875 million 15%+ 20%+
56Allowing us to deliver our targeted annualized returns to unitholders
Total Return
15%
CAGR
2004
2011
2018
2001
2002
2003
2005
2006
2007
2008
2009
2010
2012
2013
2014
2015
2016
2017
BEP S&P
Please refer to endnotes at the end of the presentation
57The future is brighter
than the past
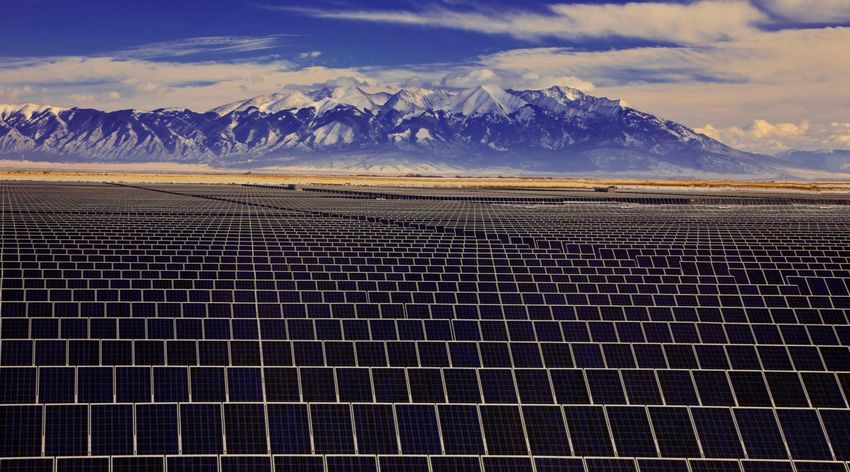
Smoky Mountain, United StatesSolar and wind still account for
less than 10% of global power supply
17%
HYDRO
74%
9% NUCLEAR & FOSSIL FUELS
SOLAR & W IND
Please refer to endnotes at the end of the presentation
59PO L L I N G Q U ESTI O N # 2
How much investment is estimated to be required to
replace existing, non-renewable capacity globally?
a) Less than $1 trillion
b) $1 trillion - $5 trillion
c) $5 trillion - $10 trillion
d) Over $10 trillion
60The investment opportunity in our core markets is large
Incremental Renewable Additions and Investment Size
gigawatts
10,000 $11
trillion
9,000
8,000
7,000
6,000 $5
5,000 trillion
4,000
3,000 $850
billion
2,000
1,000
0
Today 30% Renewables 50% Renewables 100% Renewables
Current Renewables Capacity Incremental Renewables Needed to Meet Target
With up to $11 trillion of new investment needed to move to a carbon-free world
Please refer to endnotes at the end of the presentationProven track record of capital deployment
Since 2013, we have developed or acquired 12,500 MW of capacity,
deploying $3.3 billion of BEP capital across geographies…
$1.0
Thousands
$billions
$0.5
$0.0
2013 2014 2015 2016 2017 2018
Europe North America Latin America Asia
62Proven track record of capital deployment
Since 2013, we have developed or acquired 12,500 MW of capacity,
deploying $3.3 billion of BEP capital across technologies…
$1.0
Thousands
$billions
$0.5
$0.0
2013 2014 2015 2016 2017 2018
Hydro Wind Solar Storage/Other
63Repeatable and flexible growth strategy
Competition BEP
Develop
Capital
STRATEGY
Deployment
Drop Down
vs
TARGET Megawatts 12% to 15%
returns
Deploy $700 million of BEP equity annually into M&A and development
64In the next 5 years, we aim to expand in our core markets…
NORTH AMERICA EUROPE
SOUTH AMERICA ASIA PACIFIC
65Our global business targets strong returns
Target Capital Target
Allocation (%) IRR (%)
Developed Markets ~60% 10% to 12%
Emerging Markets ~25% 15% to 19%
Development ~15% 17% to 20%
TOTAL 12% to 15%
66Key Takeaways…
STRATEGY GLOBAL SCALE
Proven and repeatable strategy combining Global scale across 4 continents affords
a value investment approach with us significant flexibility in moving capital
operating expertise and capital discipline across the world
MULTI-TECHNOLOGY TRACK RECORD
Multi-technology platforms in hydro, wind, 20 year track record in the renewables
solar, distributed generation and storage space, delivering 15% annualized returns
allows us to be nimble with our capital to unitholders
67Q&A
68Endnotes
Page 7
Sources: Bloomberg New Energy Finance, Brookfield estimates
Page 8
Sources: Bloomberg New Energy Finance, Brookfield estimates
Page 9
1) Source: Brookfield estimates.
Page 38
1) Funds From Operations per Unit is a non-IFRS measure used by investors to analyze net earnings from operations without the effects of certain volatile items that generally
have no current financial impact or items not directly related to the performance of the business. For reconciliations to the most directly comparable IFRS measure and
measurement`s rationale as to the usefulness of this financial measure to investors, please see Brookfield Renewable’s Interim and Annual Consolidated Financial Statements
and Notes, Management’s Discussion and Analysis, and Supplemental Information as filed with United States securities regulators at https://www.sec.gov/edgar.shtml and
Canadian securities regulators at https://www.sedar.com/ or on Brookfield Renewable`s website at https://bep.brookfield.com/en.
Page 42
1) Represents historical normalized FFO per unit growth; 2022 forecast based on mid-point of 6% to 11% growth through operational levers and funding for the development
projects sourced from non-dilutive sources. Normalized Funds From Operations is a non-IFRS measure used by investors to analyze net earnings from operations without the
effects of certain volatile items that generally have no current financial impact or items not directly related to the performance of the business. For reconciliations to the most
directly comparable IFRS measure and measurement`s rationale as to the usefulness of this financial measure to investors, please see Brookfield Renewable’s Interim and
Annual Consolidated Financial Statements and Notes, Management’s Discussion and Analysis, and Supplemental Information as filed with United States securities regulators at
https://www.sec.gov/edgar.shtml and Canadian securities regulators at https://www.sedar.com/ or on Brookfield Renewable`s website at https://bep.brookfield.com/en.
Page 43
1) 2018 PF FFO includes 2018 6M YTD normalized FFO that is annualized (adjusted for seasonality) and includes full year FFO contribution of acquisitions (~$70M); 2022 FFO
assumes the mid-point growth range from internal operating levers of 8.5%
2) Based on 5% of FFO
3) Assumes 5% growth in distributions
4) Non-IFRS measure. For reconciliations to the most directly comparable IFRS measure and measurement`s rationale as to the usefulness of this financial measure to investors,
please see Brookfield Renewable’s Interim and Annual Consolidated Financial Statements and Notes, Management’s Discussion and Analysis, and Supplemental Information as
filed with United States securities regulators at https://www.sec.gov/edgar.shtml and Canadian securities regulators at https://www.sedar.com/ or on Brookfield Renewable`s
website at https://bep.brookfield.com/en.
69Endnotes Continued
Page 58
1) Source: Bloomberg; USD return including re-investment of dividends as at 19 September 2018
Page 60
Source: Bloomberg New Energy Finance
Page 62
1) Core markets include Canada, U.S., Brazil, Colombia, U.K., Republic of Ireland, Portugal, India, China, Australia
2) Current renewables capacity excludes hydroelectric, and includes wind, solar, biomass, geothermal and marine technologies
3) Assumes a $1,500 per kilowatt new-build cost for renewables and a 40% capacity factor
70Important Cautionary Notes
All amounts are in U.S. dollars unless otherwise specified. conditions at our wind energy facilities, to irradiance at our looking statements represent our views as of the date of this
Unless otherwise indicated, the statistical and financial solar facilities or to weather generally at any of our facilities; presentation and should not be relied upon as representing
data in this presentation is presented as of June 30, 2018, volatility in supply and demand in the energy markets; our our views as of any subsequent date. While we anticipate
and on a consolidated basis. inability to re-negotiate or replace expiring power purchase that subsequent events and developments may cause our
agreements on similar terms; increases in water rental costs views to change, we disclaim any obligation to update the
CAUTIONARY STATEMENT REGARDING FORWARD- (or similar fees) or changes to the regulation of water forward-looking statements, other than as required by
LOOKING STATEMENTS AND INFORMATION supply; advances in technology that impair or eliminate the applicable law. For further information on these known and
This presentation contains “forward-looking information” competitive advantage of our projects; an increase in the unknown risks, please see “Risk Factors” included in our
within the meaning of Canadian provincial securities laws amount of uncontracted generation in our portfolio; industry Form 20-F.
and “forward-looking statements” within the meaning of risks relating to the power markets in which we operate;
Section 27A of the U.S. Securities Act of 1933, as increased regulation of our operations; increases in the cost CAUTIONARY STATEMENT REGARDING USE OF
amended, Section 21E of the U.S. Securities Exchange of operating our plants; our failure to comply with conditions NON-IFRS MEASURES
Act of 1934, as amended, “safe harbor” provisions of the in, or our inability to maintain, governmental permits; This presentation contains references to financial metrics
United States Private Securities Litigation Reform Act of equipment failures, including relating to wind turbines and that are not calculated in accordance with, and do not
1995 and in any applicable Canadian securities solar panels; dam failures and the costs and potential have any standardized meaning prescribed by,
regulations. Forward-looking statements include liabilities associated with such failures; adverse changes in International Financial Reporting Standards (“IFRS”). We
statements that are predictive in nature, depend upon or currency exchange rates and our inability to effectively believe such non-IFRS measures including, but not limited
refer to future events or conditions, and include statements manage foreign currency exposure; availability and access to, funds from operations (“FFO”) and FFO per unit, are
regarding our and our subsidiaries’ operations, business, to interconnection facilities and transmission systems; useful supplemental measures that may assist investors
financial condition, expected financial results, performance, health, safety, security and environmental risks; disputes, and others in assessing our financial performance and the
growth prospects and distribution profile, growth of FFO governmental and regulatory investigations and litigation; financial performance of our subsidiaries. As these non-
(defined below), priorities, targets, ongoing objectives, counterparties to our contracts not fulfilling their obligations; IFRS measures are not generally accepted accounting
strategies and outlook, as well as the outlook for North the time and expense of enforcing contracts against non- measures under IFRS, references to FFO and FFO per
American and international economies for the current fiscal performing counter-parties and the uncertainty of success; unit, as examples, are therefore unlikely to be
year and subsequent periods, and include, but are not fraud, bribery, corruption, other illegal acts or inadequate or comparable to similar measures presented by other
limited to, statements regarding our asset failed internal processes or systems; our reliance on issuers and entities. These non-IFRS measures have
management. In some cases, forward-looking statements computerized business systems, which could expose us to limitations as analytical tools. They should not be
can be identified by terms such as “expects,” “plans,” cyber-attacks; newly developed technologies in which we considered as the sole measure of our performance and
“estimates,” “seeks,” “targets,” “projects,” “grow” or invest not performing as anticipated; our inability to finance should not be considered in isolation from, or as a
negative versions thereof and other similar expressions, or our operations due to the status of the capital markets; substitute for, analysis of our financial statements prepared
future or conditional verbs such as “may,” “will,” “should,” operating and financial restrictions imposed on us by our in accordance with IFRS. For a more fulsome discussion
“would” and “could.” loan, debt and security agreements; changes to our credit regarding our use of non-IFRS measures and their
ratings; our inability to identify sufficient investment reconciliation to the most directly comparable IFRS
Although we believe that our anticipated future results, opportunities and complete transactions; the growth of our measures refer to our documents which can be found on
performance or achievements expressed or implied by the portfolio and our inability to realize the expected benefits of our website or filed with the securities regulators in
forward-looking statements and information are based our transactions or acquisitions; our inability to develop Canada and the United States.
upon reasonable assumptions and expectations, the greenfield projects or find new sites suitable for the
reader should not place undue reliance on forward- looking development of greenfield projects; foreign laws or
regulation to which we become subject as a result of future References to Brookfield Renewable are to Brookfield
statements and information because they involve known Renewable Partners L.P. together with its subsidiary and
and unknown risks, uncertainties and other factors, many acquisitions in new markets; changes to government
policies that provide incentives for renewable energy; the operating entities unless the context reflects otherwise.
of which are beyond our control, which may cause our and
our subsidiaries’ actual results, performance or effectiveness of our internal controls over financial reporting;
achievements to differ materially from anticipated future our dependence on Brookfield Asset Management and
results, performance or achievements expressed or implied Brookfield Asset Management’s significant influence over
by such forward-looking statements and information. us; and Brookfield Asset Management acting in a way that
is not in the best interests of Brookfield Renewable or our
Factors that could cause actual results to differ materially unitholders.
from those contemplated or implied by forward-looking
statements include, but are not limited to, the following: We caution that the foregoing list of important factors that
changes to hydrology at our hydroelectric facilities, to wind may affect future results is not exhaustive. The forward-
71You can also read