Assays for the Specific Growth Rate and Cell-binding Ability of Rotavirus
←
→
Page content transcription
If your browser does not render page correctly, please read the page content below
Journal of Visualized Experiments                                                                                             www.jove.com

Video Article
Assays for the Specific Growth Rate and Cell-binding Ability of Rotavirus
                    1                1,2
Syun-suke Kadoya , Daisuke Sano
1
Department of Civil and Environmental Engineering, Tohoku University
2
Department of Frontier Science for Advanced Environment, Graduate School of Environmental Studies, Tohoku University

Correspondence to: Daisuke Sano at daisuke.sano.e1@tohoku.ac.jp

URL: https://www.jove.com/video/58821
DOI: doi:10.3791/58821
Keywords: Immunology and Infection, Issue 143, rotavirus, MA104 cell line, specific growth rate, cell-binding ability, plaque assay, RT-qPCR
Date Published: 1/28/2019
Citation: Kadoya, S.s., Sano, D. Assays for the Specific Growth Rate and Cell-binding Ability of Rotavirus. J. Vis. Exp. (143), e58821,
doi:10.3791/58821 (2019).

Abstract
    Rotavirus is the main etiological factor for infantile diarrhea. It is a double-stranded (ds) RNA virus and forms a genetically diverse population,
    known as quasispecies, owing to their high mutation rate. Here, we describe how to measure the specific growth rate and the cell-binding ability
    of rotavirus as its phenotypes. Rotavirus is treated with trypsin to recognize the cell receptor and then inoculated into MA104 cell culture. The
    supernatant, including viral progenies, is collected intermittently. The plaque assay is used to confirm the virus titer (plaque-forming unit: pfu) of
    each collected supernatant. The specific growth rate is estimated by fitting time-course data of pfu/mL to the modified Gompertz model. In the
    assay of cell-binding, MA104 cells in a 24-well plate are infected with rotavirus and incubated for 90 min at 4 °C for rotavirus adsorption to cell
    receptors. A low temperature restrains rotavirus from invading the host cell. After washing to remove unbound virions, RNA is extracted from
    virions attached to cell receptors followed by cDNA synthesis and reverse-transcription quantitative PCR (RT-qPCR). These protocols can be
    applied for investigating the phenotypic differences among viral strains.

Video Link
    The video component of this article can be found at https://www.jove.com/video/58821/

Introduction
                                                                                   1                                   2
    RNA viruses form a genetically diverse population, known as quasispecies , because of their mutation rate, which is higher than that of DNA-
    based organisms. Population structure in quasispecies is affected by the population genetic factors, including mutation, selection pressure, and
    genetic drift. Strains within a single genetic lineage may show different phenotypes because of the genetic diversity. For example, Rachmadi et
                                                                                                                                               3
    al. showed that free chlorine sensitivity was different among murine norovirus strains that originated from a plaque-purified strain S7-PP3 .
                                                                                                                       2
    Rotaviruses (genus rotavirus in reoviridae family) are non-enveloped ds RNA viruses forming quasispecies . In addition to the population
                                                                                                                                               4
    genetic factors described above, genome reassortment affects the genetic diversity of rotavirus because this virus has 11 segmented genomes .
                                                                                                                 5
    Rotaviruses cause diarrhea mainly among infants, and infant deaths in 2013 were estimated about 250,000 . Two vaccines are in use in several
    countries and have been effective in reducing the burden of rotavirus infection, but some researchers are now discussing the presence of
                            6,7,8,9
    vaccine-escape mutants         . The characterization of these mutants is important to understand the vaccine-escape mechanisms.

    Here, we present protocols for two assays for evaluating the specific growth rate and cell-binding ability of rotavirus in order to understand the
                                                                                                                                10
    phenotypic differences among strains/mutants. The growth curve of rotaviruses has been presented in previous reports , but growth parameters
    such as specific growth rate are not usually measured. A cell-binding assay conducted previously involves the immunofluorescent staining
              11
    technique . We show here easier methods of using the plaque assay and RT-qPCR, which allow us to quantitatively discuss the difference in
    viral phenotypes. These methods are appropriate for the characterization of rotavirus phenotypes and may finally contribute to the construction of
    new vaccines effective for multiple genotypes.

Protocol

1. Medium Preparation
    1. To make a cell culture medium (serum-containing medium), add 4.7 g of Eagle’s MEM powder to 500 mL of distilled water. Autoclave at 120
       °C for 20 min and let the medium cool to room temperature. Add fetal bovine serum (final concentration: 10%), L-Glutamine (2 mM), Penicillin
       Streptomycin (1%) and sodium bicarbonate (1.125 g/L). Store at 4 °C for 1 month.
    2. Prepare the serum-free medium for the virus propagation as described in step 1.1, but without the fetal bovine serum. Store at 4 °C for 1
       month.
    3. For the plaque assay, sterilize 100 mL of Eagle’s MEM medium (non-containing phenol red) by autoclaving. Let the medium cool to room
       temperature, and then add 2% FBS, 2% Penicillin Streptomycin, 4 mM L-Glutamine, and 2.25 g/L NaHCO3. Store at 4 °C.

Copyright © 2019 Creative Commons Attribution-NonCommercial-NoDerivs 3.0 Unported                               January 2019 | 143 | e58821 | Page 1 of 6
License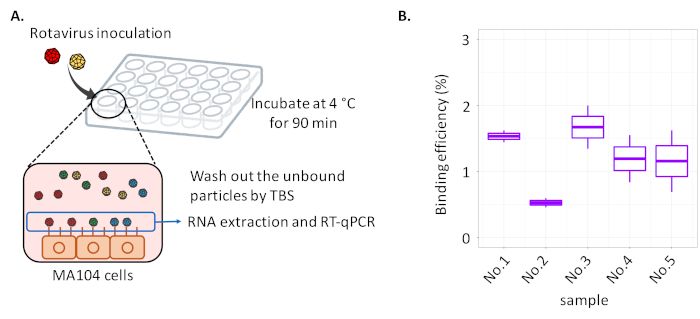
Journal of Visualized Experiments                                                                                               www.jove.com

  4. For the plaque assay, sterilize 100 mL of 2.5% agarose gel by autoclave. Prepare the gel the same day the plaque assay is conducted. Store
     the gel at 47 °C in a water bath.

2. Cell Culture
  1. Remove a cryotube containing MA104 cell lines from the liquid nitrogen container. Place the cryotube in a water bath at 37 °C to thaw the
     cells. Add 1 mL of the cell suspension to 20 mL of the serum-containing medium in a T75 flask. Incubate the flask in an incubator at 37 °C
     and 5% CO2 for 2 or 3 days.
                                                                       6
     NOTE: The final cell concentration in the suspension is about 10 cells/mL.
  2. Once the cell monolayer reaches 80% confluency, remove the supernatant and wash the cells twice with 5 mL of 1x Dulbecco’s PBS
     (phosphate buffered saline).
  3. Add 4 mL of 0.05% trypsin-EDTA to the flask and incubate at 37 °C for 5 min to detach the cells from the flask. Transfer the cell suspension to
     a 15 mL tube and centrifuge at 190 x g for 5 min.
                                                                   6
  4. Discard the supernatant and resuspend the pelleted cells (10 cells) in 1 mL of serum-containing medium prepared in 1.1. Dilute the
     resuspended cells at 100-fold with the medium.
  5. Add 3 mL of the diluted cell suspension to each well of 6-well (for the plaque assay) or 24-well plates (for the cell-binding assay), respectively.
     Incubate the plates in an incubator at 37 °C and 5% CO2 under the saturated vapor for 2 or 3 days.
     NOTE: A T75 flask is suitable to collect the time-course samples because the sample volume of the supernatant (1 mL) can be ignored
     compared to the total supernatant volume (30 mL). Meanwhile, the infectious titer of the virus in each supernatant is measured by the plaque
     assay, which is usually conducted using a 6-well plate. A 24-well plate is utilized for the cell-binding assay.

3. Specific Growth Rate of Rotavirus
  NOTE: Rhesus rotavirus (RRV, genotype: G3P[3]) is utilized in this protocol because RRV can rapidly and easily form plaques with MA104 cells.
                                                                  7
  1. Place a tube containing 1 mL of the virus suspension (10 pfu/mL) in a serum-free medium stored at -80 °C in a water bath at 37 °C to thaw.
      Add 1 µg/µL trypsin from porcine pancreas to 1 mL of the virus suspension (final trypsin concentration is 4 µg/mL) and then vortex. Incubate
      the virus suspension at 37 °C and 5% CO2 under the saturated vapor for 30 min.
      NOTE: Trypsin from the other sources can be used, but the effect on rotavirus infectivity needs to be tested in advance.
  2. Dilute the activated virus suspension with a serum-free medium to adjust the multiplicity of infection (MOI) to 0.1 pfu/cell.
  3. Add 1 mL of diluted virus suspension to MA104 cell lines (80% confluent) in a T75 flask 3 days after the cell plating (2.1), incubate at 37 °C
      for 1 h, and gently shake the flask every 15 min.
  4. Then, add 30 mL of a serum-free medium containing 0.13 µg/mL of trypsin from a porcine pancreas to the flask. Incubate the flask at 37 °C
      and 5% CO2 under the saturated vapor.
  5. Collect 1 mL of the supernatant in the flask at 0, 6, 12, 18, 24, and 36 (and/or 48) h post-infection (hpi) and replace the supernatant in the 1.5
      mL tubes using a pipette.
  6. Conduct the freeze (-80 °C) and melt in a water bath at 37 °C cycle three times. Then centrifuge the tubes at 12,600 x g for 10 min at 4 °C.
      Collect the supernatant.
  7. Filter the supernatant with a distilled 0.2 µm filter to remove the cell fraction. Store the supernatant -80 °C in the refrigerator until applying it to
      the plaque assay for measuring the virus titer.
  8. Place the tubes containing the collected supernatant (step 3.5) in a water bath at 37 °C. Add 4 µg/mL trypsin to a 1 mL of 10-fold diluted
      sample and incubate at 37 °C for 30 min.
  9. During the 30 min incubation in 3.8, to begin the plaque assay for measuring the virus titer obtained from time course samples (step 3.5),
      wash the MA104 cells twice in a 6-well plate with 2 mL of 1x PBS after removing the serum-containing medium.
  10. Serially dilute the incubated samples with a serum-free medium and inoculate 1 mL of the diluted sample into each well. Incubate the plate for
      90 min at 37 °C and 5% CO2 under the saturated vapor, and gently shake the plate every 15 min.
  11. After incubation, remove the inoculum from the 6-well plate. Add 4 µg/mL trypsin to the medium prepared in (step 1.3). Gently but
      immediately add 3 mL of the medium mixed with agarose gel (the ratio is 1:1) to each well.
  12. Keep the plate at room temperature for more than 10 min (until the agarose gel becomes solid) and incubate for 2 days at 37 °C and 5% CO2
      under the saturated vapor.
      NOTE: Pour the medium mixed with agar from the edge of the well.
  13. Add 1 mL of the 0.015% neutral red solution diluted with 1x PBS to each well and incubate at 37 °C and 5% CO2 under the saturated vapor.
      Remove the dye after 3 h and incubate for 1 day at 37 °C and 5% CO2 under the saturated vapor.
  14. The next day, count the number of plaques in each well and calculate the pfu/mL. Carefully check the cell confluence before the plaque assay
      to assure the plaque numbers.

4. Cell-binding Assay
                                                     13
  NOTE: This protocol is based on Gilling’s report .

  1. Add 1 µg/µL trypsin from a porcine pancreas to 1 mL of the virus suspension (final trypsin concentration is 4 µg/mL) and then vortex (in the
     same manner as in 2.1). Dilute the virus suspension with a serum-free medium to adjust the MOI of 1 pfu/cell.
  2. Then, wash the MA104 cells twice on 24-well plate with 1 ml of Tris-buffered saline (TBS; 2.53 g/L Tris base, 6.54 g/L NaCl, 0.3 g/L KCl,
     0.046 g/l Na2HPO4 to reach 1 L with distilled water).
  3. Inoculate 100 µL of diluted virus suspension to each well of a 24-well plate with cells, and incubate at 4 °C for 90 min, with gentle shaking
     every 15 min.

Copyright © 2019 Creative Commons Attribution-NonCommercial-NoDerivs 3.0 Unported                             January 2019 | 143 | e58821 | Page 2 of 6
License
Journal of Visualized Experiments www.jove.com
4. Remove the virus inoculum and wash the cells twice with 1 mL of TBS. To extract the double-stranded (ds) RNA of the rotavirus, add 140 µL
of 1x PBS and 560 µL of the RNA extraction buffer (see Table of Materials) to each well. Mix adequately with a pipette (about 10x or until the
haze or contaminant of cells in the buffer is not seen).
5. After recovering the double stranded RNA (dsRNA) according to the manufacturer’s protocol, place the 1.5 mL tubes containing the dsRNA
extract on a heat block at 95 °C for 5 min to denature the dsRNA, and then immediately place the tubes on ice and incubate for more than 2
min.
6. Synthesize the cDNA by using a reverse transcription kit (see Table of Materials). Add 4 µL of denatured viral RNA solution to a PCR tube
containing 16 µl of mixture (Table 1) and mix it carefully with a pipette so as not to generate bubbles. Spin down the tubes.
7. Perform the reverse transcription with a thermal cycler under the condition shown in Table 2. If the cDNA is not used immediately, store the
PCR tube containing the cDNA at -20 °C for up to 1 year.
14
8. Use the primers for quantitative PCR (Forward; 5’-ACCATCTACACATGACCCTC-3’, Reverse; 5’-GGTCACATAACGCCCC-3’) and a probe
inserting a quencher (qPCR Probes; 5’-/FAM/ATGAGCACA/quencher/ATAGTTAAAAGCTAACACTGTCAA/TAMRA/-3’), targeting the 963 –
1049 region of NSP3 genome segment of rotavirus (ST3 strain, GenBank: X81436).
14
NOTE: Quencher is inserted into the probe designed by Zeng et al.
1 6
9. Dilute the standard plasmid serially (10 to 10 copies/mL) with PCR grade water to the qPCR mixture (Table 3) and make the master mix (20
µL/sample) for qPCR following Table 4.
10. Add 20 µL of the master mix to the well of a 96-well PCR plate, and then mix 5 µL of cDNA samples or 5 µL of the standard plasmid by
pipetting 10 times. Start the reaction of the qPCR system according to the conditions shown in Table 4.
11. To calculate the rotavirus genome bound to the MA104 cell surface, conduct linear regression between Ct values and the known genome
number of a standard plasmid, and estimate the sample’s genome number. Then calculate the ratio of virion numbers binding to cells (Gt) to
those in the initial inoculum (G0).
Representative Results
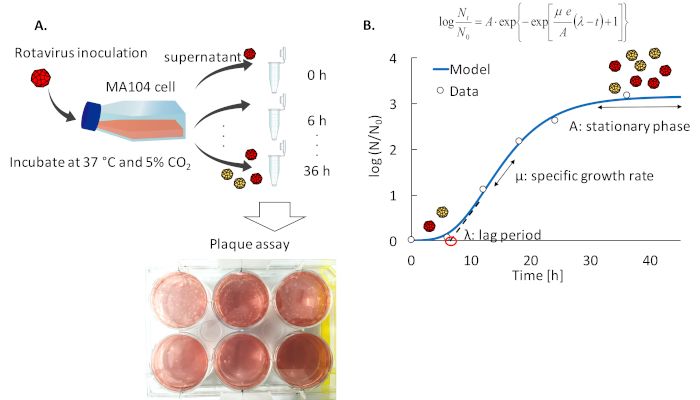
An overview of two protocols for the specific growth rate and cell-binding assay of plaque- purified RRV strains is shown in Figure 1A and 2A,
respectively.
7
In the assay for the specific growth rate, the final virus titer reaches more than 10 pfu/mL when propagating on the T75 flask. If the maximum
7
concentration is lower than 10 pfu/mL, the MA104 cell may not have become confluent or RRV was not activated well by trypsin. Some growth
12
models are available for estimating the specific growth rate using the infectious unit data. In this protocol, the modified Gompertz model is
employed as an example;
4 4 8
where N0 (10 pfu/mL in this study) and Nt (10 to 10 pfu/mL) are the virus infectious titer (pfu/mL) at 0 and t (example: 0, 6, 12, 18, 24, 36) hpi,
respectively, A is the asymptotic value [log(N∞/N0)] (example: 3 to 4), µ is the specific growth rate [1/h], e is the Napier's constant and λ is the lag
period [h]. Model parameters are obtained by the solver function of the analysis software, which minimizes the sum of squares of the difference
between the observed and modeled values. In the example in Figure 1B, the specific growth rate (µ) is estimated to be 0.197 [1/h] and the lag
period (λ) is 6.61 [h] by applying the least square method to a modified Gompertz model, and the relative virus titer at the stationary phase to
the initial titer (log scale) (A) is 3.15 [log (N∞/N0)]. We have tested 6 rotavirus clones in total, and the estimated values of the specific growth rate
ranged from 0.19 to 0.27 [1/h]. These estimated values are reliable because the coefficient of determination values in the model fitting is more
than 0.98.
3
RRV virions binding to cell surfaces were about 10 copies/mL (binding efficiency was around 1%) when using a 24-well plate for the cell-binding
assay (Figure 2B). The assay is usually conducted three times for every sample, and if a large variance in the copy number is observed in a
sample, some problems such as over-washing and insufficient activation of RRV by trypsin may occur. The Ct value of qPCR exceeding about
36.0 is not preferable and is regarded to be below a detection limit in our qPCR condition.
Volume/ 1 reaction
5 x PrimeScript Buffer 4.0 µL
PrimeScript RT Enzyme Mix I 1.0 µL
Oligo dT Primer 1.0 µL
Random 6 mers 4.0 µL
Deionized distilled water 6.0 µL
ssRNA sample 4.0 µL
Total 20.0 µL
Table 1: Master mix composition for cDNA synthesis of rotavirus genome.
Copyright © 2019 Creative Commons Attribution-NonCommercial-NoDerivs 3.0 Unported January 2019 | 143 | e58821 | Page 3 of 6
LicenseJournal of Visualized Experiments www.jove.com
Temperature [°C] Time
37 15 min
42 15 min
85 5s
4 ∞
Table 2: Reaction condition for cDNA synthesis of rotavirus genome.
Volume/1 reaction
Premix Taq 12.5 µL
Forward primer (10 µM) 0.5 µL
Reverse primer (10 µM) 0.5 µL
Probe (10 µM) 0.5 µL
Reference Dye II 0.5 µL
Deionized distilled water 5.5 µL
cDNA sample 5.0 µL
Total 25 µL
Table 3: Master mix composition for quantitative PCR of rotavirus A genome.
Temperature [°C] Time
95 5 min
94 20 s 45 cycle
60 1 min
72 5 min
Table 4: Reaction condition for quantitative PCR of rotavirus A genome.
Figure 1: Schematic overview of the estimation of rotavirus growth and the growth curve of rotavirus. (A) The infectious unit of rotavirus
is measured with the plaque assay. (B) The curve (blue line) was approximated by the modified Gompertz model based on observed data in our
-1
laboratory (white circle). The specific growth rate [µ]; 0.197 [h ], lag period (λ); 6.61 [h], the relative virus titer at the stationary phase to the initial
titer (log scale) (A); 3.15 [log (N∞/N0)]. Please click here to view a larger version of this figure.
Copyright © 2019 Creative Commons Attribution-NonCommercial-NoDerivs 3.0 Unported January 2019 | 143 | e58821 | Page 4 of 6
LicenseJournal of Visualized Experiments www.jove.com
Figure 2: Schematic overview and representative result of the cell-binding assay of five RRV strains purified from plaques in our
laboratory. (A) A cell culture plate inoculated with rotavirus is incubated at 4 °C for inhibiting the virus invasion into cells. After incubation and
removing the unbound viral particles to cells, quantify the number of genomes originating from bound viral particles to the cell surface with RT-
qPCR. (B) The result of the cell-binding assay was displayed as binding efficiency (%), which was the ratio of bound viral particles to those
present in the inoculum. Bold bar: median, end of boxes: quartile deviation, end of line: maximum and minimum. Please click here to view a
larger version of this figure.
Discussion
Our protocol for measuring the specific growth rate is easier than previous ones and can be adapted for other viruses unless their cell culture
system has not yet been established. In this study, we used RRV (G3P[3]) because this strain can form plaques easier than human rotaviruses
when using MA104 cell lines. Some human rotavirus strains cannot form plaque in this cell line. Therefore, instead of the plaque assay, the focus
15 16
forming unit (FFU) assay or median tissue culture infectious dose (TCID50) assay can be applied for many rotavirus strains . The presented
protocol for determining the specific growth rate can be used for other virus types but is not suitable for viruses for which no established cell
culture system is established. Before starting the experiment for the specific growth rate, it is better to know in advance when the virus infectious
titer starts to increase and reaches the stationary phase in a preliminary test. If too many plaques are present, the plaque assay should be
conducted again after changing the dilution rate of the virus samples. The hours post-infection (hpi) to collect samples are also important
because the slope of the exponential growth phase may be underestimated if the proper time point to reach the stationary phase is missed. In
the approximation by the modified Gompertz model, a coefficient of determination should always be calculated and checked. If the fitness to the
12
modified Gompertz model is low, other growth models such as the modified logistic model may be preferable.
In handling cells, when removing the medium or virus inoculum, the PBS for washing or agarose gel for plaque assay must be promptly added
to each well of a cell culture plate to prevent the cells from dryness. At the same time, you must gently pour PBS or agarose to cells not to
detach from wells. This step is the most important in both assays (step 3.9 and 3.11). If the plaque assay has too many samples, we recommend
subdividing the agarose gel (100 mL each maximum is recommended) into several medium bottles and keeping the bottles warm until just before
17
use since agarose gel is solidified within about 10 min at room temperature. Since trypsin is vulnerable to high temperatures , a trypsin solution
should be added to a medium and agarose for the plaque assay after adequately cooling down.
In the cell-binding assay, the incubation for virus binding to cells must be done at 4 °C to prevent invasion of the cells. According to Gilling's
13
method , cells are prone to drying at low temperatures, so gentle shaking is necessary every 15 min during incubation. The RNA extraction kit
utilized here can be substituted for other kits. The slope of the standard curve in RT-qPCR should be approximately 3.3, and the coefficient of
determination should be more than 0.98. Compared to the fluorescence microscope to visualize the localization of viruses in cells, the assay is
more rapid and easier to use because binding of fluorescent substances to viruses is not necessary.
Recently, human intestinal enteroid (HIE), exhibiting a similar cellular composition and function as human gastrointestinal epithelium, has
18
become available for rotavirus propagation . The use of HIE may enable us to evaluate the specific growth rate and cell-binding ability of non-
19
culturable strains of rotavirus. Also, both experiments described here may be applied to the evaluation of drug effects on both phenotypes . The
protocols presented here make it possible to quantitatively discuss the changes in phenotype parameter values of rotavirus strains under varied
conditions.
Disclosures
The authors have nothing to disclose.
Acknowledgments
This work was supported by "The Sanitation Value Chain: Designing Sanitation Systems as Eco-Community Value System" Project,
ResearchInstitute for Humanity and Nature (RIHN, Project No.14200107).
Copyright © 2019 Creative Commons Attribution-NonCommercial-NoDerivs 3.0 Unported January 2019 | 143 | e58821 | Page 5 of 6
LicenseJournal of Visualized Experiments www.jove.com
References
1. Domingo, E. Rna Virus Mutations. Annual review of microbiology. 51, 151-178 (1997).
2. Gouvea, V., & Brantly, M. Is rotavirus a population of reassortants? Trends in Microbiology. 3, 159-162 (1995).
3. Rachmadi, A. T., Kitajima, M., et al. Free-chlorine disinfection as a selection pressure on norovirus. Applied and Environmental Microbiology.
84, (2018).
4. Ghosh, S., & Kobayashi, N. Whole-genomic analysis of rotavirus strains: current status and future prospects. Future Microbiology. 6,
1049-1065 (2011).
5. Tate, J. E., Burton, A. H., Boschi-Pinto, C., Steele, A. D., Duque, J., & Parashar, U. D. 2008 estimate of worldwide rotavirus-associated
mortality in children younger than 5 years before the introduction of universal rotavirus vaccination programmes: A systematic review and
meta-analysis. The Lancet Infectious Diseases. 12, 136-141 (2012).
6. Franco, M. A., Angel, J., & Greenberg, H. B. Immunity and correlates of protection for rotavirus vaccines. Vaccine. 24, 2718-2731 (2006).
7. Santos, N., & Hoshino, Y. Global distribution of rotavirus serotypes/ genotypes and its implication for the development and implementation of
an effective rotavirus vaccine. Reviews in Medical Virology. 15, 29-56 (2005).
8. Matthijnssens, J., Heylen, E., Zeller, M., Rahman, M., Lemey, P., & Van Ranst, M. Phylodynamic analyses of rotavirus genotypes G9 and G12
underscore their potential for swift global spread. Molecular Biology and Evolution. 27, 2431-2436 (2010).
9. Mukhopadhya, I., Murdoch, H., et al. Changing molecular epidemiology of rotavirus infection after introduction of monovalent rotavirus
vaccination in Scotland. Vaccine. 35, 156-163 (2017).
10. Londrigan, S. L., Hewish, M. J., Thomson, M. J., Sanders, G. M., Mustafa, H., & Coulson, B. S. Growth of rotaviruses in continuous human
and monkey cell lines that vary in their expression of integrins. Journal of General Virology. 81, 2203-2213 (2000).
11. Hewish, M. J., Takada, Y., & Coulson, B. S. Integrins a2b1 and a4b1 can mediate SA11 rotavirus attachment and entry into cells. Journal of
Virology. 74, 228-236 (2000).
12. Zwietering, M. H., Jongenburger, I., Rombouts, F. M., van 't Riet, K. Modeling of the bacterial growth curve. Applied and Environmental
Microbiology. 56, 1875-1881 (1990).
13. Gilling, D. H., Kitajima, M., Torrey, J. R., & Bright, K. R. Mechanisms of antiviral action of plant antimicrobials against murine norovirus.
Applied and Environmental Microbiology. 80, 4898-4910 (2014).
14. Zeng, S. Q., Halkosalo, A., Salminen, M., Szakal, E. D., Puustinen, L., & Vesikari, T. One-step quantitative RT-PCR for the detection of
rotavirus in acute gastroenteritis. Journal of Virological Methods. 153, 238-240 (2008).
15. Rolsma, M. D., Gelberg, H. B., & Kuhlenschmidt, M. S. Assay for evaluation of rotavirus-cell interactions: identification of an enterocyte
ganglioside fraction that mediates group A porcine rotavirus recognition. Journal of Virology. 68, 258-68 (1994).
16. Brüssow, H., Hilpert, H., Walther, I., Sidoti, J., Mietens, C., & Bachmann, P. Bovine milk immunoglobulins for passive immunity to infantile
rotavirus gastroenteritis. Journal of Clinical Microbiology. 25, 982-986 (1987).
17. Outzen, H., Berglund, G. I., Smalås, A. O., & Willassen, N. P. Temperature and pH sensitivity of trypsins from Atlantic salmon (Salmo salar) in
comparison with bovine and porcine trypsin. Comparative Biochemistry and Physiology - B Biochemistry and Molecular Biology. 115B, 33-45
(1996).
18. Saxena, K., Blutt, S. E., et al. Human Intestinal Enteroids: a New Model To Study Human Rotavirus Infection, Host Restriction, and
Pathophysiology. Journal of Virology. 90, 43-56 (2016).
19. Yin, Y., Bijvelds, M., et al. Modeling rotavirus infection and antiviral therapy using primary intestinal organoids. Antiviral Research. 123,
120-131 (2015).
Copyright © 2019 Creative Commons Attribution-NonCommercial-NoDerivs 3.0 Unported January 2019 | 143 | e58821 | Page 6 of 6
LicenseYou can also read