National Roadway Safety Strategy - United States Department of Transportation | January 2022
←
→
Page content transcription
If your browser does not render page correctly, please read the page content below
National Roadway Safety Strategy
    United States Department of Transportation | January 2022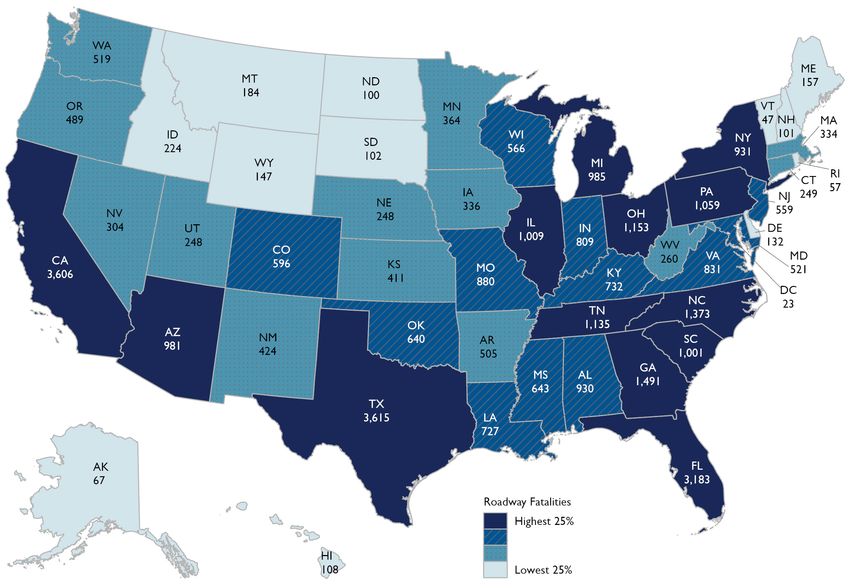
1200 New Jersey Ave., SE
Washington, DC 20590
Contents
Letter from the Secretary .................................................................................................................................... ii
The Roadway Safety Problem..............................................................................................................................1
Introduction to the National Roadway Safety Strategy ......................................................................................5
   U.S. DOT Vision for Roadway Safety................................................................................................................5
   Safe System Approach .....................................................................................................................................6
   Opportunities to Simultaneously Address Safety, Equity, and Climate.........................................................7
Objectives and Implementation ....................................................................................................................... 11
   Safer People .................................................................................................................................................. 14
   Safer Roads ................................................................................................................................................... 18
   Safer Vehicles................................................................................................................................................ 22
   Safer Speeds ................................................................................................................................................. 26
   Post-Crash Care............................................................................................................................................. 29
Conclusion ......................................................................................................................................................... 31
Summary of Key Departmental Actions........................................................................................................... 32

  National Roadway Safety Strategy                                                                                                                                 i
Letter from the Secretary
Our priority at the Department of Transportation is to make our transportation system safe for all people.
Right now, we face a crisis on our roadways. Almost 95 percent of our Nation’s transportation deaths
occur on America’s streets, roads, and highways, and they are on the rise. An estimated 38,680 people
died in motor vehicle crashes in 2020. In the first half of 2021, an estimated 20,160 people died, up
18.4 percent compared to the first six months of 2020. And every year, millions more are seriously and
often permanently injured. Those lost are our family members, our friends, our colleagues, our neighbors.
They are the people who build, maintain, and fix our roads. They are the people who deliver critical goods,
and those who risk their own lives to keep us safe.

The status quo is unacceptable, and it is preventable. We know it’s preventable because bold cities in the
United States, and countries abroad, have achieved tremendous reductions in roadway deaths. We
cannot accept such terrible losses here. Americans deserve to travel safely in their communities. Humans
make mistakes, and as good stewards of the transportation system, we should have in place the
safeguards to prevent those mistakes from being fatal. Zero is the only acceptable number of deaths and
serious injuries on our roadways.

This National Roadway Safety Strategy describes the major actions we will take to make a meaningful
difference over the next few years. At the core of this strategy is a Department-wide adoption of the Safe
System Approach, which focuses on five key objectives: safer people, safer roads, safer vehicles, safer
speeds, and post-crash care. We will launch new programs, coordinate and improve existing programs,
and adopt a foundational set of principles to guide this strategy.

One of the Safe System Approach principles is that roadway safety is a shared responsibility. We applaud
those who have already committed to zero roadway fatalities and serious injuries, and understand that no
one will achieve this goal alone. While U.S. DOT has many tools at its disposal and will shoulder our
responsibility, this must be a coordinated effort with our stakeholders across the public sector, private
sector, advocacy, and research communities. It will take a sustained, urgent, yet lasting commitment from
the people who build and manage our roads, construct our motor vehicles, and use vehicles as part of
their businesses to support actions that protect people and prevent harm.

The traveling public also has a role to play. Each of us uses our roads almost every day, whether as a
motorist, a passenger, or someone walking, biking, or rolling. Our actions should prioritize safety first.
Always.

Thank you for your commitment to saving lives on our roadways. I look forward to meeting this challenge
together.

                                                                                     Secretary Pete Buttigieg

 National Roadway Safety Strategy                                                                            ii
The Roadway Safety Problem
The foundation of our mission at the United States Department of Transportation (U.S. DOT or the
Department) is to ensure America has the safest transportation system in the world. Almost 95 percent of
the Nation’s transportation deaths occur on its streets, roads, and highways, and they are on the rise. 1
The rate of roadway fatalities per 100 million vehicle miles traveled has not substantially improved over
the last ten years, and increased significantly in 2020. An estimated 38,680 people died in motor vehicle
crashes in 2020, of which an estimated 6,236 were people walking. 2 In the first six months of 2021 an
estimated 20,160 people died in motor vehicle crashes, up 18.4 percent over 2020. That is the largest
number of projected fatalities for January through June since 2006. 3 Since 2015, the annual number of
fatalities has exceeded 35,000, with millions more injured – sometimes permanently – each year. Traffic
crashes are a leading cause of death for teenagers in America, and disproportionately impact people who
are Black, American Indian, and live in rural communities. 4

We face a crisis on our roadways; it is both unacceptable and solvable.

More than 370,000 people died in transportation incidents over the last decade
(2011-2020) in the United States. More than 350,000 of them died on our roads.

1 Caution must be exercised in comparing fatalities across modes because significantly different definitions are used. In

particular, Rail and Transit fatalities include incidents that do not involve vehicles, such as fatalities from falls in transit
stations or railroad employee fatalities from a fire in a work shed.
2 https://crashstats.nhtsa.dot.gov/Api/Public/ViewPublication/813118
3 https://crashstats.nhtsa.dot.gov/Api/Public/ViewPublication/813199
4 National Vital Statistics System, National Center for Health Statistics, Centers for Disease Control and Prevention; FARS

2018 Final File/Census Bureau

 National Roadway Safety Strategy                                                                                                  1
Roadway fatalities and the fatality rate declined consistently for 30 years, but
             progress has stalled over the last decade and went in the wrong direction in 2020.

Source: Fatality Analysis Reporting System
Year                                 1975   1976     1977     1978     1979     1980     1981     1982     1983     1984     1985     1986     1987     1988     1989     1990     1991     1992     1993     1994     1995     1996     1997     1998     1999     2000     2001     2002     2003     2004     2005     2006     2007     2008     2009     2010     2011     2012     2013     2014     2015     2016     2017     2018     2019     2020
Fatalities                           44,525 45,523   47,878   50,331   51,093   51,091   49,301   43,945   42,589   44,257   43,825   46,087   46,390   47,087   45,582   44,599   41,508   39,250   40,150   40,716   41,817   42,065   42,013   41,501   41,717   41,945   42,196   43,005   42,884   42,836   43,510   42,708   41,259   37,423   33,883   32,999   32,479   33,782   32,893   32,744   35,484   37,806   37,473   36,835   36,096   38,680

                                                                                                                    38,680 people died on America’s roads in 2020
Fatality Rate per 100 Millio n VMT   3.35   3.25     3.26     3.26     3.34     3.35     3.17     2.76     2.58     2.57     2.47     2.51     2.41     2.32     2.17     2.08     1.91     1.75     1.75     1.73     1.73     1.69     1.65     1.58     1.55     1.53     1.51     1.51     1.48     1.44     1.46     1.42     1.36     1.26     1.15     1.11     1.10     1.14     1.10     1.08     1.15     1.19     1.17     1.14     1.11     1.37

                        Compared to 2019, fatalities increased:
                           • 7.2% overall
                           • 23% per mile driven
                           • 23% among Black people
                           • 20% involving persons ejected from a vehicle
                           • 18% among ages 25-34
                           • 15% among passenger vehicle occupants not wearing seatbelts
                           • 15% among ages 16-24
                           • 14% among ages 35-44
                           • 11% in speeding-related crashes
                           • 9% in crashes with police-reported alcohol involvement
                           • 9% among motorcyclists

Source: Early Estimates of Motor Vehicle Traffic Fatalities and Fatality Rate by Sub-Categories in 2020, National Highway Traffic Safety
Administration, DOT HS 813 118, June 2021

It is important to acknowledge the characteristics of America’s roadway network as a highly complex, de-
centralized system with an array of entities responsible for specific aspects that influence safety
outcomes. State, Tribal, regional, and local governments manage many elements of this system, with
significant levels of autonomy and flexibility to make context-specific decisions, including on roadway
location and design, how and where funds are spent to create and maintain road networks, what laws
should be enacted within their jurisdiction, and how these laws are implemented. Those who perform
commercial operations on our roads, original equipment manufacturers such as automotive
manufacturers, and the traveling public further influence safety outcomes. The United States Department
of Transportation has a range of authorities and oversight responsibilities over different elements of the
transportation system, including the safety of motor vehicles and motor vehicle equipment, the safe
operation of commercial vehicles, and stewardship over many of the Nation’s highways, roads, and

              National Roadway Safety Strategy                                                                                                                                                                                                                                                                                                                                                                                                          2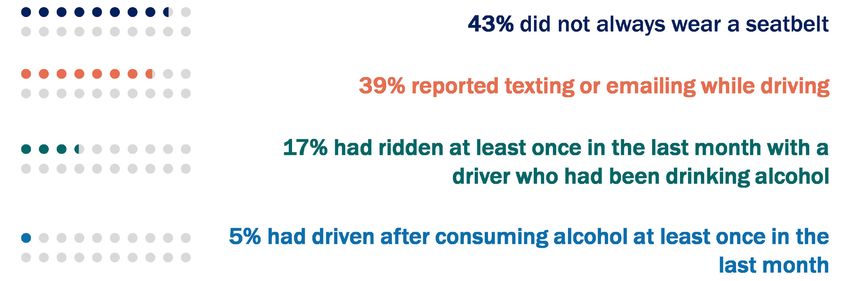
streets. This nuanced and de-centralized system leads to disparate outcomes across localities and
portions of the system, and complicates the landscape to address the roadway safety problem.
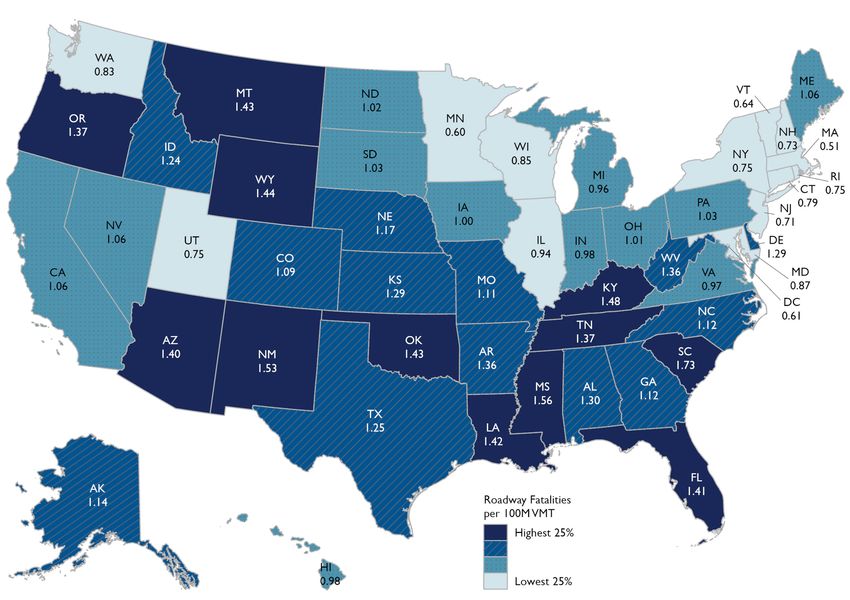
As shown in the maps below, deaths are not evenly distributed across the United States of America,
influenced by a range of factors such as where the Nation’s population centers are located (highlighted in
the first map depicting overall roadway fatalities per state). The second map illustrates the vastly
divergent fatality rates among the states, which highlight the heterogenous nature of the Nation’s safety
problem. One major factor that explains the difference in fatality rates is whether a particular state is
predominantly rural or urban. Nationwide, the rural fatality rate is approximately two times higher than the
urban fatality rate.
Roadway Fatalities by State, 2019
State (Abv) AK AL AR AZ CA CO CT DC DE FL GA HI IA ID IL IN KS KY LA MA MD ME MI MN MO MS MT NC ND NE NH NJ NM NV NY OH OK OR PA RI SC SD TN TX UT VA VT WA WI WV WY
Fatalities 67 930 505 981 3,606 596 249 23 132 3,183 1,491 108 336 224 1,009 809 411 732 727 334 521 157 985 364 880 643 184 1,373 100 248 101 559 424 304 931 1,153 640 489 1,059 57 1,001 102 1,135 3,615 248 831 47 519 566 260 147
Fatalities- Quartiles 1 3 2 4 4 3 2NA 1 4 4 1 2 1 4 3 2 3 3 2 3 1 4 2 3 3 1 4 1 2 1 3 2 2 4 4 3 2 4 1 4 1 4 4 2 3 1 2 3 2 1
Source: Fatality Analysis Reporting System
National Roadway Safety Strategy 3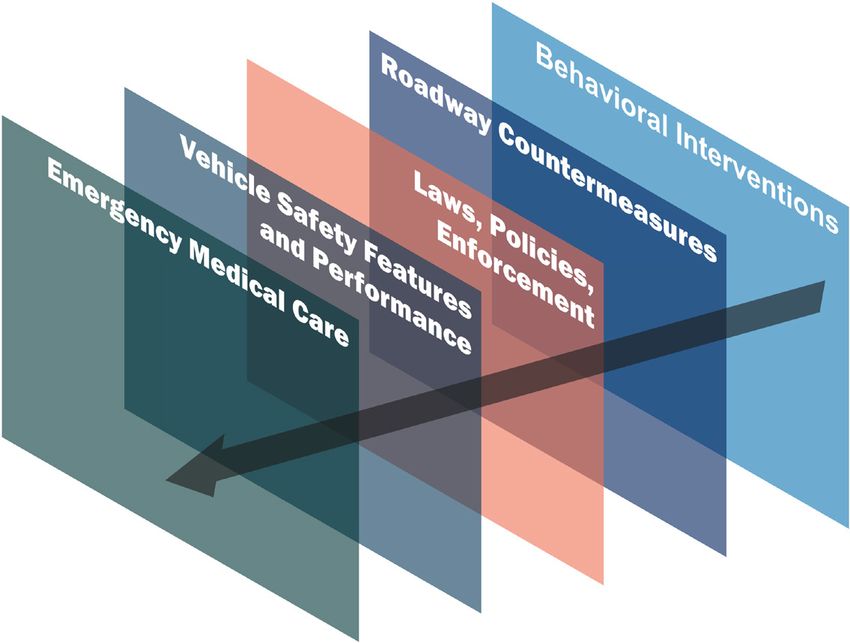
Roadway Fatality Rate (per 100 Million Vehicle Miles Traveled) by State, 2019

State (Abv)                                  AK      AL      AR      AZ      CA      CO      CT      DC       DE      FL      GA      HI      IA      ID      IL      IN      KS      KY      LA      MA          MD      ME      MI          MN          MO      MS          MT      NC      ND          NE          NH      NJ      NM          NV          NY      OH          OK      OR      PA          RI          SC      SD      TN          TX          UT      VA          VT      WA      WI          WV          WY
Fatalities per 100 million VMT                    1.14    1.30    1.36    1.40    1.06    1.09    0.79     0.61    1.29    1.41    1.12    0.98    1.00    1.24    0.94    0.98    1.29    1.48    1.42    0.51        0.87    1.06    0.96        0.60        1.11    1.56        1.43    1.12    1.02        1.17        0.73    0.71    1.53        1.06        0.75    1.01        1.43    1.37    1.03        0.75        1.73    1.03    1.37        1.25        0.75    0.97        0.64    0.83    0.85        1.36        1.44
Fatalities per 100 million VMT - Quartiles           3       3       3       4       2       3       1NA              3       4       3       2       2       3       1       2       3       4       4       1           1       2       2           1           3       4           4       3       2           3           1       1       4           2           1       2           4       4       2           1           4       2       4           3           1       2           1       1       1           3           4

Source: Fatality Analysis Reporting System

              National Roadway Safety Strategy                                                                                                                                                                                                                                                                                                                                                                                                                                                                          4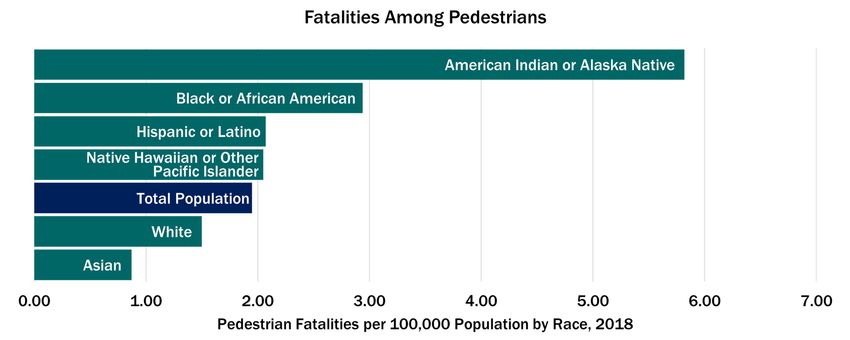
Introduction to the National Roadway Safety Strategy
The United States Department of Transportation National Roadway Safety Strategy (NRSS) outlines the
Department’s comprehensive approach to significantly reducing serious injuries and deaths on our
Nation’s highways, roads, and streets. This is the first step in working toward an ambitious long-term goal
of reaching zero roadway fatalities. Safety is U.S. DOT’s top priority, and the NRSS represents a
Department-wide approach to working with stakeholders across the country to achieve this goal.

The NRSS sets a vision and goal for the safety of the Nation’s roadways, adopts the Safe System
Approach principles to guide our safety actions, and identifies critical and significant actions the
Department will take now in pursuit of five core objectives: Safer People, Safer Roads, Safer Vehicles,
Safer Speeds, and Post-Crash Care. This document highlights new priority actions that target our most
significant and urgent problems, and are, therefore, expected to have the most substantial impact. It also
highlights notable changes to existing practices and approaches.

The NRSS is a collaborative effort between the Office of the Secretary of Transportation and the Operating
Administrations (OAs) whose roles and responsibilities include roadway safety:

       •   Federal Highway Administration (FHWA)
       •   Federal Motor Carrier Safety Administration (FMCSA)
       •   Federal Railroad Administration (FRA)
       •   Federal Transit Administration (FTA)
       •   National Highway Traffic Safety Administration (NHTSA)
       •   Pipeline and Hazardous Materials Safety Administration (PHMSA)
The recent passage of the Bipartisan Infrastructure Law (BIL or the Infrastructure Investment and Jobs
Act) is a generational investment in America’s transportation network, and supports the funding, program,
and policy provisions described in the NRSS safety actions. 5

                               U.S. DOT Vision for Roadway Safety
Together, we must strive for zero roadway fatalities. Zero is the only acceptable number of deaths on our
highways, roads, and streets. The United States Department of Transportation is committed to taking
substantial, comprehensive action to significantly reduce serious and fatal injuries on the Nation’s
roadways. However, no one will reach this goal acting alone. Reaching zero will require U.S. DOT to work
with the entire roadway transportation community and the American people to lead a significant cultural
shift that treats roadway deaths as unacceptable and preventable.

5   Public Law No: 117-58. https://www.congress.gov/bill/117th-congress/house-bill/3684/text

    National Roadway Safety Strategy                                                                     5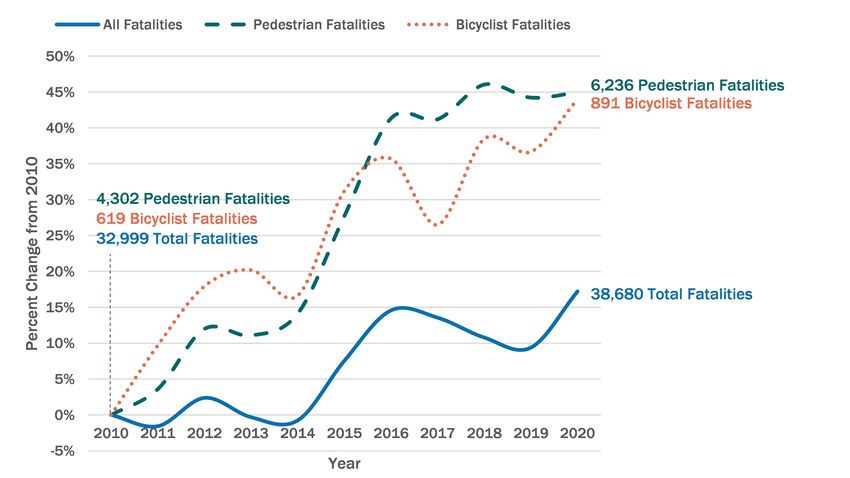
Safe System Approach
U.S. DOT adopts the Safe System Approach as the guiding paradigm to address roadway safety. 6 This
differs significantly from a conventional safety approach in that it acknowledges both human mistakes
and human vulnerability, and designs a redundant system to protect everyone. For the purposes of both
the National Roadway Safety Strategy and the Department’s ongoing safety programs, U.S. DOT
recognizes the Safe System Approach as encompassing all the roadway safety interventions required to
achieve the goal of zero fatalities, including safety programs focused on infrastructure, human behavior,
responsible oversight of the vehicle and transportation industry, and emergency response. The Safe
System Approach and this roadway safety policy are inclusive of all road users in all communities and the
many people who use roads and streets outside of motor vehicles. Just as the needs of people change
and how they move evolves over time, how the Department implements the Safe System Approach will be
iterative and will adapt to how people use the Nation’s highways, roads, and streets.

A Safe System Approach incorporates the following principles:

       1. Death and Serious Injuries are Unacceptable. While no crashes are desirable, the Safe System
          Approach prioritizes the elimination of crashes that result in death and serious injuries since no
          one should experience either when using the transportation system.
       2. Humans Make Mistakes. People will inevitably make mistakes and decisions that can lead or
          contribute to crashes, but the transportation system can be designed and operated to
          accommodate certain types and levels of human mistakes, and avoid death and serious injuries
          when a crash occurs.
       3. Humans Are Vulnerable. People have physical limits for tolerating crash forces before death or
          serious injury occurs; therefore, it is critical to design and operate a transportation system that is
          human-centric and accommodates physical human vulnerabilities.
       4. Responsibility is Shared. All stakeholders – including government at all levels, industry, non-
          profit/advocacy, researchers, and the public – are vital to preventing fatalities and serious
          injuries on our roadways.
       5. Safety is Proactive. Proactive tools should be used to identify and address safety issues in the
          transportation system, rather than waiting for crashes to occur and reacting afterwards.
       6. Redundancy is Crucial. Reducing risks requires that all parts of the transportation system be
          strengthened, so that if one part fails, the other parts still protect people.
The Department will work to ensure the goal of reaching zero roadway fatalities and the principles of an
integrated Safe System Approach are part of the implementation of all U.S. DOT program activities that
affect the Nation’s roadways.

6   https://safety.fhwa.dot.gov/zerodeaths/docs/FHWA_SafeSystem_Brochure_V9_508_200717.pdf

    National Roadway Safety Strategy                                                                          6
Opportunities to Simultaneously Address Safety, Equity, and Climate Safety is and will always be the Department’s top priority. Roadway safety is also a foundational pre- requisite to our success in addressing two other major priorities: equity and climate. The Executive Order on Advancing Racial Equity and Support for Underserved Communities Through the Federal Government (EO 13985) pursues a comprehensive approach to advancing equity for all, including people of color and others who have been historically underserved, marginalized, and adversely affected by persistent poverty and inequality. 7 An important area for U.S. DOT’s focus is the disproportionate, adverse safety impacts that affect certain groups on our roadways. For example, fatalities among Black people increased by 23 percent between 2019 and 2020 compared to an overall increase of 7.2 percent. 8 People who are American Indian and Alaska Native have roadway fatality rates more than double the national rate on a per population basis. 9 Although men consistently represent more than 70 percent of drivers involved in fatal crashes, when comparable crashes are analyzed and risk taking differences are accounted for, studies have shown that motor vehicle fatality risk is, on average, 17 percent higher for a female than for a male of the same age. 10 The disproportionate safety impacts are especially true in underserved communities, where people face heightened exposure to risk. The 40 percent of counties with the highest poverty rates in 2019 experienced a fatality rate 35 percent higher than the national average on a per population basis. 11 7 https://www.federalregister.gov/documents/2021/01/25/2021-01753/advancing-racial-equity-and-support-for- underserved-communities-through-the-federal-government 8 https://crashstats.nhtsa.dot.gov/Api/Public/ViewPublication/813118 9 FARS 2018 Final File; Population – Census Bureau 10 https://crashstats.nhtsa.dot.gov/Api/Public/ViewPublication/811766 11 FARS 2019 data publication, 1st release; Poverty rates and Population data by County, U.S. Census. The fatality rate for the top 40 percent of counties by poverty rate was 14.9 per 100,000 population versus 11.0 for the country. National Roadway Safety Strategy 7
Fatalities impact communities differently…

                                …particularly for people not in a vehicle.

Sources: FARS 2018 Final File; Population – Census Bureau 12

12 Note: The x-axis scales in the all roadway fatalities, pedestrian fatalities, and bicyclist fatality charts, respectively, are all

different.

 National Roadway Safety Strategy                                                                                                  8
To achieve zero roadway fatalities and a transportation system that is safe for all users, all actors in our transportation system must acknowledge and address historic and ongoing inequities. Law enforcement and the work of our Nation’s law enforcement officers are critical to the prevention and reduction of traffic-related fatalities and injuries. Traffic enforcement must have equity – the consistent, fair, just, and impartial treatment of all people – at its foundation. Under the Safe System Approach, efforts to make our roads safer should affirmatively improve equity outcomes. The Department will advance equity as an instrumental component of transportation safety and convene key stakeholders – government at all levels, law enforcement, advocacy, community organizations, and the general public – to develop both a better understanding of the intersection of equity and roadway safety, and a comprehensive approach to incorporating equity into all of the Department’s efforts to achieve zero roadway fatalities and serious injuries. In the case of climate change, the Executive Order 14008 on Tackling the Climate Crisis at Home and Abroad deploys the full capacity of Federal executive agencies to combat the climate crisis by implementing a Government-wide approach that: reduces climate pollution in every sector of the economy; increases resilience to the impacts of climate change; protects public health; conserves our lands, waters, and biodiversity; and delivers environmental justice. 13 As climate change continues to re- shape our environment, its future effects on roadway safety will need to be taken into account. For example, weather events are expected to become more severe as a result of climate change. How we address adverse weather and roadway conditions may need to be adapted to effectively mitigate increasingly extreme weather events. Improved safety on our roadways is also needed to support one critical component of strategies to achieve transportation greenhouse gas reductions goals: increased use of transit, walking, rolling, and riding. People who select climate-friendly transportation options decrease transportation-related emissions that contribute to climate change. Such reductions also can improve air quality and provide health benefits to those using and living near highways, roads, and streets with heavy motor vehicle traffic. Yet people walking and biking suffer disproportionately from serious injuries and fatalities when a crash occurs compared to people in vehicles. Moreover, fatalities among pedestrians and bicyclists have been increasing faster than roadway fatalities overall in the past decade, which has a chilling effect on climate-friendly transportation options such as walking, biking, or taking public transportation. To unlock the climate benefits of those modes, we need road and street systems that feel safe and are safe for all road users. The climate, health, and other co-benefits of safety improvements on our roadways and in the surrounding environment are substantial, and further support the benefits of a focused roadway safety effort. 13 https://www.federalregister.gov/documents/2021/02/01/2021-02177/tackling-the-climate-crisis-at-home-and-abroad National Roadway Safety Strategy 9
Fatalities among all users have been increasing.
  Fatalities among pedestrians and bicyclists have been increasing even faster.

Source: Fatality Analysis Reporting System

 National Roadway Safety Strategy                                            10
Objectives and Implementation
Implementation of the NRSS will be arranged around five complementary objectives corresponding to the
Safe System Approach elements:
• Safer People: Encourage safe, responsible behavior by people who use our roads and create
conditions that prioritize their ability to reach their destination unharmed.
• Safer Roads: Design roadway environments to mitigate human mistakes and account for injury
tolerances, to encourage safer behaviors, and to facilitate safe travel by the most vulnerable
users.
• Safer Vehicles: Expand the availability of vehicle systems and features that help to prevent
crashes and minimize the impact of crashes on both occupants and non-occupants.
• Safer Speeds: Promote safer speeds in all roadway environments through a combination of
thoughtful, context-appropriate roadway design, targeted education and outreach campaigns,
and enforcement.
• Post-Crash Care: Enhance the survivability of crashes through expedient access to emergency
medical care, while creating a safe working environment for vital first responders and preventing
secondary crashes through robust traffic incident management practices.
The sections below highlight the importance of each NRSS objective area and outline notable actions that
U.S. DOT is committed to taking in each area.
Addressing each of these areas is critical, as their impact can be complementary and build redundancy.
The overlapping set of safety measures in a Safe System Approach is similar to the Swiss cheese model
for safety long used in the aviation industry, which notes the importance of differing layers and types of
defenses and aligns with Safe System Approach principles.14 The purpose of the NRSS and its adoption
of the Safe System Approach is to address contributing factors from all angles and build layers of
prevention, protection, and mitigation. Similarly, actions taken by the Department must be augmented by
actions taken by partners across the entire transportation community to ultimately be successful in
reaching our goal of zero. Crashes are complex events involving a multitude of factors. Certain strategies
or interventions could have prevented some of the crashes described above from occurring, while others,
such as seat belt use, could have prevented them from being fatal or causing serious injury.
14 Reason, James (1990-04-12). "The Contribution of Latent Human Failures to the Breakdown of Complex
Systems". Philosophical Transactions of the Royal Society of London. Series B, Biological Sciences. 327
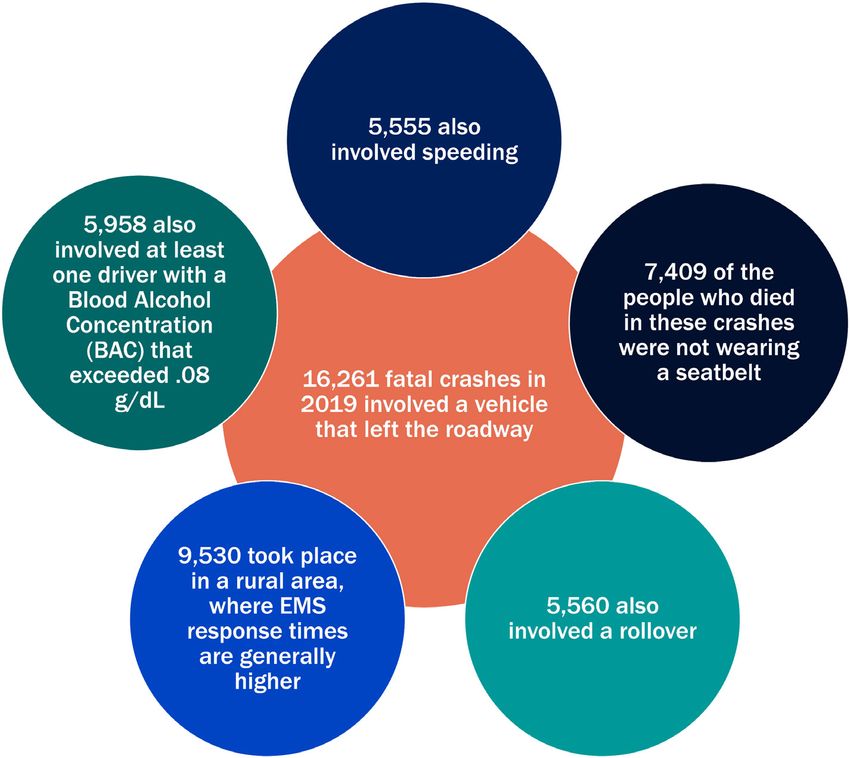
National Roadway Safety Strategy 11All layers of a Safe System Approach are critical.
To provide an illustrative example, among the 16,261 fatal crashes involving a
vehicle that left the roadway in 2019, thousands also involved other
contributing factors:
Source: Fatality Analysis Reporting System
National Roadway Safety Strategy 12Identifying, prioritizing, and acting to address the contributing factors associated with crashes depends heavily upon accurate and timely data. U.S. DOT collects, maintains, and disseminates vast data resources, yet room for expansion and improvement exists. While certain issues may only be understood anecdotally or through local data, robust national action often requires detailed and widely available data. The Department seeks opportunities to expand the availability and timeliness of data at all levels of government, particularly data on safety impacts to specific user groups and data that advance the knowledge necessary to understand how to significantly reduce serious injuries and fatalities on our highways, roads, and streets. National Roadway Safety Strategy 13
Safer People
The safety of people is U.S. DOT’s core mission. Enabling people to be safer encompasses actions to
encourage safer behaviors. This includes the driving public, commercial drivers, and all road users. How
individuals use our highways, roads, and streets plays an important role in determining safety outcomes.
People generally use the roadway system in a safe manner on any given trip, but mistakes, lapses in
judgement, and other more significant risky behaviors still occur.

Dangerous behaviors like impaired driving and excessive speeding threaten the safety of all road users,
not just individual drivers. The overwhelming majority of serious and fatal crashes includes at least one
human behavioral issue as a contributing factor. People in motor vehicles not wearing seat belts, driving
while impaired from alcohol, and speeding are the three most frequent and persistent factors. Recent
research indicates such behavioral issues have been major contributing factors to the increase in
fatalities during the COVID-19 public health crisis. 15 States play an important role in addressing these
behaviors through legislation such as seat belt laws. Issues such as distraction, drug impairment, and
fatigue also contribute to thousands of fatal crashes per year.

           Risky behaviors are a significant contributor to roadway fatalities.

*At least one driver with Blood Alcohol Concentration .08 g/dL or higher
Source: Fatality Analysis Reporting System

Some behavioral factors are especially prominent among certain groups, and understanding the
prevalence and concentration of these safety risks among different demographic groups can inform the
interventions needed and target audiences to reach. For example, younger people who may be less

15 https://www.nhtsa.gov/sites/nhtsa.gov/files/2021-10/Traffic-Safety-During-COVID-19_Jan-June2021-102621-v3-

tag.pdf

 National Roadway Safety Strategy                                                                               14
experienced and more risk tolerant require tailored interventions for effective outreach and education.
Furthermore, more than 70 percent of drivers involved in fatal crashes in 2019 were men, even though
the number of male and female drivers is about equal. 16 Considerations of demographic shifts such as
increases in the older driving population informs the types of efforts implemented, focus needed,
redundancies required, and how safety is communicated.
Risky behaviors are particularly common among younger drivers. Among
surveyed high school students:
Source: Transportation Risk Behaviors Among High School Students — Youth Risk Behavior Survey, United States, 2019
In 2019, 11,917 people died in crashes where a driver with some alcohol in their system – a Blood
Alcohol Concentration or BAC > 0.01 – was involved. Furthermore, roughly two thirds of all alcohol
impaired fatalities involve high blood alcohol levels with a BAC > 0.15. 17 To strongly discourage repeated
impaired driving and prevent recidivism, approaches to address alcohol-impaired driving need to focus on
assessment and treatment such as ignition interlock programs. Such efforts also require working with the
behavioral and public health communities to assess those with substance use disorders, educate drivers
on the risks of impaired driving, and support alternative transportation options. Considerable progress in
behavioral research has been made to advance our knowledge and understanding of the physiological
effects of both alcohol and drug impaired driving. U.S. DOT collaborates closely with toxicology experts
and laboratories. The Department is also working on ways to measure drug and alcohol impairment.
Accurately measuring drug impairment continues to be a priority and, through research funded in the
Bipartisan Infrastructure Law, that work will continue.
Safe behavior among professional drivers is also critical, particularly given their time on the road and the
size and weight of commercial motor vehicles. This is especially true of motor coaches and buses that
transport multiple people in one vehicle. The Department is responsible for overseeing the safe operation
16 https://crashstats.nhtsa.dot.gov/Api/Public/ViewPublication/813209
17 https://crashstats.nhtsa.dot.gov/Api/Public/ViewPublication/813120
National Roadway Safety Strategy 15of commercial trucks, buses, and transit vehicles. This includes a focus on behavioral safety, such as drug and alcohol testing to address use and impairment offenses by commercial driver’s license (CDL) holders. For example, the Drug and Alcohol Clearinghouse recorded more than 54,000 drug and alcohol violations in 2020. 18 While safe behaviors among commercial drivers is critical, it is also important to leverage other approaches to make sure that commercial driving is a safe, healthy, and viable profession, in recognition of its vital importance to the Nation’s economic prosperity. A comprehensive Safe System Approach involves using all available tools, including education, outreach, engineering solutions, and enforcement. The Department will continue to promote effective practices focused on behavioral safety such as alcohol ignition interlock devices and administrative license suspensions to deter impaired driving, enforcement of primary seat belt laws and support for high- visibility law enforcement, graduated driver’s license requirements for novice drivers, and pedestrian safety zones for areas at high risk of crashes involving those walking. Traffic enforcement specifically focused on dangerous driving behavior, including impaired driving, speeding, distracted driving, and failure to wear seat belts, remains critical to saving lives, preventing injuries, and reducing traffic crashes, and should be accompanied by educational tools and outreach efforts. Persistent behavioral risks can also be addressed over time through other interventions such as transformative street design and motor vehicle technologies like alcohol detection systems. Beyond effectively leveraging our safety tools, a robust and comprehensive approach to influencing human behavior requires deepening our understanding of underlying causes. To reflect the Safe System Approach principles, U.S. DOT will shift its safety messaging to recognize that humans are fallible, will make mistakes and at times exercise poor judgment, and that such decisions should not lead to death and serious injury. Activities such as building safety culture within organizations and leveraging public health approaches can assist with the practical implementation of a Safe System Approach. 19 Key Departmental Actions to Enable Safer People 1. Leverage new funding in the Bipartisan Infrastructure Law for behavioral research and interventions, and use education, technical assistance, and outreach to disseminate information to partners. Leverage public health approaches for implementation by engaging with a wide variety of stakeholders using a diversity of interventions. For alcohol and drug impaired driving research and interventions, focus on developing means to accurately measure impairment, reducing drug and alcohol impaired driving recidivism, as well as promoting assessment and treatment of drug and alcohol substance use disorders by working with the behavioral and public health communities. Support research and development of technology to detect and prevent alcohol and drug impaired driving. 2. Update Departmental safety messaging so that it is unified across the entire Department and reflects the Safe System Approach principle of human fragility. 3. Implement the October 2021 final rule requiring State Driver Licensing Agencies to access and use information obtained through the Drug and Alcohol Clearinghouse and take licensing actions against 18https://clearinghouse.fmcsa.dot.gov/ 19Safety culture is defined for the purposes of this document as the shared values, actions, and behaviors that demonstrate a commitment to safety over competing goals and demands. National Roadway Safety Strategy 16
commercial drivers who have drugs or alcohol violations in the system and are not cleared to return
     to duty.
4.   Implement the July 2021 final rule requiring State Driver Licensing Agencies to develop systems for
     the electronic exchange of driver history record information. Work with State Driver Licensing
     Agencies to improve accuracy of CDL driver records and to evaluate additional opportunities to use
     these more accurate records to take unsafe drivers off the road more expeditiously.
5.   Work with State Driver Licensing Agencies to improve the accuracy of non-CDL driver records, and to
     evaluate additional opportunities to use these more accurate records to take unsafe drivers off the
     road more expeditiously. Further encourage State Driver Licensing Agencies to identify and educate
     repeat offenders of impaired driving and other behavioral safety issues.
6.   Support the development and accessibility of training designed to enhance equity in law
     enforcement.
7.   Encourage States to apply for the Section 1906 grant program that funds the collection of
     information on the race and ethnicity of the driver in motor vehicle stops.
8.   Increase commercial motor vehicle highly visible traffic enforcement against risky driver behavior
     focused on high crash locations.

 National Roadway Safety Strategy                                                                     17
Safer Roads Roadway design strongly influences how people use roads. The environment around the roadway system – including land use and where highways, roads, and streets intersect with other transportation modes such as rail and transit – also shapes the safety risks borne by the traveling public. The United States has more than four million miles of public roads, which vary widely by ownership, type, and function. The Nation’s highways, roads, and streets have been built at different times, with different design standards, and are in widely varying states of repair. Many public roads also support a growing diversity of uses and mix of users – including people who take public transportation, walk, bike, and roll – and function as places unto themselves, contributing to community and prosperity. The Safe System Approach emphasizes that redundancy is critical, and safer roadways mean incorporating design elements that offer layers of protection to prevent crashes from occurring and mitigate harm when they do occur. Through the NRSS, the Department will focus on advancing infrastructure design and interventions that will significantly enhance roadway safety. This includes advancing support for the implementation of Complete Streets policies to help transportation agencies across the United States plan, develop, and operate roads, streets, and networks. Complete Streets policies prioritize safety, comfort, and connectivity to destinations for all users, including pedestrians, bicyclists, those who use wheelchairs and mobility devices, transit riders, micro-mobility users, shared ride services, motorists, and freight delivery services. A one-size-fits-all approach to roadway design will not work; instead, context-sensitive designs must be the norm. Unfortunately, many of our Nation’s roads do not adequately incorporate infrastructure design elements that are conducive to the safe travel of all road users. People who take public transportation, walk, bike, roll, or use a motorcycle require special attention since they lack the protections gained from being inside a motor vehicle. Recent research found that 90 percent of the top pedestrian fatality hotspots are on roadways with three or more lanes, and 70 percent have five or more lanes of traffic that pedestrians had to cross. 20 Visibility continues to be an issue for people walking and biking; 75 percent of all fatal pedestrian crashes occur in darkness. 21 More broadly, safety risk differs depending on the type of road and how it is used, with arterial roads comprising over half of all traffic deaths in 2020 despite constituting approximately ten percent of the Nation’s public road mileage. 22 Context-sensitive design permits the flexibility to address variations in the purpose and anticipated use of roads, as well as take into consideration the surrounding land use and potential impacts related to the natural environment. As roadways are built, maintained, and upgraded with the latest safety features, it is also essential that roadway construction and maintenance zones are safe for workers. 20 Schneider, R. J., Sanders, R., Proulx, F., & Moayyed, H. (2021). United States fatal pedestrian crash hot spot locations and characteristics. Journal of Transport and Land Use, 14(1), 1–23. https://doi.org/10.5198/jtlu.2021.1825 21 https://crashstats.nhtsa.dot.gov/Api/Public/ViewPublication/813079 22 https://www.fhwa.dot.gov/policyinformation/statistics/2019/hm220.cfm National Roadway Safety Strategy 18
Risk levels vary widely across different types of roads.

Source: Early Estimates of Motor Vehicle Traffic Fatalities and Fatality Rate by Sub-Categories in 2020, DOT HS 813 118, June 2021

Roadway design guidance and regulations will be updated to reflect best practices for designing safer
roadways such as incorporating proven safety countermeasures, and the Department will work with
States and other owners of highways, roads, and streets to achieve safer roadway design. When
roadways intersect with railroads, those locations should have sufficient infrastructure in place to limit
the possibility of a collision between a train and a motor vehicle or a person walking. The NRSS is also a
strategy designed to reverse the disproportionate impact of crashes on people of color, and on people
outside of the vehicle. Compared with urban areas, highways, roads, and streets that serve rural
communities and small towns face outsized safety impacts relative to their population and number of
miles traveled, and have unique design considerations such as how to minimize collisions with large
wildlife.

 National Roadway Safety Strategy                                                                                                    19
Fatalities and fatal crashes occur disproportionately – by both population and
                          vehicle travel – on rural roads.

Source: Fatality Analysis Reporting System, U.S. Census

Advancements in making roadways safer are important for success in the other NRSS objectives. Safer
highways, roads, and streets can encourage safer behaviors among drivers and other road users, for
example. Well-designed roadways can also complement vehicle technology in improving safety
performance with respect to people both inside and outside of vehicles.

Key Departmental Actions to Enable Safer Roads
1. Complete the current rulemaking process for Manual Uniform Traffic Control Devices (the Manual) by
   finalizing the proposed amendments and incorporating changes based on the public comments and
   Administration priorities. Identify proposed future changes not possible via the current rulemaking
   effort and further update the Manual to promote the safety, inclusion, and mobility of all users and
   provide for the protection of vulnerable road users. Initiate four-year cycles to update this national
   standard for keeping current with the latest research, practices, and technologies. Ensure a wide
   range of practitioner and stakeholder engagement in the development of future editions, with
   representation that is consistent with the impact of crashes on people outside the vehicle such as
   people walking, people in rural communities, and people of color. Provide education and technical
   assistance to the users of the Manual, emphasizing the purpose of the Manual, roles of engineering,
   and how device innovation occurs.
2. Support the planning, design and implementation of safer roads and streets in all communities using
   all available and applicable Federal funding resources, including existing formula funding programs
   to include but not limited to the Highway Safety Improvement Program. Also leverage the $6 billion
   Safe Streets and Roads for All grant initiative, which is included in the Bipartisan Infrastructure
   Law. Support states and Metropolitan Planning Organizations (MPOs) in the new requirement to use
   planning funds to develop Complete Streets policies and prioritization plans.
3. Launch a comprehensive Complete Streets Initiative and provide technical assistance to
   communities of all sizes to implement policies that prioritize the safety of all users in
   transportation network planning, design, construction, and operations, including in small towns and
   rural areas. Incorporate Complete Streets criteria in Federal grant opportunities and in the Emergency

 National Roadway Safety Strategy                                                                    20
Relief Manual. Incorporate lighting into Complete Streets implementation so that lighting becomes a key design factor in roadway upgrades. Involve transit providers in Complete Streets implementation activities to support safe walking, biking, and rolling to stops and stations. 4. Improve State performance on achieving safety performance targets using a focused approach to safety and other technical assistance. 23 Consider revisions to guidance and regulations to improve State strategic highway safety plans and ensure that State safety performance targets demonstrate constant or improved performance for each safety performance measure. 5. Elevate the Transportation Performance Management Dashboard 24 to stakeholders such as State Executives, Congress, the media, and the public to spur and reward roadway safety gains and share information on State safety performance targets and progress toward achieving those targets. Promote and continue to add noteworthy safety practices in the Noteworthy Practices Database 25 to assist State and local agencies in identifying optimal projects aimed at reducing fatalities and serious injuries. 23 https://safety.fhwa.dot.gov/fas/ 24 https://www.fhwa.dot.gov/tpm/reporting/state/ 25 https://rspcb.safety.fhwa.dot.gov/noteworthy/default.aspx National Roadway Safety Strategy 21
Safer Vehicles
In 2019, the Nation had over 275 million registered motor vehicles, which carried people and goods over
three trillion miles. 26 The role of vehicle safety performance in avoiding or mitigating the harm of crashes
cannot be overstated. Seat belts and air bags, for example, prevented an estimated 425,000 fatalities in
traffic crashes since they were first required through the Federal Motor Vehicle Safety Standards
(FMVSS). 27 Through the NRSS, the Department will seek opportunities to build on these successes, not
only making vehicles safer for their occupants, but for other road users too.

While air bags and seat belts work together to protect the people inside a motor vehicle when a crash
occurs, the next generation of motor vehicles will increasingly have the technology necessary to prevent
certain crashes from occurring in the first place, and to mitigate harm to those outside of the vehicle
when a crash happens. Several Advanced Driver Assistance Systems (ADAS) technologies are known to
help prevent or mitigate the impact of crashes. 28 Examples include: Automatic Emergency Braking, which
can apply a vehicle’s brakes automatically in time to avoid or mitigate an impending forward crash with
another vehicle; and Lane Departure Warning, which monitors lane markings and alerts the driver when it
detects that the vehicle is drifting out of its lane. Expanding the availability of such vehicle technologies
and improving existing technologies may be especially important given that new vehicle purchases
continue to trend towards larger vehicles – particularly sport utility vehicles and crossovers – which
recent studies have found to cause more serious injuries than passenger cars when involved in collisions
with pedestrians. 29 The Department seeks to continue to leverage enhanced motor vehicle safety
performance and technologies to improve safety, including commercial motor vehicle equipment such as
rear underride guards and technologies that address behavioral issues such as alcohol detection systems
and distracted driving detection systems. Incentivizing the inclusion of technologies in new motor vehicles
can help to reduce the frequency of crashes, and to reduce the severity of the outcomes when they do
occur. The Department also continues to identify opportunities to make transit buses safer for
passengers, operators, and anyone walking, biking, or rolling near them.

In addition to setting performance standards and encouraging the adoption of new technologies, it is also
important to provide responsible oversight over safety issues. When motor vehicle design or technologies
pose unreasonable safety risks to the public, the Department will take action to investigate issues, initiate
recalls, and remedy vehicle defects.

26 https://www.bts.gov/content/number-us-aircraft-vehicles-vessels-and-other-conveyances;

https://www.fhwa.dot.gov/policyinformation/travel_monitoring/20augtvt/figure2.cfm
27 https://crashstats.nhtsa.dot.gov/Api/Public/ViewPublication/812691. Figure is based on estimated lives saved through

2017.
28 https://www.nhtsa.gov/ratings#25196
29 https://www.iihs.org/news/detail/new-study-suggests-todays-suvs-are-more-lethal-to-pedestrians-than-cars

 National Roadway Safety Strategy                                                                                   22
From 1960 through 2012, over 600,000 lives have been saved by vehicle safety
       technologies, including seat belts, air bags, child safety seats, electronic
                             stability control, and others.
              FMVSS Number and Topic                                                    Lives Saved, 1960-2012
              208/209/2010 Seat belts                                                       329,715
              203/204 Energy-absorbing steering assemblies                                   79,989
              208 Frontal air bags                                                           42,856
              206 Door locks, latches, and hinges                                            42,135
              201 Occupant protection in interior impact                                     34,477
              214 Side impact protection (incl. side air bags)                               32,288
              105/135 Dual master cylinders/front disc brakes                                18,350
              213 Child safety seats                                                           9,891
              212 Adhesive windshield bonding                                                  9,853
              126 Electronic Stability Control                                                 6,169
              216 Roof crush resistance                                                        4,913
              108 Trailer conspicuity tape                                                     2,660
              226 Rollover curtains                                                              178
              301 Fuel system integrity                                                           26

Source: Kahane, C. J. (2015, January). Lives saved by vehicle safety technologies and associated Federal Motor Vehicle Safety Standards,
1960 to 2012 – Passenger cars and LTVs – With reviews of 26 FMVSS and the effectiveness of their associated safety technologies in
reducing fatalities, injuries, and crashes. (Report No. DOT HS 812 069). Washington, DC: National Highway Traffic Safety Administration.

U.S. DOT is also cognizant of the need to plan for the safety landscape in the future. This includes a
responsibility to use holistic approaches to assess the safety of emerging technologies such as
Automated Driving Systems (ADS). A small number of vehicles equipped with ADS are in development and
undergoing testing today. The Department is tracking their performance daily, and is actively researching
test methods, procedures, and criteria to assess long-term safety benefits, as well as broader impacts on
workers, drivers, and all people who use the roadways.

Enabling safer vehicles also means employing strategies to improve the safety of the commercial motor
vehicles that transport goods and carry thousands of passengers locally and across the country every day.
5,005 fatalities are estimated to have involved a large truck in 2019 and more than 80 percent of these
fatalities involved the occupants of other vehicles or other road users such as pedestrians, bicyclists, and
motorcyclists. 30 To ensure the safe operations of commercial trucks and motor carriers, the Department
continues to identify high risk companies and operators of commercial motor vehicles using a data-driven
and performance-based approach, including roadside commercial vehicle safety inspections.

30   https://crashstats.nhtsa.dot.gov/Api/Public/ViewPublication/813110

 National Roadway Safety Strategy                                                                                                    23
Fatalities involving large trucks have been increasing faster than fatalities overall, though they declined slightly for 2020, even as total fatalities increased. *Trucks over 10,000 Gross Vehicle Weight Rating, including single unit trucks and truck tractors Sources: Fatality Analysis Reporting System; Early Estimates of Motor Vehicle Traffic Fatalities and Fatality Rate by Sub-Categories in 2020, DOT HS 813 118, June 2021 Key Departmental Actions to Enable Safer Vehicles 1. Develop proposals to update consumer information on vehicle safety performance through the New Car Assessment Program (NCAP or Program). The updated Program is expected to emphasize safety features that protect people both inside and outside of the vehicle, and may include consideration of pedestrian protection systems, better understanding of impacts to pedestrians (e.g., specific considerations for children), and automatic emergency braking and lane keeping assistance to benefit bicyclists and pedestrians. The Program can also identify areas of most promising vehicle technology that may lead to subsequent analysis and possible FMVSS rulemakings, such as alcohol detection systems, and systems to detect distracted driving. 2. Provide an NCAP ‘road map’ that will show how a set of vehicle improvements may be advanced over the next ten years, covering the stages of data evaluation, research, and analysis of the criteria for inclusion in NCAP. 3. Initiate a rulemaking to update the Monroney consumer label to include crash avoidance information next to crashworthiness information. NHTSA may also consider including information on features that mitigate risks for people outside of the vehicle. 4. Initiate a new rulemaking to require Automatic Emergency Braking and Pedestrian Automatic Emergency Braking technologies on new passenger vehicles. Initiate a rulemaking to require Automatic Emergency Braking technologies on heavy trucks. 5. Consider a rulemaking effort to establish motor vehicle safety standards to require passenger motor vehicles manufactured to be equipped with advanced impaired driving prevention technology. 6. Issue a final rule to upgrade existing requirements for rear impact guards on newly manufactured trailers and semi-trailers. National Roadway Safety Strategy 24
7. Require manufacturers to provide notification when there is a crash involving Automated Driving
   Systems, and create a public database of information that can inform safer passenger vehicles.
8. Ensure timely investigation into emerging vehicle safety issues arising from the deployment of new
   technologies.

 National Roadway Safety Strategy                                                                       25
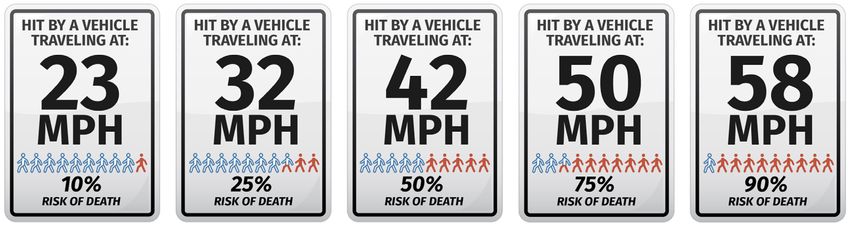
Safer Speeds
The Department believes it is important to prioritize safety and moving individuals at safe speeds over
focusing exclusively on the throughput of motor vehicles. Both exceeding the posted speed limit and
driving too fast for conditions are speeding-related crash factors. By this definition, speeding has played a
role in more than a quarter of traffic deaths – killing nearly 100,000 people – over the past decade. 31
Speeding increases both the frequency and severity of crashes, yet it is both persistent and largely
accepted as the norm amongst the traveling public. 32 In 2019, 78 percent of the vehicles involved in fatal
pedestrian crashes were on a roadway with a speed limit greater than 30 miles per hour (mph). 33 Unsafe
speeds are now a well-documented and understood factor in death and injury, especially among people
outside of a vehicle.

In alignment with the Safe System Approach, achieving safe speeds requires a multi-faceted approach
that leverages road design and other infrastructure interventions, speed limit setting, education, and
enforcement. Roadway design and other infrastructure factors play a significant role in managing speeds
and can deter excessive speeding behaviors from occurring in the first place. Design can help to make
roads and streets “self-enforcing,” offering drivers contextual encouragement – via lane width,
intersection design, pedestrian and bicyclist infrastructure, and other features – to drive at safer speeds.
Speed limits frame expectations for drivers and other roadway users, and should be set to provide a safe,
consistent, and reasonable speed to protect drivers, other people in motor vehicles, and people walking,
biking, and rolling along the roadway. Setting safer speed limits is a critical tool for reducing crashes and
injury, and methods for setting speed limits should be customized to the context of the roadway. For
situations where temporary conditions may necessitate slower speeds, interventions such as signage that
permits variable speed limits and education on driving cautiously in inclement weather can be used to
ensure safe driving speeds. Speeding can also be addressed and discouraged through education and
enforcement. Automated speed enforcement, if deployed equitably and applied appropriately to roads
with the greatest risk of harm due to speeding, can provide significant safety benefits and save lives.

31 Source: NHTSA FARS files 2010-2018, FARS 1st release 2019.
32 https://www.who.int/violence_injury_prevention/publications/road_traffic/world_report/speed_en.pdf
33 Source: NHTSA FARS 1st release 2019

 National Roadway Safety Strategy                                                                        26
You can also read