Nevada Irrigation District 2020 Urban Water Management Plan Public Draft - June 2021
←
→
Page content transcription
If your browser does not render page correctly, please read the page content below
Nevada Irrigation District

2020 Urban Water Management Plan

Public Draft

June - 2021
Nevada Irrigation District
                                                            2020 UWMP – Public Draft

                       Nevada Irrigation District

                  2020 Urban Water Management Plan

                             Public Draft

                             June - 2021

insert PE stamp
for final

                                      101 Parkshore Drive – Folsom, California
Nevada Irrigation District
2020 UWMP – Public Draft
Table of Contents
1 URBAN WATER MANAGEMENT PLAN INTRODUCTION AND OVERVIEW ..................................................... 1
1.1 PLAN SUMMARY .................................................................................................................................................. 1
1.2 BASIS FOR PREPARING PLAN ................................................................................................................................... 2
1.3 COORDINATION AND OUTREACH ............................................................................................................................. 3
1.4 PLAN SUBMITTAL AND AVAILABILITY ........................................................................................................................ 3
2 WATER SERVICE AND SYSTEM DESCRIPTION .............................................................................................. 5
2.1 GENERAL DESCRIPTION.......................................................................................................................................... 5
2.2 SERVICE AREA CLIMATE ......................................................................................................................................... 5
2.3 CURRENT AND PROJECTED LAND USE ....................................................................................................................... 7
2.3.1 Planned Projects .................................................................................................................................... 8
2.4 SOCIAL, ECONOMIC, AND DEMOGRAPHIC FACTORS................................................................................................... 10
2.5 CURRENT AND PROJECTED CONNECTIONS ............................................................................................................... 11
2.5.1 Retail Customers .................................................................................................................................. 11
2.5.2 City of Lincoln ....................................................................................................................................... 14
2.5.3 Wholesale Customers .......................................................................................................................... 15
2.5.4 Summary of Current and Projected Connections ................................................................................. 15
2.6 CURRENT AND PROJECTED CUSTOMER POPULATION ................................................................................................. 16
3 WATER USE CHARACTERIZATION AND PROJECTED DEMANDS .................................................................. 19
3.1 HISTORICAL DEMANDS ........................................................................................................................................ 19
3.1.1 Treated Water Retail Customers.......................................................................................................... 19
3.1.2 Treated Water Wholesale Customers .................................................................................................. 20
3.1.3 Raw Water Wholesale Customers ....................................................................................................... 21
3.1.4 Raw Water Retail Customers ............................................................................................................... 22
3.2 WATER LOSS ..................................................................................................................................................... 25
3.3 ENVIRONMENTAL INSTREAM FLOW REQUIREMENTS .................................................................................................. 25
3.4 WATER DEMAND PROJECTION SUMMARY ............................................................................................................... 26
3.5 RELIABILITY ANALYSIS WATER DEMAND PROJECTION ................................................................................................ 28
3.6 LOW INCOME DEMAND PROJECTION ...................................................................................................................... 29
3.7 SBX7 COMPLIANCE ............................................................................................................................................ 29
4 WATER SUPPLY CHARACTERIZATION ........................................................................................................ 31
4.1 SURFACE WATER SUPPLY ..................................................................................................................................... 31
4.1.1 Water Rights ........................................................................................................................................ 31
4.1.2 Purchased or Imported Water ............................................................................................................. 33
4.2 GROUNDWATER ................................................................................................................................................. 33
4.3 STORMWATER ................................................................................................................................................... 33
4.4 WASTEWATER AND RECYCLED WATER.................................................................................................................... 33
4.4.1 Wastewater Collection, Treatment, and Disposal ............................................................................... 33
4.4.2 Recycled Water System Description ..................................................................................................... 37
4.4.3 Potential, Current, and Projected Recycled Water Uses ...................................................................... 37
4.4.4 Actions to Encourage and Optimize Future Recycled Water Uses ....................................................... 38
4.5 DESALINATED WATER OPPORTUNITIES ................................................................................................................... 38
4.6 WATER EXCHANGE AND TRANSFERS....................................................................................................................... 38
4.7 FUTURE WATER PROJECTS ................................................................................................................................... 38
4.8 SUMMARY OF EXISTING AND PLANNED SOURCES OF WATER....................................................................................... 39
4.9 SPECIAL CONDITIONS .......................................................................................................................................... 40
4.9.1 Climate Change Effects ........................................................................................................................ 40
iNevada Irrigation District
2020 UWMP – Public Draft
4.9.2 Climate Change Impacts ...................................................................................................................... 42
4.9.3 Regulatory Conditions and Project Development ................................................................................ 43
4.10 ENERGY INTENSITY ......................................................................................................................................... 44
5 WATER SUPPLY RELIABILITY AND DROUGHT RISK ASSESSMENT ................................................................ 45
5.1 WATER SUPPLY RELIABILITY ASSESSMENT ............................................................................................................... 45
5.1.1 Constraints on Water Sources.............................................................................................................. 45
5.1.2 Reliability by Type of Year .................................................................................................................... 47
5.2 DROUGHT RISK ASSESSMENT ................................................................................................................................ 51
6 DROUGHT PLAN ....................................................................................................................................... 52
6.1 LEGAL AUTHORITIES ............................................................................................................................................ 52
6.2 RESILIENCE PLANNING ......................................................................................................................................... 53
6.3 WATER SUPPLY RELIABILITY ANALYSIS .................................................................................................................... 53
6.4 ANNUAL WATER SUPPLY AND DEMAND ASSESSMENT ............................................................................................... 54
6.5 WATER SHORTAGE STAGES AND RESPONSES............................................................................................................ 55
6.5.1 Normal Water Supply........................................................................................................................... 56
6.6 ENFORCEMENT AND VARIANCES ............................................................................................................................ 63
6.7 COMMUNICATION PROTOCOLS ............................................................................................................................. 64
6.8 FINANCIAL CONSEQUENCES OF DROUGHT PLAN ....................................................................................................... 64
6.9 MONITORING, REPORTING, AND REFINEMENT ......................................................................................................... 65
6.10 RESPONSE ACTION ESTIMATES ......................................................................................................................... 65
6.11 PLAN ADOPTION, SUBMITTAL, AND AVAILABILITY ................................................................................................ 68
6.12 SEISMIC RISK ASSESSMENT AND MITIGATION ...................................................................................................... 68
7 DEMAND MANAGEMENT MEASURES ....................................................................................................... 69
7.1 WATER WASTE PREVENTION ORDINANCES ............................................................................................................. 69
7.2 METERING ........................................................................................................................................................ 69
7.3 CONSERVATION PRICING ...................................................................................................................................... 70
7.4 PUBLIC EDUCATION AND OUTREACH ...................................................................................................................... 70
7.5 PROGRAMS TO ASSESS AND MANAGE DISTRIBUTION SYSTEM REAL LOSS ...................................................................... 72
7.6 WATER CONSERVATION PROGRAM COORDINATION AND STAFFING SUPPORT ................................................................ 72
7.7 OTHER DEMAND MANAGEMENT MEASURES ........................................................................................................... 73
Appendix A: DWR Compliance Checklist
Appendix B: Notification and Public Hearing Outreach
Appendix C: 2020 UWMP and WSCP Adoption Resolutions
Appendix D: NID Conservation Information
Appendix E: References
iiNevada Irrigation District
2020 UWMP – Public Draft
List of Acronyms and Abbreviations
Act Urban Water Management Act N/A Not Applicable
AF Acre-feet NCRDC Nevada County Resource
Conservation District
AFY Acre-feet per year
NID Nevada Irrigation District
AMI Automatic Metering
Infrastructure PCWA Placer County Water Agency
AMR Automatic Meter Reading PG&E Pacific Gas and Electric
AWWA American Water Works SMD Sewer Maintenance District
Association
SSWD South Sutter Water District
CABY Cosumnes, American, Bear,
SVI Sacramento Valley Index
Yuba Integrated Regional Water
Management Group SWRCB California State Water Resource
Control Board
CALGreen California Green Building
Standards Code USGS United States Geological Survey
CII Commercial, Industrial, and UWMP Urban Water Management Plan
Institutional
WMW Wetter, moderate warming
CIMIS California Irrigation Management scenario
Information System
WRCC Western Regional Climate Center
CRC California Railroad Commission
WTP Water Treatment Plant
CWC California Water Code
WWTP Wastewater Treatment Plant
DEW Drier, extreme warming scenario
District Nevada Irrigation District
DMM Demand Management Measure
DOF California Department of Finance
DRA Drought Risk Assessment
DWR California Department of Water
Resources
FERC Federal Energy Regulatory
Commission
ft Feet/Foot
GCM Global Climate Model
GPCD Gallons per capita per day
Guidebook Urban Water Management Plan
Guidebook 2020
HET High Efficiency Toilets
kWh Kilowatt Hour
mgd Million gallons per day
MWELO Model Water Efficient Landscape
Ordinance
iiiNevada Irrigation District
2020 UWMP – Public Draft
1 Urban Water Management Plan Introduction and Overview
This Urban Water Management Plan (UWMP) was prepared for the Nevada Irrigation District
(NID or District) in cooperation with the District staff. The District was organized in 1921 under
the California Irrigation District Act of 1897 as a nonprofit water agency and operates under
Division 11 of the State Water Code.
The Urban Water Management Act (Act) became part of the California Water Code (CWC) with the
passage of Assembly Bill 797 during the 1983-1984 regular session of the California Legislature. The
CWC requires every urban water supplier providing water for municipal purposes either directly or
indirectly to more than 3,000 customers or supplying more than 3,000 acre-feet of water annually
(AFY) to adopt and submit an Urban Water Management Plan every five years to the California
Department of Water Resources (DWR). The specific planning requirements are in the CWC
Division 6, Part 2.6 Urban Water Management Planning.
Subsequent legislation has been passed that updates and provides for additional requirements for the
UWMPs and water management. In particular, SBX7- 7 Water Conservation, required the State to
achieve a 20 percent reduction in urban per capita water use by December 31, 2020, known as
20x2020. Reporting of 20x2020 compliance is incorporated into the 2020 UWMP requirements.
Other inclusions in the UWMP originating from legislative requirements include reporting on energy
intensity, an expanded Water Shortage Contingency Plan, and a 5-Year Drought Risk Assessment.
The core requirements for the UWMP include:
• An overview description of reliability of supplies, projected supplies, and the strategy for
meeting water needs.
• A description of the water service area.
• A description of the existing and planned supply sources.
• Estimates of past, present, and projected water use.
• 20x2020 analysis and target compliance.
• A description of water conservation Demand Management Measures (DMMs) already in
place and planned, and other conservation measures.
• Inclusion of a 5-Year Drought Risk Assessment.
• A description of the Water Shortage Contingency Plan/Conservation Program.
The 2020 UWMP must submit data in specific tables to DWR. DWR has provided these tables and
this UWMP utilizes the provided tables with minor changes to format or organization where
applicable. NID’s 2020 UWMP presents each required element per DWR’s Urban Water
Management Plan Guidebook 2020 (Guidebook). A copy of the DWR checklist for compliance is
included in Appendix A.
1.1 Plan Summary
The District supplies treated and raw water to municipal and raw water customers. The majority of
water use is by the raw water customers. Raw water customers include commercial agriculture,
small-scale agriculture, and other irrigation uses that contribute to the community’s rural character.
2020 UWMP 1Nevada Irrigation District
2020 UWMP – Public Draft
The water supply system relies on diverting snow-melt runoff and capturing runoff flows in District
reservoirs for use during the irrigation summer when runoff is reduced. The District’s water rights
including diversion and storage total approximately 450,000 acre-feet, though the amount that is
actually available for use is less due to temporal differences between water rights, runoff season, and
irrigation season needs.
This plan utilizes recent customer connection statistics and California Department of Finance
population projections to develop customer and demand projections. A pending new Federal
Energy Regulatory Commission (FERC) license will also add significant environmental instream
flow requirements that depending on the year type, could increase unrecoverable flow requirements
from the existing 7,665 acre-feet up to 59,527 acre-feet. Total 2020 demands were 161,678 acre-
feet. Overall water demands are projected to increase up to 50 percent through 2040 to a range of
approximately 199,000-242,000 acre-feet per year. Without the new FERC requirements, projected
demands only increase 18 percent, up to approximately 190,000 acre-feet.
The District’s water supplies are sufficient to meet customer and other demands during normal
hydrologic years. However, the District projects supply to demand shortages during single and 5-
year drought periods due to projected reduced watershed runoff. To address these shortages, the
District’s Drought Plan identifies six drought stages that include actions for the District and
customers to implement to either reduce demand and/or increase supplies. Drought year impacts
can be significantly mitigated through purchase of supply from PGE. However, the PGE supply is
a highly variable, making it unreliable during dry years. In addition, the District’s supply strategy
relies heavily on carry over storage in its reservoirs. Depending on management of the storage over
year to year, supply shortages may vary from values reported in this Plan.
As a mostly rural area primarily dependent on its snowmelt-based supply, the District faces unique
challenges in projecting its future supplies and demands. The character of the area and water
management practices of the past may be different in the future. As such, the District is in the early
stages of a long-term visioning and planning effort to better understand potential future conditions
and needs, and identify management and operational practices to meet those needs. The process,
Plan For Water, will identify optional water management practices when triggering points in supply,
demand, regulatory, legal, and other events are reached. These practices may include supply
projects, demand management efforts, policy changes, and others.
1.2 Basis for Preparing Plan
The District supplies treated water within portions of the District’s service area. Based on the
number of connections and total volume delivered, NID is considered an urban retail water supplier
and is required to update the UWMP. Based on the small volume of wholesale water supplied to
other water providers, the District is not considered an “urban wholesale water supplier” as defined
by CWC §10608.12(t). Table 1-1 presents the public water system name and number for each of the
District’s public water systems.
2020 UWMP 2Nevada Irrigation District
2020 UWMP – Public Draft
Table 1-1. Public Water System Information
Public Water System Public Water System Number of Municipal Volume of Water
Number Name Connections Supplied 2020 (AF)
Nevada ID - E. George,
CA2910004 6,288 2,757
Banner Mountain
CA2910006 Nevada ID - Loma Rica 5,015 1,939
CA2910014 Nevada ID - Lake of Pines 2,555 1,113
Nevada ID - Lake
CA2910023 3,248 1,058
Wildwood
CA311026 Nevada ID - North Auburn 2,499 1,780
CA5810005 Nevada ID - Smartsville 43 10
Total: 17,093 8,657
1.3 Coordination and Outreach
The District coordinated this UWMP with other agencies and the community. Notice to the cities
of Grass Valley, Lincoln, and Nevada City, as well as Nevada, Placer, and Yuba counties were
provided on December 11, 2020, regarding the District’s intentions of updating the UWMP,
fulfilling the requirement to provide notice at least 60 days prior to the public hearing. A summary
of the outreach efforts is provided in. Table 2-2.
The District conducted insert number public workshops at Board of Directors meetings to review and
discuss the Plan. A public hearing for the plan was held on insert date. Public notification regarding
these workshops and the hearing were advertised on the District’s website and news releases. For
the public hearing, the District notified the cities of Grass Valley, Lincoln, and Nevada City, as well
as Nevada, Placer, and Yuba counties, as well as official notification in a news publication. Outreach
and notification materials are presented in Appendix B.
Add results from public workshop…
The public hearing and adoption were conducted on [DATE]. The NID Board of Directors
Resolution XXX adopting this 2020 UWMP is included in Appendix C.
1.4 Plan Submittal and Availability
Pursuant to DWR requirements, this 2020 UWMP was submitted to the California State Library,
cities of Grass Valley, Lincoln, and Nevada City, and the counties of Nevada, Placer, and Yuba on
[DATE].
This 2020 UWMP and applicable submittal tables were electronically submitted to DWR on
[DATE].
This 2020 UWMP is available to the public electronically on the District’s website. Due to COVID
19, a hard copy at the District is not available for review.
2020 UWMP 3Nevada Irrigation District
2020 UWMP – Public Draft
Table 1-2. Summary of Coordination, Adoption, and Submittal Activities (not final until Board approved and submitted to
State)
Commented
Notified of on the Copy of
Requested Notified of Attended
Potentially interested parties UWMP draft/action UWMP sent
copy of draft public hearing public hearing
preparation taken by (date sent)
supplier
Nevada County X
Placer County X
Yuba County X
City of Grass Valley X
City of Nevada City X
City of Lincoln X
Yuba Water Agency X
Placer County Water Agency X
Placer County Agricultural Commissioner X
Placer County Farm Bureau X
Nevada County Agricultural Commissioner X
Nevada County Farm Bureau X
General public X
District Website 12/11/2020 -- -- -- -- --
2020 UWMP 4Nevada Irrigation District
2020 UWMP – Public Draft
2 Water Service and System Description
This section contains a description of the service area and climate, historical and projected
connections and population, as well as land uses within the service area.
2.1 General Description
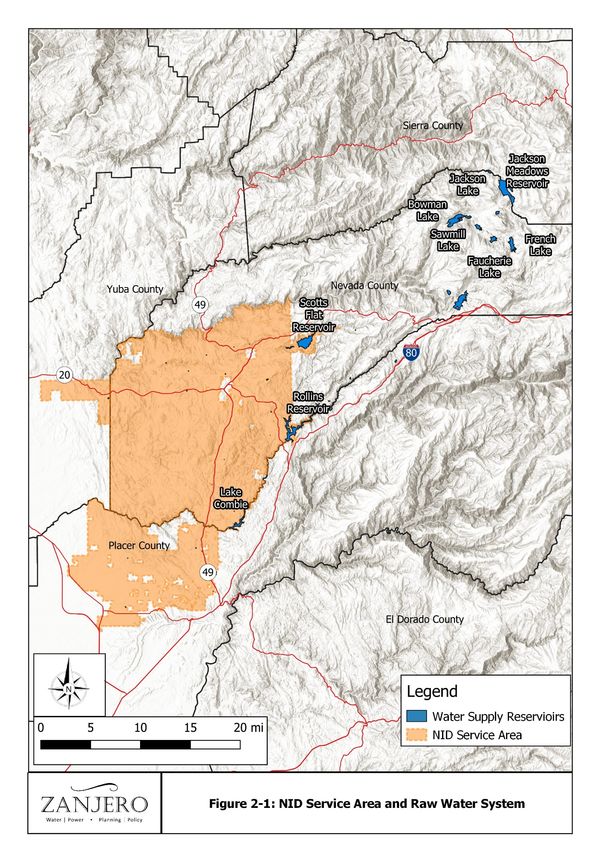
Located on the western slope of the Sierra Nevada Mountain range, the District encompasses
287,000 acres and covers portions of three counties: Nevada, Placer, and Yuba as shown on Figure
2-1, below. The District’s watershed is located on the upper reaches of the Yuba River, Bear River,
and Deer Creek. The highest peak in the District is at 8,373-foot elevation at English Mountain.
The District transports water from high elevation, mountain reservoirs to the lower elevation
foothills and into portions of the northern Sacramento Valley near the City of Lincoln.
NID was established as an irrigation district in 1921 and is governed by a five-member Board, which
is elected by District voters. Each Board member, representing a division with the District, serves a
four-year term.
The District supplies treated water for municipal, domestic, and industrial purposes. Water
management infrastructure includes storage, treatment, and conveyance facilities. Many areas and
residents within the service area are not served NID water, receiving their water through private
groundwater wells or other sources. NID does provide wholesale supply to Nevada City, Grass
Valley, and Placer County Water Agency which maintain their own water treatment and distribution
systems. The District also serves approximately 5,200 raw water customers with a total reported
irrigated acreage of 32,323 acres in 2020.
The District’s retail potable water system consists of six service areas. The retail water system
connections are predominantly single-family, but also consist of multi-family, commercial, industrial,
and institutional customers.
The District owns and operates hydroelectric generation and recreational facilities. The
hydroelectric facilities have a capacity of 82.2 megawatts and produced an annual average of 319
MWh between 2016 and 2020. NID began producing power in 1966 with the completion of the
Yuba-Bear Power Project, which includes Chicago Park, Dutch Flat, Bowman, and Rollins
powerhouses. Recreational facilities owned by the District provide camping, fishing, and boating at
Rollins Lake, Scotts Flat Reservoir, and Jackson Meadows – Bowman Lake areas.
2.2 Service Area Climate
Summers are generally dry with mild to hot temperatures. Winters are relatively wet, especially in
the upper elevations around Nevada City and Grass Valley, with snow levels usually around 3,500 ft
and occasionally as low as 1,000 ft. Based on the historical data obtained from the California
Irrigation Management Information System (CIMIS) and the Western Regional Climate Center
(WRCC), the District’s service area average minimum and monthly maximum temperatures are 26.4
and 92.5 degrees Fahrenheit, respectively.
2020 UWMP 5Nevada Irrigation District
2020 UWMP – Public Draft
2020 UWMP 6Nevada Irrigation District
2020 UWMP – Public Draft
2.3 Current and Projected Land Use
The NID service area includes mainly areas of Nevada County and Placer County, with a small
portion in Yuba County. The service area is a unique blend of treated and raw water customers that
includes urban, suburban, rural, and agricultural settings.
The Placer County General Plan indicates land uses for the portion of the service area within Placer
County primarily consists of Agriculture/Timberland, except for the North Auburn Highway 49
corridor which mainly includes various densities of Residential 1 with scattered Rural Estate, Mixed-
Use, and Professional Office. According to Placer County Goal 1.H (and supporting policies),
Placer County “shall seek to ensure that new development and public works projects do not
encourage expansion of urban uses into designated agricultural areas” (Placer County, 2013). NID
assumes no major changes to current land use plans in Placer County for the near-term future.
A portion of the District’s service area lies within the City of Lincoln’s sphere of influence. As the
City grows, land use is being modified and developments are actively moving through the planning
process. Land use planning for this area is addressed through the City’s General Plan and specific
planning process. The City provided projected development and water demands to NID. Projected
land-use and connections from the City are presented in Table 2-1. Water service options for the
District’s service are within the City of Lincoln continue to be investigated. At this time, NID will
utilize the total water demand provided by the City to project supply needs. Pending ongoing
investigations, this assumption should be revisited if alternative water service options are selected.
Table 2-1. City of Lincoln Land Use and Connection Projections Within NID Service Area
2025 Additional 2030 Additional 2050 Additional Total Additional
General Plan Land Connections Connections Connections Connections
Use Category Dwelling Dwelling Dwelling Dwelling
Acreage Acreage Acreage Acreage
Units Units Units Units
Country Estates 0 -- 75 -- 500 -- 575 --
Low Density
1,000 -- 600 -- 3,000 -- 4,600 --
Residential
Medium Density
200 -- 0 -- 500 -- 700 --
Residential
High Density
0 -- 250 -- 500 -- 750 --
Residential
Total Residential 1,200 -- 925 -- 4,500 -- 6,625 --
Neighborhood
-- 5 -- 10 -- 0 -- 15
Commercial
Total Non-
-- 5 -- 10 -- 0 -- 15
Residential
Note: Data provided by the City of Lincoln. Demand projections through the UWMP planning period as provided
by Lincoln are presented in Chapter 3.
1
Residential land use sub-groups include a mixture of Low Density (0.4-0.9 acre minimum), Low-Medium Density
(2-5 dwelling units/acre), Medium Density (5-10 dwelling units/acre), Rural Low Density (0.9-2.3 acre minimum),
and Rural (1-10 acre minimum).
2020 UWMP 7Nevada Irrigation District
2020 UWMP – Public Draft
Nevada County is primarily composed of residential, commercial, industrial, agricultural, and public
land uses (Nevada County, 2020). Nevada County’s Land Use Element of the General Plan reports
56 percent of the county is classified as “Forest” while 30 percent is classified as “Rural”. These two
land use designations are the two largest categories by acreage. Goal 1.3 of the Land Use Element
states, “Within Rural Regions, maintain and enhance the County’s pastoral character, existing land
use pattern, rural lifestyle, and economy in their natural setting”. This goal, and supporting policies,
aim to provide related benefits for the conservation of a rural character and preservation of natural
resources (Nevada County, 2020). As presented in Nevada County’s Land Use Element, the
predominant land use within the service area is Rural. Uses for this designation include rural
residential, agricultural operations and supporting agricultural production, natural resource
production and management, and low-intensity recreation.
NID deliveries to customers in Yuba County are made pursuant to the California Railroad
Commission (CRC) Order 15926. NID purchased the Excelsior Water And Power Company’s
Yuba County holdings in the 1920s and is required to deliver water to the area’s customers. Treated
water customers are supplied by the Smartsville WTP, while raw water customers are delivered water
through the Meade, Town, Ousley Bar, and Farm canals. The Yuba County General Plan identifies
this area served by NID as a “Rural Area”. Goal CD9 (and supporting policies) aims to maintain
the rural nature by preserving the existing character through strategic developmental designs and
standards (Yuba County, 2011).
2.3.1 Planned Projects
Planned projects within the District’s service area impact the projected number of customer
connections and overall treated water demands. In addition to the City of Lincoln planned land use
developments listed above. Table 2-2 lists the other planned projects the District is aware of that
would connect to the treated water system when built. These projects include treated water service
for domestic and commercial purposes as well as private fire services. Each project is at various
levels of the planning and implementation process. The number of units, lots, and connections
identified in Table 2-2 are subject to change as these are preliminary and based on current
information. The District maintains a development and new connection procedure to evaluate each
proposed project, approve, and coordinate the implementation with the respective project owner.
The project types listed in Table 2-2 include waterline extensions, potential waterline extensions,
master meter, approved projects (not submitted), private fire services, and potential private fire
services. Waterline extension projects are defined as projects requiring an extension of an existing
waterline, while potential waterline extensions are waterline extension projects that are in a pre-
planning phase (District has been made aware, although no City/County permitting has been
achieved). Master meter projects are projects that will be provided a master meter, with individual
meters yet to be installed. Approved Projects by City/County have been approved, although no
application for water service has been submitted to the District. Private fire service projects will be
provided water through dedicated meters for fire service, while potential fire service projects are in
the pre-planning phase.
2020 UWMP 8Nevada Irrigation District
2020 UWMP – Public Draft
Table 2-2. Planned Projects within NID service area
No. of Units, Lots, or
Project Name/Location
Connections 1
Waterline Extension
Blair Ct 5
Gracie Commons 49
Ridge Village 12
NJUHSD 1
Queen Lil Place 4 to 8
PCGC, Mercy (including PFS) 5
Loma Rica Ranch 240
Towntalk 11
Loma Rica DFWLE 20
American Hill Road 9
Timberwood Estates 45
Potential Waterline Extensions
Red Dog Road 16
Rincon del Rio 346
The Grove 59
Maranatha DFWLE 21
Timberline at Auburn 858
PCGC unknown
Table Meadow Road 21
Ali Lane DFWLE 8
Harris Road DFWLE unknown
Idaho Maryland Mine 30
Master Meter
Cashin's Field Affordable Housing 59
Brunswick Commons Apartments 41
Grass Valley RV Resort 150
Approved Projects by City/County (not submitted)
Berriman Ranch unknown
Atwood 80 65
Hidden Creek Subdivision 23
Kemper Woods Subdivision 17
Joeger 20 Subdivision 17
Kenny Ranch 100
Pendagio Vineyard Estates 95
2020 UWMP 9Nevada Irrigation District
2020 UWMP – Public Draft
No. of Units, Lots, or
Project Name/Location
Connections 1
Sunset Grove Homesites 5
Trees Resort at Darkhorse 34
Dorsey Marketplace unknown
West Olympia Hotel 74 rooms
Private Fire Services
ZAP Manufacturing 1
Timerline 1
Comfort Plumbing 1
Crown Point Ct 1
Brunswick Commons Apartments 1
Potential Private Fire Services
Grass Valley RV Resort 1
Cashin's Field Affordable Housing 1
1
Preliminary numbers, subject to change.
2.4 Social, Economic, and Demographic Factors
Social and demographic factors that affect water management planning include the uncertainty in
estimating future customer connections and water use per customer.
Future customer connections for both treated water and raw water customers are impacted by both
new construction and existing houses/parcels that currently are not customers. Potential future
demand for NID water of existing water-using parcels is characterized as “latent demand”. Latent
demand affects the customer connection to population growth demand, uncoupling the usual direct
relationship between the two. For example, from 2014 through 2020, approximately 60 percent of
the new treated water customer connections were classified infill connections, adding new demand
from existing housing stock. Latent demand analysis is an important element of NID’s long-term
water resources planning efforts and will be further addressed in NID’s Plan for Water. For the
purposes of this UWMP, projected connections are based on recent historic new customer rates, as
further discussed below.
Treated water use per customer can be affected by many aspects, including plumbing codes,
landscaping trends, and indirectly by the recent State-required water budgets. State Water Code now
requires a water agency to remain below an overall water budget applied to their service area that
consists of maximum allowable water uses for indoor and outdoor residential, landscape, non-
residential uses, and water loss. For treated water customers, the indoor budget is set at 55 gallons
per capita (gpcd), reducing to 50 gpcd in 2030. The residential outdoor budget is currently under
development by DWR and will consist of estimated irrigated landscape areas and
evapotranspiration-based water allowances. These regulatory requirements may impact future water
use trends, affecting the overall future demands. Unit water use factors are further addressed in
Chapter 3.
2020 UWMP 10Nevada Irrigation District
2020 UWMP – Public Draft
Raw water customers represent the largest customer by water volume for NID. Raw water
customers include commercial agricultural, small agricultural, personal/hobby farms and gardens,
golf courses, and other water uses that contribute to the rural character of the service area. Changes
to the demographics of the raw water customer may also affect raw water use, depending on new or
next-generation owners and their intended water use. Raw water customer unit water demands are
further discussed in Chapter 3. Raw water use analysis and future unit demands are also an
important element of NID’s long-range water resources planning efforts and will be further
addressed in NID’s Plan for Water.
2.5 Current and Projected Connections
The current and projected number of connections is the basis for projected District water demands
(treated and raw) for the planning horizon. Annual growth rates for the period 2014 through 2020
are developed and applied to the number of 2020 connections for each customer type to
characterize the expected growth within NID’s service area. NID’s customer base includes retail
and wholesale customers receiving treated and/or raw water. Additional information on each
customer type is presented below.
2.5.1 Retail Customers
Retail services provided by the District make up the majority of customer connections as well as
total use. The retail services provided by NID include treated water for consumption and raw water
deliveries for various purposes (commercial agricultural, small agricultural, etc.). Retail treated
customers consist of the following classifications:
• Single-Family • Institutional and Governmental
• Multi-Family • Landscape Irrigation
• Commercial • Other
• Industrial
The District’s retail treated water customer base increased from 18,900 in 2014 to 19,648 in 2020.
During the same period, NID’s retail raw water customers increased from 5,035 to 5,188. Table 2-3
presents the total number of treated and raw water connections, and corresponding growth rate, for
the period 2014 through 2020.
Table 2-3. NID Retail Connections for Period 2014 through 2020
Average
Retail
2014 2015 2016 2017 2018 2019 2020 Annual
Customers
Growth
Treated 18,900 19,044 19,132 19,287 19,437 19,524 19,648 0.6%
Raw 5,035 5,044 5,119 5,187 5,162 5,157 5,188 0.5%
District Total: 23,935 24,088 24,251 24,474 24,599 24,681 24,836 0.6%
New retail treated connections can be attributed to “in-fill” or “mainline extension” projects. “In-
fill” projects include standby connections (see below), variances, and temporary service lines.
2020 UWMP 11Nevada Irrigation District
2020 UWMP – Public Draft
“Mainline extension” projects require infrastructure improvements and are associated with planned
District projects and developer projects. For the period 2016 through 2020, 60 percent of the new
meter installations are classified as “in-fill” projects, with the remaining 40 percent classified as
“mainline extension” projects.
Single Family Customers
NID’s treated customer base primarily consists of Single Family connections, which include various
land-use zoning classifications with Placer, Nevada, and Yuba counties. Single Family customers
make up 72 percent of NID’s retail customer connections in 2020 while accounting for 60 percent
of treated water demands. Proportionally, this customer class represents the largest with respect to
treated water connections and use. Figure 2-2 illustrates the number of Single Family connections
for the period 2014 through 2020. As seen on the figure, the connections increased from 17,366
(2014) to 17,824 (2020), representing an average annual growth rate of 0.4 percent. This growth rate
is applied to the 2020 connections to project the number of Single Family connections out to 2040
(see Table 2-4).
Figure 2-2. Number of Single Family Connections (2014-2020)
Multi-Family Customers: Multi-family connections make up approximately one percent of the
District’s 2020 total treated and raw water retail connections. The majority of the multi-family
connections are located in North Auburn, specifically Auburn Greens, and have remained a constant
219 connections for the period 2014 through 2020. Based on the land-use projections and rural
character of the service area, limited growth is anticipated with respect to the number of multi-
family connections. However, planned residential projects, including Mercy First Housing, Loma
Rica Ranch, and Rincon del Rio will increase the number of multi-family connections over the
2020 UWMP 12Nevada Irrigation District
2020 UWMP – Public Draft
planning horizon. The projected number of multi-family connections assumes an average annual
growth of 0.7 percent, resulting in a total of 250 Multi-Family connections by 2040. Depending on
the potential approval of future developments, this projection may change.
Commercial Customers: A total of 735 commercial customers were served in 2020, making up
three percent of NID’s retail customer connections. Commercial customers grew 0.61 percent
annually from 2014 through 2020. This growth rate is applied to the 2020 connections to estimate
the number of connections for the planning horizon. As shown on Table 2-4, this class is expected
to grow to approximately 825 connections by 2040.
Industrial Customers: The District has maintained one industrial customer for the period 2014
through 2020. The District acknowledges the potential for a limited amount of industrial
connections in the future and will identify as such when project plans are developed. No new
industrial customers are assumed for the planning horizon.
Institutional and Governmental Customers: Institutional and governmental customer
connections total 102 for 2020. This represents less than one percent of the District’s retail
customers. The average annual growth for the period 2014 through 2020 was 0.8 percent. This
growth rate is applied to the number of 2020 connections to estimate the projected number of
institutional and governmental connections for the planning horizon.
Landscape Customers: In 2020 there were 123 customers on dedicated landscape meters. The
growth of these customer connections was two percent annually for the period 2014 through 2020.
The recent growth rate reflects State requirements that mandate Commercial, Industrial, and
Institutional (CII) accounts using water for irrigation purposes to transition to dedicated landscape
meters. The two percent annual growth rate is applied to the 2020 connections to estimate the
projected number of landscape customers for the planning horizon. The projected total number of
connections for the planning period is presented in Table 2-4.
Other Customers: The other customer classification includes connections used for standby fire
services. Per regulatory requirements, these connections are required for new and remodeled
developments. There were a total of 644 other connections in 2020. The average annual growth
rate for the period 2014 through 2020 is 6.3 percent, reflecting the implementation of the regulatory
requirement regarding standby fire service connections. This same growth rate is assumed
throughout the planning period.
Raw Water Customers: Retail raw water customers make up the majority of total water use while
representing the second-largest retail customer class (by number of connections). NID provides
retail service to its raw water customers during the irrigation season (April 15 through October 14),
Fall/Winter, and annually. For Fall/Winter and annual service, the District requires irrigation
season service. As a result of this policy, the number of Fall/Winter and annual customers are a
subset of, and included in, the total number of irrigation season customers.
In 2020, a total of 5,188 customers ordered raw water service from the District, with 744 of those
customers ordering deliveries during the Fall/Winter and 296 annually. In 2020 there were an
additional 1,148 inactive raw water customer connections (those that did not order water). Figure 2-
3 illustrates the total number of Raw Water customers (not including inactive) for the period 2014
through 2020. As seen on the figure, this customer base increased from 5,035 (2014) to 5,188
2020 UWMP 13Nevada Irrigation District
2020 UWMP – Public Draft
(2020), representing an average annual growth rate of 0.5 percent. This growth rate is applied to the
total number of raw water customers for 2020 to estimate the total number of raw water customers
for the planning horizon. Fall/Winter customers grew approximately 4.8 percent annually during
the period 2014 through 2020. The number of annual customers, those that use raw water indoors,
decreased 2.1 percent annually for the period 2017 through 2020. It is assumed that as these
customers connect to the District’s treated water system or drill a well, the number will continue to
decrease, as District policy does not allow new annual raw water customers. These growth rates are
applied to the number of 2020 connections for each raw water customer subset to estimate the
District’s Fall/Winter and annual raw water customers for the planning horizon. 2020 total
connections, average annual growth rate applied, and projected number of connections for the
District’s raw water customers are presented in Table 2-4.
Figure 2-3. Number of Raw Water Customers (2014-2020)
Standby Customers: Standby customers represent parcels fronting treated water distribution lines
but are not yet receiving service. At the end of 2020, there were a total of 1,639 standby
connections. The total number of standby customers fluctuates throughout the year. Projections
for these customers are assumed to be captured by the projections of other customer connections,
as a standby customer is converted to a treated water customer. Therefore there are no projections
for standby customer counts.
2.5.2 City of Lincoln
The City of Lincoln maintains its own retail water distribution system. In the past, the District has
investigated constructing its own water treatment plant to serve its service area in the City of
Lincoln. Currently, the District supplies raw water to Placer County Water Agency for treatment,
who in turn provides the treated water to the City of Lincoln for retail. For the purposes of this
2020 UWMP 14Nevada Irrigation District
2020 UWMP – Public Draft
plan, it is assumed this operation will continue in the near future, and therefore is represented by
one raw water wholesale connection to PCWA for the benefit of the City of Lincoln.
2.5.3 Wholesale Customers
Wholesale services include treated and raw water deliveries. Raw water wholesale connections
include City of the Grass Valley WTP, Nevada City WTP, and Nevada City School of Arts. Treated
water wholesale connections include City of Grass Valley and Lake Vera Mutual Water Company.
For this analysis, the total number of wholesale customers is not expected to increase during the
planning horizon.
2.5.4 Summary of Current and Projected Connections
As seen from Table 2-3 (above), the treated connections have increased from 18,900 in 2014 to
19,648 in 2020. This represents an increase of approximately four percent over the 2014 number of
treated connections. The raw water customers have increased from 5,035 in 2014 to 5,188 in 2020,
representing an increase of three percent over the 2014 number of raw water connections.
Table 2-4 presents the number of 2020 active connections by customer class, average annual growth
rate applied, and the resulting number of projected connections for the period 2020 through 2040,
in five-year increments. Average annual growth rates are developed based on the historical growth
rate for each customer classification as described above.
2020 UWMP 15Nevada Irrigation District
2020 UWMP – Public Draft
Table 2-4. Current and Projected Connections
Annual
Service Area 20201 2025 2030 2035 2040
Growth Rate
NID Treated Retail Customers
Single Family 17,824 0.4% 18,206 18,587 18,969 19,351
Multi Family 219 0.7% 227 235 242 250
Commercial 735 0.6% 758 780 803 825
Industrial 1 0.0% 1 1 1 1
Institutional/ Governmental 102 0.8% 106 110 115 119
Landscape 123 2.0% 136 148 161 173
Other 644 6.3% 847 1,049 1,252 1,454
Standby 1,639 included in other customer categories
Retail Treated Water Total: 21,287 20,279 20,910 21,541 22,172
NID Treated Wholesale
Lake Vera Mutual Water
1 n/a 1 1 1 1
Company
Grass Valley 1 n/a 1 1 1 1
Lincoln NID Service Area – Raw Water Supplied to PCWA
PCWA connection 1 n/a 1 1 1 1
NID Raw Water Customers
Irrigation Season 5,188 0.5% 5,316 5,341 5,367 5,392
Fall/Winter Season (subset
744 4.8% 924 960 996 1,032
of total)
Annual Use (subset of total) 296 -2.1% 264 258 252 245
NID Raw Water Wholesale
Nevada City 1 n/a 1 1 1 1
Grass Valley 1 n/a 1 1 1 1
Nevada City School of Arts 1 n/a 1 1 1 1
1Number of active accounts.
2.6 Current and Projected Customer Population
The NID retail service area covers multiple counties, cities, and other places identified in the census
and California Department of Finance population analysis. Therefore, the population is represented
by portions of multiple census places, tracts, and blocks. The California Department of Water
Resources provides a tool for water agencies with similar service area issues to estimate customer
population. The DWR population tool utilizes the census block data and treated water service area
to parse the population count into the actual treated water service area. Using the number of single
family and multi family connections, the tool provides a population per connection that is used to
estimate the treated water customer population. As some of the population within NID’s service
area is served by private wells or other suppliers, the DWR population tool does not provide the
2020 UWMP 16Nevada Irrigation District
2020 UWMP – Public Draft
actual customer population but does provide the population per connection used to estimate the
population.
In the 2015 UWMP, NID replicated the DWR methodology to develop the population per
connection and subsequent population estimation. Results from the 2015 effort indicate the
District’s person-per-connection ratio of 2.84. For planning purposes, this ratio from the District’s
2015 UWMP is utilized to estimate NID’s 2020 customer population and projections. Current and
projected treated water customer population is presented in Table 2-5. Multi-family connections are
assumed to have an average of four dwelling units per connection. It is recommended NID revisit
this metric after the release of the 2020 Census data, and update projections as applicable.
Table 2-5. Current and Projected Treated Water Customer Population
Population 2020 2025 2030 2035 2040
Served 52,733 53,839 54,927 56,016 57,104
Census year population estimates for the total service area and the District’s treated customer base
are presented in Table 2-6. The DWR population tool methodology reports the District’s total
service area population based on District boundary and census year block data as reported in the
2015 UWMP.
Table 2-6. Census Year Population Comparison
Treated Water
Total Service Area % of Service Area
Year Customer
Population Population
Population
2000 82,941 39,374 47.5%
2010 93,690 49,023 52.3%
Ave Annual Growth Rate 1.2% 2.2% --
The District’s total service area population increased at a rate of 1.2 percent annually between the
census years, while the treated water customer base increased annually by 2.2 percent. The different
growth rates between the service area population and treated customers could be attributed to
existing residents connecting to the NID treated water system, or new development prioritizing
treated water connections versus private wells.
Population projections developed by the California Department of Finance (DOF) for Placer and
Nevada counties are presented in Table 2-7. The projections incorporate historic populations and
demographic trends, and are obtained from DOF’s Table P-2A (Total Population for California and
Counties, accessed 2021). According to DOF methodology, the previous year populations are used
as a starting point, with factors such as births, deaths, and migration patterns applied to estimate the
target year population. The total population for both counties is expected to increase by
approximately 0.79 percent annually for the period 2020 through 2040.
2020 UWMP 17Nevada Irrigation District
2020 UWMP – Public Draft
Table 2-7. California Department of Finance Population Projections for Nevada and
Placer Counties
County 2020 2025 2030 2035 2040
Nevada County 97,439 99,131 101,004 102,479 103,193
Average Annual Growth Rate from
-- 0.34% 0.36% 0.34% 0.29%
2020
Placer County 397,469 414,544 437,655 458,999 476,434
Average Annual Growth Rate from
-- 0.84% 0.97% 0.96% 0.91%
2020
Total 494,908 513,675 538,659 561,478 579,627
Average Annual Growth Rate from
-- 0.75% 0.85% 0.84% 0.79%
2020
Source: California Department of Finance, Table P-2A (Total Population for California and Counties,
accessed 2021).
In addition to the unincorporated areas of each county, the DOF county-wide projections include
populations for the communities of Rocklin, Roseville, Lincoln, and Loomis (Placer County), as well
as Grass Valley, Nevada City, and Truckee (Nevada County). Some of these communities are
expecting higher growth, and therefore, the total population reported in Table 2-7 is likely not
reflective of the expected level of growth and associated population estimates for the District’s
service area within Placer and Nevada counties. However, the county-wide population projections
do provide a general level of understanding of county-wide growth, which is expected to affect the
NID customer projections. It is recommended the District further analyze customers and
population growth when the 2020 census data is available as part of the Plan For Water process.
2020 UWMP 18Nevada Irrigation District
2020 UWMP – Public Draft
3 Water Use Characterization and Projected Demands
This section presents the past treated and raw water system demands, demand characterization, and
projected demands.
3.1 Historical Demands
The District’s historical demands for the period 2014 through 2020 are described per service type.
The customer types include treated retail, treated wholesale, raw retail, raw wholesale, and instream
environmental. In summary, retail raw water demands make up the majority of total demands,
averaging 94 percent for the period. 2020 total wholesale and retail treated water demands were the
highest for the period and showed an increase of eight percent over 2019 demands. The increase in
treated water use may be reflective of the recent pandemic resulting in customers staying at home.
3.1.1 Treated Water Retail Customers
The District serves treated water to retail customers. All of NID’s treated retail customers are
metered. Customer categories consist of single family and multi-family residential connections, as
well as commercial, industrial, institutional and governmental, landscape, and “other” customer
types. Demand information for each customer category is presented below, including unit factor
demands (annual demand per connection type) developed for projecting future water demands.
Historic treated water retail customer demands are summarized in Table 3-1.
Single Family: Single family customers averaged approximately five percent of total retail demands
(including raw water demands) for the period 2014 through 2020, while averaging 74 percent of the
total retail treated use for the same period. The single family customers are NID’s largest retail
treated customer base. The 2020 unit demand factor of 0.36 acre-feet per year per connection
(AFY/connection) and is used for projecting demands. As discussed in Chapter 2, the state will
soon mandate indoor and outdoor water budgets for residential. The indoor budget starts at 55
gallons per capita day (gpcd) in 2023, and reduces to 50 gpcd in 2030. Using the capita per
connection from Chapter 2 of 2.84, 50 gpcd translates to 0.16 AFY. Therefore, approximately one
third of the assumed unit demand factor of 0.36 AFY/connection is indoor demand. The District
will revisit unit demand factors once the state has finalized the outdoor water use budgets.
Multi-Family: The multi-family customers primarily consist of residents in North Auburn, where
the District provides water to 175 fourplexes. This customer base averaged eight percent of total
treated retail demands for the period 2014 through 2020. The use per connection averaged 2.82
AFY/connection for the same period. This unit demand factor is utilized in projecting demands
through 2040.
Commercial: Commercial demands averaged ten percent of treated retail demands for the period
2014 through 2020, representing the second largest customer base (by total use) for the District’s
treated retail customers. Total use per connection for the same period averaged 1.06
AFY/connection. This unit demand factor is utilized in projecting demands through 2040.
Industrial: Industrial water use is minimal within the District’ retail service area. No use was
reported from 2014 through 2019, with 0.22 AF reported in 2020. This unit demand factor is
utilized in projecting demands through 2040.
2020 UWMP 19You can also read