New Richmond Housing and Market Needs Analysis - Final December 2021
←
→
Page content transcription
If your browser does not render page correctly, please read the page content below

New Richmond Housing and Market
Needs Analysis
Final December 2021
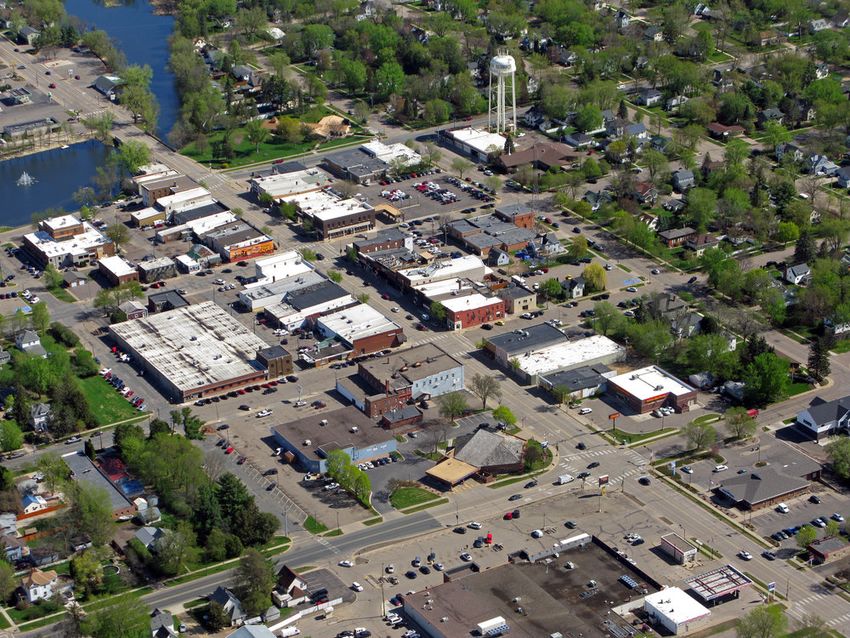
Table of Contents
1. Executive Summary                   2

2. About New Richmond                  4

3. General Housing Characteristics     12

4. Rental Market                       17

5. Ownership Market                    28

6. Housing for Special Populations     39

7. Other Forces Impacting the Market   45

8. Housing Gaps and Opportunities      53

9. Implementation                      60

                                            1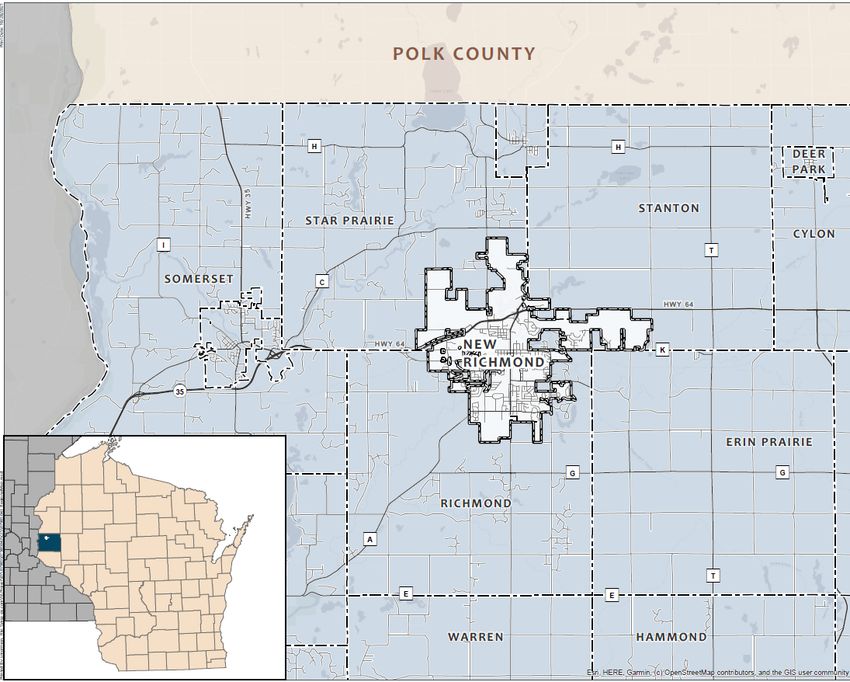
Executive Summary
Priorities for New Richmond                                               Housing Gaps and Opportunities
•   Detached Single Family Housing – Continued development of             •     The 482-911 owner-occupied units that are projected to be needed in the
    detached, single-family housing, especially at the $250,000-                local housing market over the next 10 years should be in the following
    $300,000 price point.                                                       sale ranges (2021 dollars):
                                                                                   • 111-210 units priced $35,000*-$232,000
•   Missing Middle Housing – Varied housing forms with 2-16 attached               • 62-116 units priced $190,000-$294,000
                                                                                   • 232-439 units priced $228,000-$408,000
    units, either rental or condo, addressing affordability, senior
                                                                                   • 77-146 units priced greater than $408,000
    accessibility, and neighborhood compatibility.
                                                                          •     The 359-676 rental units that are projected to be needed in the local
•   Housing for Seniors – Independent and assisted living units for the         housing market over the next 10 years should be in the following price
    growing senior population. Some of these units should be targeted           ranges (2021 dollars):
    downtown, within walking distance of services and opportunities for           • 102-193 units priced $300-$600/month
    socialization.                                                                • 127-238 units priced $500-$900/month
                                                                                  • 60- 113 units priced $800-$1,300/month
•   Broadband – Ensure all residential and                                        • 70 -132 units priced $1,000-$2,000/month
    business/commercial/industrial areas have reliable, fast internet.
                                                                          •     An additional 41 assisted living units are needed for seniors by 2030.

                                                                          •     A total of 142 subsidized and 18 market rate senior units are needed by
                                                                                2030.
                                                                          *Home ownership at this price point is challenging and may not be possible without significant subsidy.

                                                                                                                                                                                    2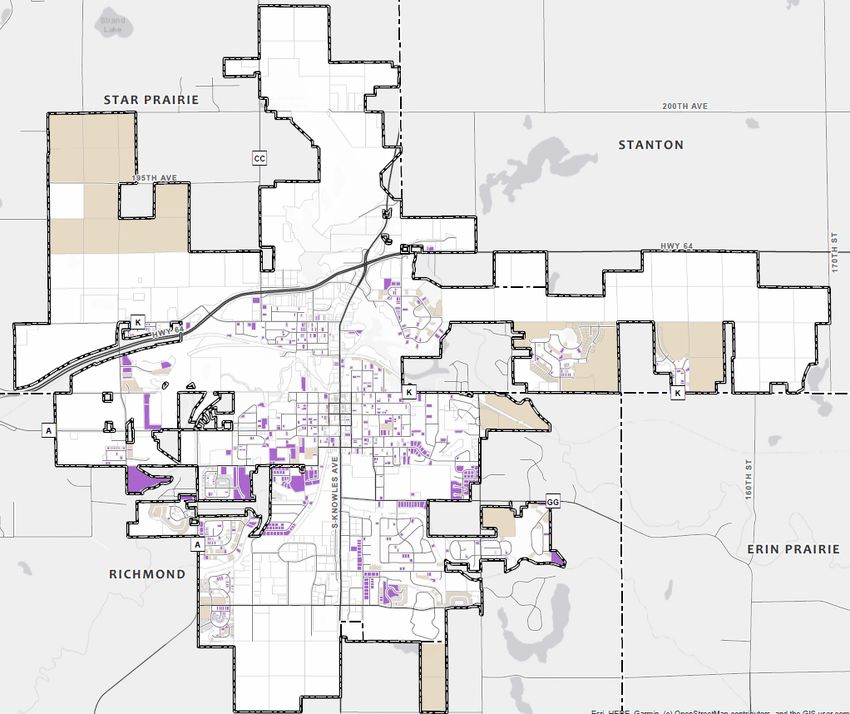
Study Process
Introduction
  •    This study was commissioned by the City Council and Forward New Richmond to inventory the existing housing stock in the city and assess where gaps exist in the
       housing market. The purpose of the study is to help the city better understand its housing market and to craft targeted strategies to improve options within the
       community. The study process began in August 2021 and was completed in December 2021. Project oversight was providing by City of New Richmond staff.

Primary Data Sources                                                                         Interviews
  •    US Bureau of Labor Statistics 2015-2019 American Community Survey (ACS)                   •     Troy Boe –Property Executive Realty
       Estimates*
                                                                                                 •     Trevor Bruce – Bee Restoration
  •    US Bureau of Labor Statistics 2010 Census Counts*
                                                                                                 •     Matt Tuinstra – Royal Credit Union
  •    Wisconsin Department of Administration Population Projections (2025-2040)*
                                                                                                 •     Steve Dus – Northwood Technical College
  •    Multiple Listing Service (accessed September 2021)
                                                                                                 •     Steve Massey – Westfields Hospital
  •    US Department of Housing and Urban Development Comprehensive Housing
       Affordability Strategy Data (2017)*                                                       •     Patrick Olson – New Richmond School District

  •    City and St. Croix County GIS Data (2021)                                                 •     Michelle Carlson – WESTconsin Credit Union

  •    New Richmond Comprehensive Plan
  •    New Richmond Municipal Code

  *Note: These sources represent the most recent available data. Due to delays caused by the pandemic, 2020 Census data (and updated data derived from the Census) was unavailable for this study.

                                                                                                                                                                                                     3
About New Richmond

                     4
Community Basics
• The City of New Richmond is in St.
Croix County, WI, located at the
intersection of Highway 64 and 65.
• The St. Croix River Crossing, a $650
million bridge project, opened in
August 2017, shortening the commute
from Minneapolis/St. Paul down to
around 30 minutes.
• The City is considered to be within the
larger 16-county Twin Cities Metro
Region.
• This study’s purpose is to help New
Richmond better understand its
housing market and craft strategies for
the continued growth of the market as
its population continues to increase.
5Year City of St. Croix State of
New County Wisconsin
Richmond
Population Change and Future Projections 2010 8,245 82,636 5,637,947
• New Richmond has seen a relatively significant population increase from 2011 8,331 83,657 5,664,893
2010-2020 (22%).
2012 8,376 84,363 5,687,219
• The Wisconsin Department of Administration projects the population in 2013 8,441 84,912 5,706,871
the City will increase by 20% between 2020-2040. The state is anticipated
to experience a 10% increase and the county is anticipated to experience a 2014 8,501 85,442 5,724,692
25% increase during the same period. 2015 8,559 86,118 5,742,117
• As the population of the Twin Cities Metro continues to expand east into 2016 8,687 86,726 5,754,798
St. Croix County, New Richmond and surrounding Towns will continue to
2017 8,761 87,142 5,763,217
experience growth pressure.
140,000
12,000 2018 8,891 87,917 5,778,394
120,000
St Croix County Population
New Richmond Population
10,000
100,000 2019 9,034 88,732 5,822,434
8,000
80,000
6,000
2020 10,075 95,202 5,893,718
60,000
4,000 40,000 2025 10,560 104,450 6,203,850
2,000 20,000
2030 11,300 111,470 5,375,910
- 0
2010 2011 2012 2013 2014 2015 2016 2017 2018 2019 2020 2025 2030 2035 2040
2035 11,780 115,900 6,476,270
Year
City of New Richmond St Croix County 2040 12,130 119,010 6,491,635
Source: Wisconsin Department of Administration
6Household Change and Future Projections
• The number of total households in the City and County has increased since 2010 and these numbers are projected to
increase at an even higher rate over the next 20 years (29.6% in New Richmond and 29.4% in the County). During the
same time period the State is anticipated to see a 12% increase in the number of households.
• Total households have increased slightly over the last 10 years while household size has decreased. Household size is
projected to continue decreasing over the next 20 years.
• The falling household size trend indicates additional demand for smaller family-sized housing units in both rental and
ownership markets, such as attached single family townhome and duplex style.
6,000 60,000 New Richmond St. Croix County State of
Wisconsin
St Croix County Households
New Richmond Households
5,000 50,000
4,000 40,000
Change 2010- 665 6,111 83,545
2020
3,000 30,000
Percent 19.2% 19.2% 3.6%
2,000 20,000
Change
1,000 10,000
Change 2020- 1,224 11,138 298,340
- -
2010 2011 2012 2013 2014 2015 2016 2017 2018 2019 2020 2025 2030 2035 2040
2040
Year Percent 29.6% 29.4% 11.97%
Change
City of New Richmond St Croix County
Source: Wisconsin Department of Administration
7Age Cohorts and Future Projections
• Housing preferences changes with age:
• The youngest independent households (20-34)
35,000 tend to have demand for smaller, more
affordable homes, especially before they have
30,000 children, or while those children are still small.
• The prime years with demand for more space
25,000
are 35-54, when households are most likely to
have growing kids.
Population
20,000
• Beyond age 55, and especially beyond 65,
15,000 households may prefer to downsize to ease
upkeep and accessibility.
10,000
5,000 • Looking at projected population growth rates for St.
Croix County, the fastest growing population is 65 and
- older, with a 124% increase from 2019 to 2040. This
2015 2019 2020 2025 2030 2035 2040
age group is also the fastest growing statewide, though
Year
the percentage growth rate is lower at 24%.
0-9 Years 10-19 Years 20-34 Years 35-54 Years 55-64 Years 65-84 Years 85 and Over
• The sizes of the other age cohorts are projected to
Source: Wisconsin Department of Administration remain stable over the next 20 years.
8Employment Indicators
Inflow Outflow Job Counts in New Richmond Where New Richmond Workers Live Average Daily Commute
3,500 3,292 60.0%
3,000
48.9%
2,500 50.0%
Workers
2,000
40.0%
1,500 1,030
1,000 29.8% 28.7%
30.0%
500 129 103 65 58 55 53 48 43 42 22.2% 21.3%
- 20.0% 15.8%17.1%
10.5%
10.0% 7.6% 8.0%
0.0%
City of New Richmond St. Croix County
Place of Residence
0-14 Min 15-24 Min 25-34 Min 35-59 Min 60 Min or More
Source: US Census Bureau ACS Source: US Census Bureau ACS
Source: US Census Bureau ACS
• Where workers live often coincides with location of their jobs, although there is a high degree of mobility in the region. The number of workers in New
Richmond is about 5,000.
• Most workers in the City are coming from other communities (River Falls, Hudson, etc.), and most New Richmond residents are traveling for work
outside of the City. Though most that travel for work still have a relatively short commute time which means they are most likely staying in the County.
The “other locations” category in the chart represents workers in the surrounding townships and the Twin Cities Metro Area.
• The second most common commute time for residents is 35-59 minutes, which is representative of workers traveling to the Twin Cities Metro Area.
9Employment Indicators
• The weighted average for affordable rent limit (no more than 30% of income towards rent) for these top occupations is $1,761/month
• The weighted average for affordable ownership limit (no more than 30% of income towards mortgage) for these top occupations is $365,481
Top Employers in New Richmond Top Occupations in New Richmond
Company Name Occupation Title Number of Annual Mean Monthly Affordable
Number of Employees Workers Wage Affordable Rent Home Purchase
Price
Westfields Hospital 250-499
Lakeside Food Inc 250-499 Management Occupations 587 $131,900 $3,298 $673,381
Office and Administrative Support 574 $46,250 $1,156 $245,392
Phillips Medisize 250-499
St Croix Health and Human Services 250-499 Production Occupations 534 $44,710 $1,118 $237,309
Walmart Supercenter 250-499 Healthcare Practitioner 305 $92,500 $2,313 $472,993
Federal Foam Technologies 100-249 Business and Finacial operations 267 $83,220 $2,081 $425,795
Syntegon Packing Technology 100-249 Material Moving Occupations 262 $44,710 $1,118 $237,309
Computer, Engineering and
Science 260 $96,530 $2,413 $493,489
Dicks Fresh Market 100-249
Food Prep and Serving 236 $30,690 $767 $167,877
New Richmond Area Centre 100-249
Personal Care and Service 233 $34,230 $856 $182,357
Northwood Technical College 100-249
Source: US Census Bureau ACS Construction 228 $66,910 $1,673 $353,840
10Income Trends
$90,000 $84,756
$80,000 • Income and earnings are key factors in housing affordability, the more income a
$70,000
household earns, the more housing options that household has within reach.
$60,131
$60,000
$50,000 • Median household income is significantly lower in New Richmond as compared to
income
$39,287
$40,000 $32,938
the County ($60,131 vs. $84,756).
$30,000
$20,000 • The greatest increases in number of households by income level have been at the
$10,000 lowest end of the income spectrum ($100,000).
$0
City of New Richmond St Croix County Housing Affordability: Housing affordability is a measure of how much a person or household can spend toward total
Community housing cost. The widely accepted standard for affordability states that a household should spend no more than 30% of
their gross income toward housing costs. This standard is the same for owners and renters. For renters this also includes
utilities and renters insurance. For homeowners this includes principal, interest, taxes, insurance, and utilities.
Median Household Income Per Capita Income
Source: US Census Bureau ACS
City of New Richmond St Croix County
Household Income
Level $100k $100k
2010 Estimate 1,151 1,106 479 423 10,592 7160 5,410 7,542
2019 Estimate 1,576 616 614 912 9,312 5,786 5,540 12,944
Change 425 -490 135 489 -1280 -1374 130 5402
11General Housing Characteristics
12Housing Type by Unit
• The most common structure type in New Richmond, St. Croix County, and statewide is detached, single-unit homes.
• The second most common structure type in the City and County is single-unit attached (townhomes). Statewide the second most common
housing type is 20 or more unit buildings.
• Providing a variety of unit types is essential to allow residents choice within a housing market.
St. Croix County Unit Type City of New Richmond Unit Type
4.80% 2.60%
2.07% 8.80% 0.3%
2.40%
3.20%
5.60%
2.80%
10.20% 4.50% 51.3%
7%
7.90%
71.70%
14.50%
1-unit, Detached 1-unit, Attached 2 units 1-unit, Detached 1-unit, Attached 2 units
3 or 4 units 5 to 9 units 10 to 19 units 3 or 4 units 5 to 9 units 10 to 19 units
20 or more units Mobile home Boat, RV, Van, etc. 20 or more units Mobile home Boat, RV, Van, etc.
Source: US Census Bureau ACS Source: US Census Bureau ACS
13New Richmond Owner Occupied Year Structures Built
Year Structures Built
1939 or earlier 191
1940 to 1959 346
1960 to 1979 229
Year Built
• 66% of all housing units in New Richmond were built after 1980. Compared to the County, New
1980 to 1999 74
Richmond has a relatively newer housing stock.
2000 to 2009 612
• Older homes tend to lack amenities that current buyers are interested in, require rehabilitation, 2010 to 2013 107
and have higher maintenance costs. 34% of all housing units in the City were built prior to 1980. 2014 to 2019 42
- 100 200 300 400 500 600 700
• The peak of residential construction in the City was 1980-1999, there was also significant Number of Units Built
development from 2000-2009. New housing development was initially slow after the Great Source: US Census Bureau ACS
Recession. Since the opening of the bridge in 2017, the pace of residential development has
been rapid. This growth is not reflected in ACS data, but in City permit data on the next page. New Richmond Renter Occupied Year Structures Built
1939 or earlier 51
35%
30% 1940 to 1959 131
Percentage of Units
25% 1960 to 1979 333
Year Built
20%
15% 1980 to 1999 644
10% 2000 to 2009 338
5%
2010 to 2013 49
0%
City of New Richmond St Croix County
2014 to 2019 24
Communities
- 100 200 300 400 500 600 700
2014 to 2019 2010 to 2013 2000 to 2009 1980 to 1999 1960 to 1979 1940 to 1959 1939 or earlier Number of Units Built
Source: US Census Bureau ACS
Source: US Census Bureau ACS
14Single Family and Duplex Home Construction Permits
120
Construction Activity 100
80
Units
60
40
• Building permit data shows real time trend of new
construction in New Richmond. The City is experiencing 20
increasing growth in single-family development. Many 0
stakeholders noted this trend in interviews. 2012 2013 2014 2015 2016 2017 2018 2019 2020 2021
Year
• Duplex construction continues to rise. Single Family Duplex
Source: City of New Richmond
• Multi-unit building construction has not been consistent, Multi-Unit Construction Permits
which is typical of this type of development as buildings 80
contain multiple units. 70
60
50
Units
40
30
20
10
0
2012 2013 2014 2015 2016 2017 2018 2019 2020 2021
Year
Multi-Unit (3+ Unit Buildings)
Source: City of New Richmond
15Crowding Owner Occupied
0.50 or less occupants per room
0.51 to 1.00 occupants per room
Occupancy
• Crowding data is used to display the relationship 1.01 to 1.50 occupants per room
between housing unit size (number of rooms) and 1.51 to 2.00 occupants per room
household size (number of people).
2.01 or more occupants per room
• Households that average more than 1 person per room
- 200 400 600 800 1,000 1,200 1,400 1,600 1,800
or 1.5 persons per room are considered overcrowded or
Number of Households
extremely overcrowded, respectively.
Source: US Census Bureau ACS
• Based on the data, crowding is not an issue in New Renter Occupied
Richmond. In both owner- and renter-occupied units, 0.50 or less occupants per room
there were no units that had more than one occupant
per room. 0.51 to 1.00 occupants per room
Occupancy
1.01 to 1.50 occupants per room
1.51 to 2.00 occupants per room
2.01 or more occupants per room
- 200 400 600 800 1,000 1,200 1,400
Number of Households
Source: US Census Bureau ACS
16Rental Market
17Renter Occupied
Properties
Housing Tenure
44%
56%
Owner-Occupied Renter-Occupied
Source: US Census Bureau ACS
18Affordability
• A household that spends more than 30% of its income on housing is considered cost burdened. A household that spends more than 50% is
considered severely cost burdened.
• The table below shows the general monthly rent a household could afford, by household size, at various income levels as a percentage of the Area
Median Income (AMI).
• In New Richmond about 32% of renters are cost burdened and 14% are severely cost burdened, which is high when compared to surrounding
communities.
• The percentage of renters who are cost burdened in New Richmond is much higher than among homeowners. This is typical in most communities
and is a reflection of lower renter incomes, barriers to securing financing, and other market forces.
Maximum Monthly Rent for Family
of 4 Without Paying More Than 30%
Income Limit of Gross Income Toward Housing
Area (100% Median Income) Income Limit Category Persons in Family
1 2 3 4 5 6 7 8
Extremely Low Income (30%
AMI) $ 316 $361 $407 $451 $498 $571 $644 $717
New Richmond $1,503
Very Low Income (50% AMI) $527 $602 $677 $752 $812 $873 $932 $993
Low Income (80% AMI) $806 $922 $1,036 $1,151 $1,244 $1,336 $1,428 $1,520
Median Income (100% AMI) $1,008 $1,152 $1,295 $1,439 $1,555 $1,670 $1,785 $1,900
19• Of renters experiencing cost burden, 14.6% are severely cost
Housing Stress burdened (spending more than 50% of income on rental costs).
• Cost burden in the City exists primarily with renter households at
or below 50% of the area median income, those considered very
Cost Burden Renters
low or extremely low income.
50% 47.4%
• There are gaps in the rental market for those earning the lowest
45%
incomes and for those earning higher incomes. This
Percentage of Renter Households
40% demonstrates a need for both subsidized and higher-rent,
higher-quality units in the market.
35% 32.8% 32.2%
30%
Rental Unit Mismatch
25%
20.0% 20.0%
20% 18.8% Rental Units Renter Over/Under
14.6%
Available Households Supply
15% 13.3%
10% 0-30% AMI 270 410 -140
5% 31-50% AMI 830 505 325
0.0%
0%
City of New Richmond Village of Somerset Town of Richmond 51-80% AMI 340 245 95
Communities
>80% AMI 0 280 -280
% Cost Burdened % Severely Cost Burdened Total % Cost Burden
Source: HUD CHAS Source: HUD CHAS
20Rental Unit Consumption by Income
Rental Unit Consumption Affordable at >80% AMI 32% 46% 21%
Rental Unit Affordability
Affordable at 80% AMI 10% 14% 30% 17% 29%
• The figure on the upper right shows 38% of units affordable to
Affordable at 50% AMI 16% 25% 32% 11% 17%
those earning 30% or less are being rented by households at that
income level. 62% of these units are rented by households earning
Affordable at 30% AMI 38% 34% 15% 5% 8%
more than 30% AMI.
0% 20% 40% 60% 80% 100%
• All of the units affordable to households earning more than 80% Percentage of Households
AMI are rented by households earning less than that. This indicates
100% AMI
that higher income households are “renting down”, creating a Source: US Census Bureau CHAS
difficult market for lower income households to find more
Households by Income and Tenure
affordable rental units. 1,200
1,000
• While this data shows that most households are spending below
Number of Households
their means (below 30% of income), it also indicates that many 800
lower-income households (which are less competitive in the rental 600 1,050
market) must spend more to secure housing. 145
395
400
55 215
• Adding more choices at appropriate price points will draw 200
290
415
240 190
households toward housing that fits their needs and budget and - 90
0-30% AMI 31-50% AMI 51-80% AMI 81-100% AMI >100% AMI
can decrease cost burden among renters across the market.
Household Income
Renters Owners
Source: US Census Bureau CHAS
21Unit Types
• A variety of unit types is important to provide choices in the housing market for existing and future residents.
• 60% of rental units within the City are two bedroom units.
• Most rental units are in 10-19 unit buildings, and 1-unit, duplexes are the second most common rental unit type.
Rental Units by Bedroom Rental Units by Type in New Richmond
2% 1% 0% 10%
4%
13%
35% 35%
15%
11%
60% 16%
1-unit, Detached 1-unit, Attached 2 units
No Bedroom 1 Bedroom 2 Bedrooms 3 or More Bedrooms 3 or 4 units 5 to 9 units 10 to 19 units
Mobile home
Source: US Census Bureau ACS
Source: US Census Bureau ACS
22Median Rent by Bedroom
$1,400 $1,280
Cost $1,200
$1,000 $887
• Among peer communities, New Richmond generally sees lower rents for
Median Rent
$800
units of all sizes. $609
$600
• The majority of rental units in the City are in the price range of $500 to $999 $400
per month according to American Community Survey estimates. These $200
estimates are likely low as they do not reflect the 100+ new rental units
$-
constructed in the past several years. No Bedroom 1 Bedroom 2 Bedrooms 3 Bedrooms 4 Bedrooms 5 or More
Bedrooms
Number of Bedrooms
• Recent new rentals that could affect rising rent prices in the city are Foster
Source: US Census Bureau ACS
Place, Mill City Flats, Dakota Meadows, and West Fifth Townhomes. Current Unit Rents
1,000 918
$1,200 900
$1,054
$962 $960 800
$1,000
700
$835
$800 $717 600
Median Rent
Units
500
406
$600 400
300 209
$400
200
100 64
$200
- - -
-
$- Less than $500 to $1,000 to $1,500 to $2,000 to $2,500 to $3,000 or
City of New St Croix County Village of Somerset Town of Richmond Town of Stanton $500 $999 $1,499 $1,999 $2,499 $2,999 more
Richmond
Rent
Source: US Census Bureau ACS Source: US Census Bureau ACS
23Vacancy Vacancy Rate of New Richmond and Surrounding Communities
• Vacancy rates are an important measure of balance
between housing demand and supply. 12.0%
10.6%
• New Richmond’s vacancy rate estimated at 3.6%, a 10.0%
typically healthy rental vacancy rate is between 5-7%.
8.0%
• The current vacancy rate indicates there is more
Vacancy Rate
6.0%
demand than supply and it is harder for renters to find 6.0%
5.0%
units and easier for landlords to raise rents.
4.0% 3.6%
• There is opportunity for more rental unit development
in the City. 2.0%
1.8%
• The short supply of all types of rental units was 0.0%
0.0%
confirmed in interviews with local housing experts. In City of New St Croix County Town of Stanton Town of Richmond Town of Star Town of Erin
Richmond Prairie Prairie
particular, units that are affordable (under $1,200 per
Community
month according to stakeholder interviews) and short Source: US Census Bureau ACS
term rental units are most needed.
24Age of Rental Stock
1939 or earlier 51
1940 to 1959 131 • 65.5% of the rental units in New Richmond were built
between 1980 and 2009.
1960 to 1979 333
• Older rental units in the City are primarily located near and
Year Built
1980 to 1999 644 along Main street.
2000 to 2009 338 • ACS data for 2014-2019 is an undercount of what was
developed during this time. Based on City permit data, 140
2010 to 2013 49 rental units were built between 2014 and 2021.
2014 to 2019 24
- 100 200 300 400 500 600 700
Number of Units Built
Source: US Census Bureau ACS
25New/Recent Rental Projects
• The following rental projects have been or are in
the process of being completed.
• Dakota Meadows (50 units)
• Foster Place (72 units)
• Mill City Flats (88 units)
• The following upcoming projects are anticipated
to provide additional market rate rental units in
New Richmond:
• W. 5th Townhomes (48 units)
• Willow Countryside Villas (16 units)
• Since these projects are recent or pending,
these units are not included in any US Census or
HUD data.
26Typical 1-Bedroom Rental Construction & Land Cost = 130,000
Development Scenario Equity to Cost Ratio 20% Loan to Cost Ratio 80%
Required Equity 26,000 Mortgage Loan 104,000
• There is a need for new rental construction in
Annual Re-Tax 10% Mortgage Interest Rate 4%
the City that serves both low- and high-income
Distribution Rate
earners.
Cash Payments for $2,600 Debt Service $6,000
• High income earning households can afford Equity
rents associated with higher cost of new-
Net Operating Income $8,600
construction and developers can market
increased costs through increased amenities. Operating Expenses $2,600
• Lower income households largely cannot afford Real Estate Taxes (2020 Effective Tax Rate of .0187) $2,800
new construction (see example on right, and Replacement Reserve $300
highlight of households that can’t afford that
Effective Gross Value $14,300
cost, below).
Vacancy (5% required assumption) $715
• To ensure expanded opportunities and units
that meet the needs of all residents, subsidies Gross Potential Income $15,015
are likely needed to offset construction costs to Breakeven Annual Rent $15,015
make units more affordable. Breakeven Monthly Rent $1,250
Maximum Monthly Cost for
Family of 4 (100% Median
Income Limit Area Income) Income Limit Category Persons in Family
1 2 3 4 5 6 7 8
New Richmond $1,503 Extremely Low Income (30% AMI) $ 316 $ 361 $ 407 $ 451 $ 498 $ 571 $ 644 $ 717
Very Low Income (50% AMI) $ 527 $ 602 $ 677 $ 752 $ 812 $ 873 $ 932 $ 993
Low Income (80% AMI) $ 806 $ 922 $ 1,036 $ 1,151 $ 1,244 $ 1,336 $ 1,428 $ 1,520
27Ownership Market
28Owner Occupied
Units
• The majority of residential
parcels in the City, 56 percent,
are owner-occupied.
• New home development
continues to occur in New
Richmond. The City is a place of
high interest for developers
due to its proximity to the Twin
Cities, lower building costs
compared to Minnesota, and
the willingness of City staff and
officials to welcome new
residential development.
29Affordability
Maximum Purchase for Family of
4 Without Paying More than 30%
of Gross Income Toward Housing
Income Limit Area (100% Median Income) Income Limit Category Persons in Family
1 2 3 4 5 6 7 8
Extremely Low Income (30% AMI) $ 25,000 $ 33,098 $ 42,742 $ 50,952 $ 60,671 $ 75,663 $ 89,086 $ 102,562
New Richmond $260,272 Very Low Income (50% AMI) $ 66,513 $ 82,073 $ 94,694 $ 109,628 $ 121,755 $ 133,932 $ 145,759 $ 157,887
Low Income (80% AMI) $ 72,613 $ 143,654 $ 166,656 $ 189,658 $ 204,692 $ 231,753 $ 245,183 $ 263,625
Median Income (100% AMI) $ 110,780 $ 189,834 $ 218,588 $ 247,338 $ 270,641 $ 293,693 $ 316,745 $ 339,797
• The table above shows the general purchase price a household could afford at Income Levels for Homeowners in New Richmond
various income levels, by household size, without being cost burdened (more 3%
8%
than 30% of gross income paid towards housing). Most of these price points are a
challenge for developers to build at due to increasing costs of labor and supplies.
• Slightly more than half (56%) of the City’s owner-occupied households earn an 21%
income that is 100% or more of the area median income. 56%
12%
0-30% AMI 31-50% AMI 51-80% AMI 81-100% AMI >100% AMI
Source: US Census Bureau CHAS
30Housing Stress
• When a housing market is “tight” or competitive, this drives up costs for consumers and makes it harder for households without down
payment savings.
• Rental market shows higher levels of cost burden, the ownership housing market experiences cost burden less frequently. Homeownership has
barriers to entry, so people must qualify to buy by meeting underwriting standards. These standards serve to reduce risk to borrowers and
lenders by ensuring adequate income, increased access to credit, etc.
Cost Burden Owner Occupied
20.0%
17.9%
18.0% 16.6%
Renter Households Owner Households 16.0%
14.0%
11.4%
Percentage
12.0% 11.2%
10.0%
8.0% 6.7%
6.0% 5.2%
4.0%
2.0%
0.0%
City of New Richmond Village of Somerset
Cost Burden 50% Cost Burden 50% Community
Source: US Census Bureau ACS Source: US Census Bureau ACS
% Cost Burdened % Severely Cost Burdened Total All Cost Burden
Source: US Census Bureau ACS
31Ownership Unit Cost Burden
Owner Stress by Income >100% AMI 1,050 45 -
81-100% AMI 210 15 -
Household Income
51-80% AMI 340 60 30
• In New Richmond, a majority of homeowners are not cost burdened.
31-50% AMI 70 75 20
• Ownership unit mismatch shows homes available in the market that
are generally oversupplied in the lower cost market, likely a 100% AMI 15 1,095 -1,080
32Homeownership Unit Consumption
• In New Richmond, many homeowners are owning homes that are considered affordable when compared to their incomes.
• It is a challenge for lower income families who are trying to purchase a home, as higher-income families are able to offer more money, better
terms, and use standard mortgage types (not FHA).
• There is a very low percentage (about 9%) of homeowners in the City that are 0-50% AMI, even though most of the ownership units are
affordable at that income level (see the prior page). This reflects the barriers to entry into the ownership market for lower-income households.
Owner Occupied Unit Consumption by Income Households by Tenure and Income
Homeownership Unit Affordability
Affordable at >100% AMI 100% 1,200
Number of Households
1,000
Affordable at 100% AMI 800
100%
600 1,050
145 395
400
Affordable at 80% AMI 8% 8% 24% 24% 36% 55 215
200 415
290 240 190
- 90
Affordable at 50% AMI 9% 11% 25% 10% 45% 0-30% AMI 31-50% 51-80% 81-100% >100% AMI
AMI AMI AMI
0% 10% 20% 30% 40% 50% 60% 70% 80% 90% 100% Household Income
Percentage of Households
Renters Owners
100% AMI Source: US Census Bureau CHAS
Source: US Census Bureau CHAS
33Housing Cost $300,000
$250,000
• The median home value in New Richmond is low
compared to most of the surrounding $200,000
communities. The current estimate for median
Median Home Value
home value is $180,100. This data is likely lower
than reality as it does not capture all of the $150,000
recent owner-occupied units (since 2019) that
have been added to the market (priced at $350k-
$400k based on interviews). $100,000
• This relatively lower cost of housing is a
reflection of a majority of the housing stock $50,000
being built prior to the year 2000.
• The price of housing has risen by 28% in the past $-
2010 2011 2012 2013 2014 2015 2016 2017 2018 2019
6 years, which is on trend with surrounding
Community
communities.
City of New Richmond Village of Somerset Town of Stanton Town of Star Prarie
Town of Richmond Town of Erin Prarie St Croix County
Source: US Census Bureau ACS
34Unit Types
1%
1%
15%
• 83% of owner-occupied units within the City are detached
single family homes.
• The City also has a healthy supply of owner-occupied 1-unit
attached (townhomes), at 15% of the owner market. These
units are typically under a condo form of ownership.
• Condos, as an ownership structure within the market, have
never been prevalent in the City. Condos offer an opportunity
for more dense redevelopment in areas of the downtown and
can provide a more affordable option for home ownership.
83%
1-unit, Detached 1-unit, Attached 2 units 3 or 4 units
5 to 9 units 10 to 19 units 20 or more units Mobile home
Source: US Census Bureau ACS
35Ownership Unit Size
Number of Bedrooms
• There are no owner-occupied houses with only 1
bedroom in the City of New Richmond. This is consistent
with St. Croix County and surrounding communities.
38.7%
• Homes with fewer bedrooms are generally more
affordable both within existing and new-construction
markets. Ownership units with one bedroom can fill a
niche in the market, accommodating households who 61.3%
wish to downsize as they age and households who may
be first-time homebuyers.
No bedroom 1 bedroom 2 or 3 bedrooms 4 or more bedrooms
Source: US Census Bureau ACS
36Housing Age of Owner-Occupied Housing
1939 or earlier 191
• Approximately 47.5% of owner-occupied homes were built between
1940 to 1959 346
2000-2019.
1960 to 1979 229
Year Built
1980 to 1999
• The City does also have a significant supply of homes built prior to
74
1980 (47.7%). Older housing units tend to be more affordable and offer
2000 to 2009 612 opportunity for households with lower incomes and entry-level
2010 to 2013 107 homebuyers.
2014 or later 42
- 100 200 300 400 500 600 700
Number of Units Built
Source: US Census Bureau ACS
37New/Recent Ownership Projects
• The following owner-occupied projects have been or are in the • The following upcoming project is anticipated to provide additional
process of being completed: owner-occupied units in New Richmond:
• Meadow Crossing (94 single family and twin homes) • Hormel Property (200 acres to be annexed into the City)
• Powers Property (Up to 150 single family and twin homes)
• Fox Run 2nd Addition (10 buildable lots) • Since these projects are recent or pending, these units are not
• Fox Run 3 Addition (Up to 25 single family and twin homes)
rd included in any US Census or HUD data.
• Fox Run 4th Addition (Up to 29 single family and twin homes)
• Golf Side Villas (12 lots, 8 buildable)
• Golf View Estates (41 total lots, 6 buildable)
• Willow River Bluffs (86 total lots, 21 buildable)
• Lakeview Estates (50 total lots, 6 buildable)
• North Shore Addition (29 total lots, 4 buildable lots)
• Evergreen Valley 3rd Addition (97 total lots and 4 buildable)
• James Place (42 single family)
• Whispering Prairie (103 total lots and 5 buildable)
• Richmond Prairie (46 total lots and 2 buildable)
• Richmond Heights (46 single family)
• Paperjack Townhome Community (19 total lots and 4
buildable)
• Woodland Creek (163 total lots, and 23 buildable)
• Willow Countryside Villas (16 total lots and 12 buildable)
38Market Trends, Detached Single Family Homes
$300,000 332 350
• Over the past six years the median sale price for detached 304 313
285
single family homes has increased an estimated 47% (from $250,000 279 300
247
$180,900 to $280,000). This is in primarily due to the tight 250
Average Sale Price
Total Home Sales
$200,000
supply of housing stock.
200
$150,000
• The median home sale prices between 2015 and 2020 have 150
been below what is considered affordable for the median $100,000
100
income earning household in the City. Based on interviews
$50,000
with local housing experts there need to be more owner- 50
occupied units priced between $250,000-$300,000. $- -
2015 2016 2017 2018 2019 2020*
Year
• The total number of homes sales has increased by 37% since
2015 (from 247 to 332), which is partially due to an increase in City of New Richmond Home Sales
single-family home development within the City. City of New Richmond Median Sale Price
City Median Household Income Affordability Threshold
Source: Multiple Listing Service
39Market Trends, Condos and Duplex
80 $300,000
73
• Duplex and Condo homes make up a smaller number of home
70
$250,000 sales in New Richmond which makes sense considering this
60
60 unit type only comprises 17% of the City’s owner-occupied
$200,000 housing stock.
Median Sale Price
48
Total Home Sales
50
41
39
40 35 $150,000 • Total sales have increased from 2015-2020 (from 48 to 73).
This increase is possibly due to the affordability that these
30
$100,000 unit types offer first time buyers.
20
$50,000 • The gap between median sale price for these units and the
10
median income affordability threshold has started to narrow.
- $- This is most likely from the increase in demand for attached
2015 2016 2017 2018 2019 2020*
owner occupied housing.
Year
City of New Richmond Home Sales
City of New Richmond Median Sale Price
City Median Household Income Affordability Threshold
Source: Multiple Listing Service
40Housing for Special Populations
41ALICE Households
• ALICE is an acronym for Asset Limited, Income Constrained, Employed — households that earn more than the Federal Poverty Level, but less than the
basic cost of living for the county (the ALICE Threshold). While conditions have improved for some households, many continue to struggle, especially
as wages fail to keep pace with the cost of household essentials including but not limited to housing.
• Below is the information for St. Croix county, about 8.7% of households in the County were considered ALICE household in 2018.
• The number of ALICE households has increased from 2010, while the number of households at a household income at or below the federal poverty
line has decreased.
St. Croix County Types of Households Struggling
St. Croix County ALICE and Poverty Households Change Over Time
100%
10,000
9,000
80%
Percent of Total Households
8,000
Number of Households
7,000 60%
6,000
5,000 40%
4,000
3,000 20%
2,000
1,000 0
Single or Cohabitating Families With Children 65 and Over Total Households
0
2010 2012 2014 2016 2018 ALICE Households Households Below Federal Poverty Line Above ALICE Threshold
ALICE Households Households Below Federal Poverty Line Single Family Senior
Source: Alice Thresholds and ACS Source: Alice Thresholds and ACS
42Aging Populations
• Senior households are anticipated to have the largest percentage of growth through 2040.
• As seen in the lower right figure, the majority of seniors are homeowners. Some senior will continue to live in their own home with
virtually no services, while some will look to townhomes and apartments that offer the ability to “downsize”, specialized housing with
limited services, and different types of assisted living facilities.
• Often senior households will pay up to 50% of their income for market rate senior housing and up to 90% for specialized living.
City of New Richmond Senior Household Income City of New Richmond Household by Age and Tenure
180
155 Householder Under 35 Years 82 68
160 145
140 125 Householder 35 to 44 years 118 104
120
Households
100 95 Householder 45 to 54 years 186 241
Age Cohort
100
80 70 Householder 55 to 64 years 652 202
60 Householder 65 to 74 years 473 236
40 30
20 Householder 75 to 84 years 556 204
-
- Householder 85 years and over 334 565
0-30% AMI 31-50% AMI 51-80% AMI 81-100% AMI
Income Level 0% 10% 20% 30% 40% 50% 60% 70% 80% 90% 100%
Percentage of Households
Owner Renter
Source: US Census Bureau CHAS 2017
Owner Occupied Renter Occupied
Source: US Census Bureau ACS 2019
43Disabled Populations and Accessibility
• Those with an ambulatory, self-care, or independent
• New market rate and workforce housing should contain set-aside units that
living difficulty are most likely to require specialized
meet universal design standards.
forms of housing.
• Current trends show that there are residents across all income levels that have
• The percentage of the population by age, that
a disability, but many would qualify for subsidized housing (80% AMI Ambulatory Self-Care Difficulty Independent Living Difficulty
Source: US Census Bureau CHAS 2017 Source: US Census Bureau CHAS 2017
44Other Forces Impacting the Market
45Taxes
• New Richmond’s mill rate is higher than neighboring townships but is consistent with surrounding cities and villages.
• It is generally expected that the City would have higher tax rates than towns because they maintain more infrastructure and offer more
services per capita.
• New residential growth expands the City’s tax base and spreads costs between more households.
• There will be a city-wide property re-assessment completed in 2021 which will impact taxes paid by those living in the community.
• Interviews with local housing experts noted that property taxes are lower in New Richmond (Wisconsin) than they are in Minnesota.
Anecdotally, is likely that lower property taxes are something drawing people into the City from the Twin Cities.
Municipality 2020 Mill Rate Taxes on 180,100 Home Difference vs New Richmond 2020 Population
City of New Richmond 0.0187 $3,367 10,079
Village of Somerset 0.01937 $3,488 $122 3,019
Town of Richmond 0.01373 $2,473 $(894) 4,074
Town of Star Prairie 0.01429 $2,573 $(793) 3,733
Town of Erin Prairie 0.01499 $2,699 $(667) 673
City of Hudson 0.01752 $3,155 $(213) 13,795
City of River Falls 0.01838 $3,310 $(58) 15,638
City of Rice Lake 0.02399 $4,321 $953 9,040
46Improvement Value Ratio
• This map helps identify areas that are more
likely to benefit from redevelopment or
rehabilitation: residential areas with high land
value and low improvement value.
• Areas with the lowest improvement ratios (the
dark purple and light purple) are scattered
throughout the City.
47Supply of Available Lots
• Aside from redevelopment there are
opportunities for additional housing on vacant
lots within city limit.
• Vacant residential parcels are represented in
brown on the map to the right.
• Most of the available residential acreage is in
large areas that could be subdivided (231 acres
total). This acreage includes some land that may
not be buildable due to wetlands, floodplain,
size, shape, etc.
• There are currently 398 buildable lots within the
City.
48Preservation - Z1
Sub-Urban - Z2
Use/Corridor - Z3
Traditional
Neighborhood - Z5
Multi-
General Urban -
Z4
Central Business -
Z6
Agriculture
Regulations
Dwelling Type Z1 Z2 Z3 Z4 Z5 Z6
• The City’s ordinance has six zones that allow for various types of
Single-family A A SP A A A
residential development. All of them allow single family development
by right: Min Lot Size 5 Acres
o Z1- Agriculture Preservation Min Lot Width (in FT) 80 80 80 50
o Z2- Sub-Urban Min Front Yard Setback (in FT) 50 25 25 25 25
o Z3- Multi-Use/Corridor Maximum Lot Coverage 30% 40% 30% 40% 40% 100%
o Z4- General Urban Two Family Dwelling A A A A
o Z5- Traditional Neighborhood Min Lot Size (in SF)
o Z6- General Business Min Lot Width (in FT) 40 40 40 40
Min Front Yard Setback (in FT) 25 25 25 25
• Townhomes are allowed in Z2-Z6 and multiple family dwellings are Maximum Lot Coverage 40% 30% 40% 40% 100%
allowed in Z3-Z6, the only requirement being site plan approval by Townhouse SP SP SP SP SP
Council.
Min Lot Size (in SF) 2,500
• There is little regulation on minimum lot size in all districts, which Min Lot Width (in FT) 40 40 40 40 16
encourages development on smaller lots. However there are Min Front Yard Setback (in FT) 25 25 25 25 20
requirements on minimum lot width and lot coverage in place of Min Dwelling Unit Separation (in FT) 40% 30% 40% 40% 100%
minimum lot size requirements in New Richmond. Mobile Home
Multiple Family Dwelling SP SP SP SP
• Interviews indicated the development process is overall good in New
Community Living (1-8) A A A A A A
Richmond, thought it was suggested the process could be further
Community Living (9-15) C C C C C C
simplified which would reduce cost to developers. Any reduction in
Nursing Home C
process/cost ultimately gets passed on to renters or owners.
SP=Site Plan Application Required A= Allowed through building permit process C= Conditional Use Permit Required
49Zoning
• Due to the flexibility of the City’s zoning
code, a variety of residential unit types
are allowed throughout the City. This
facilitates development of a variety of
housing types to meet market demand.
• Only larger community living facilities
and nursing homes are subject
conditional use permits. This is
something the City could revisit as the
population continues to age.
50Impact Fees
• Communities charge impact fees when approving new development to
pay for infrastructure that must be built to accommodate new
development.
New Richmond Impact Fee ($4,400) Breakdown
• New Richmond currently changes an impact fee of $4,400 per dwelling
unit for residential development. A breakdown of where this fee goes is
shown to the right.
• One interviewee noted that the City’s impact fees were high, especially
compared to the City of Eau Claire, which does not charge impact fees.
Other nearby communities charge the following impact fees:
• City of River Falls - $5,450 per dwelling unit
• City of Hudson - $2,422 per dwelling unit (water connection fee
not listed)
• Village of Roberts - $5,050 per dwelling unit
• The City will be undergoing an impact fee study in 2022. Even if findings
show fees should be raised overall, the City could consider reducing
impact fees for affordable units only to encourage this type of
development.
51Livability
• Good Schools: New Richmond’s School District is
attractive to potential residents. The District is
expecting continued growth due to households leaving
the Twin Cities.
• Proximity to Twin Cities: Households moving from the
Twin Cities to New Richmond come because of the
quality of life offered while still being able to easily
drive to the Twin Cities.
• Opportunity for Recreation: The City has a robust park
and recreation system with 28 parks (developed and
undeveloped) and 19.5 miles of paved trails.
• Lack of Broadband: Lack of reliable internet came up in
many of the housing expert interviews as a critical
need and a factor that could discourage people and
businesses from coming to the community.
New Richmond High School
• Safety: Interviewees mentioned the City is perceived as
safe, which is a draw to potential residents.
52Housing Gaps and Opportunities
53Owner Occupied Housing
Units Needed-Conservative
• The conservative household growth estimate uses DOA’s
projected growth rate for the City through 2030 (19%)
plus an additional 50% increase due to additional
unanticipated housing demand created by the bridge.
• These demand projections could be outpaced based on
recent history. The newly constructed bridge has added
an element of uncertainty which has resulted in more
growth than had previously been projected by DOA for
the City.
• The 482 owner-occupied units that are projected to be
needed in the local housing market over the next 10
years should be in the following sale ranges (2021
dollars):
• 111 units priced $35,000*-$232,000
• 62 units priced $190,000-$294,000
• 232 units priced $228,000-$408,000
• 77 units priced greater than $408,000
*Home ownership at this price point is challenging and may not be
possible without significant subsidy.
54Owner Occupied Housing
Units Needed-High
• This high estimate assumes a 50% growth rate in
households between now and 2030. This growth rate
assumes the construction rate the City has experienced
since the opening of the bridge will continue.
• The City should annually re-evaluate construction
trends to determine whether the high growth rate
experienced right after the construction of the bridge
will continue, or whether that was an anomaly.
• The 911 owner-occupied units that are projected to be
needed in the local housing market over the next 10
years should be in the following sale ranges (2021
dollars):
• 210 units priced $35,000*-$232,000
• 116 units priced $190,000-$294,000
• 439 units priced $228,000-$408,000
• 146 units priced greater than $408,000
*Home ownership at this price point is challenging and may not be
possible without significant subsidy.
55Rental Units Needed-
Conservative
• The conservative household growth estimate uses
DOA’s projected growth rate for the City through
2030 (19%) plus an additional 50% increase due to
additional unanticipated housing demand created
by the bridge.
• These demand projections could be outpaced
based on recent history. The newly constructed
bridge has added an element of uncertainty which
has resulted in more growth than had previously
been projected by DOA for the City.
• The 359 rental units that are projected to be
needed in the local housing market over the next
10 years should be in the following price ranges
(2021 dollars):
• 102 units priced $300-$600/month
• 127 units priced $500-$900/month
• 60 units priced $800-$1,300/month
• 70 units priced $1,000-$2,000/month
56Rental Units Needed-High
• This high estimate assumes a 50% growth rate in
households between now and 2030. This growth
rate assumes the construction rate the City has
experienced since the opening of the bridge will
continue.
• The City should annually re-evaluate construction
trends to determine whether the high growth rate
experienced right after the construction of the
bridge will continue, or whether that was an
anomaly.
• The 676 rental units that are projected to be
needed in the local housing market over the next
10 years should be in the following price ranges
(2021 dollars) :
• 193 units priced $300-$600/month
• 238 units priced $500-$900/month
• 113 units priced $800-$1,300/month
• 132 units priced $1,000-$2,000/month
57Senior Units Needed-Assisted Living
• The number of senior households is
projected to increase by 35% in New
Richmond by 2030. Planning for aging
populations is essential to the success of
the housing market in New Richmond.
• As seniors age some will need assistance
with daily living (ADL) and need to move
out of their current homes.
• It is projected that by 2030 there will be
a need for 41 additional assisted living
units in the City.
58Senior Units Needed-Independent Living
• The number of senior households is
projected to increase by 35% in New
Richmond by 2030. Planning for aging
populations is essential to the success of
the housing market in New Richmond.
• Some seniors will not need assistance
with daily living, but will still desire to
move and look for housing dedicated to
seniors.
• It is projected that by 2030 there will be
a need for 142 subsidized and 18 market
rate senior units. This calculation does
not include existing independent senior
living units as that count is not
available.
59Strategies for Implementation
60Priorities
1. Detached Single Family Housing – Continued 3. Housing for Seniors – Independent and assisted
development of detached, single-family living units for the growing senior population.
housing, especially at the $250,000-$300,000 Some of these units should be targeted
price point. downtown, within walking distance of services
2. Missing Middle Housing – Varied housing forms and opportunities for socialization.
with 2-16 attached units, either rental or condo, 4. Broadband – Ensure all residential and
addressing affordability, senior accessibility, business/commercial/industrial areas have
and neighborhood compatibility. reliable, fast internet.
61Recommendations
Naser Heights Twin Home Development in New Richmond
Capacity Building & Communication
Form A Housing Committee (Recommended First Action Item)
• A Housing Committee can be the driving force to implement this plan, including
providing oversight on the development and administration of funding programs,
supporting public outreach about the city’s housing needs and programs, and supporting
updates to this plan as the market shifts and outside funding programs change year by
year. The Committee should be advisory to the Community Development Authority and
can include representation from the City’s Housing Authority, developers, realtors,
landlords, non-profits, lenders, school district, technical college, and major employers.
Improve Staff & Developer Communications & Processes
• Development processes require collaboration with multiple City departments and
Source: https://www.opkansas.org/wp-content/uploads/2019/11/Cottage-court-
committees. Getting feedback and sign-off from each department in an efficient neighborhood-Langley-WA-web.jpg
manner is a challenge in many communities. A strategy to improve the process
would be to find ways to coordinate so everyone is looking at the application at the
same time and explore opportunities to hold joint approval meetings. Any
processes that can be consolidated or expedited would lower time (costs) to
developers, which ultimately lowers costs to owners and renters.
62Recommendations
Initiatives
City-Owned Properties New Richmond Future Land Use Map (2018)
• The City should identify and purchase properties that would be prime for
redevelopment, in particular downtown, as well as locations in existing
neighborhoods where smaller development projects (three-, four-plex, or
small multi-family) serve as a means to increase affordability. The
Community Development Authority is the recommended lead for this effort.
Ensure a Supply of Available Lots
• Currently the City has 231 acres of annexed land available for residential
development (both platted and unplatted). Because growth is occurring
rapidly, the City should annually assess whether sufficient land is
available for new residences so as not to hinder development that might
otherwise occur.
• The City should also continue to review its rate of household growth vs
development for indications that growth may be slowing and the first
several years after the bridge were installed were a unique phenomena.
• Continually review and update the Future Land Use Map in the City’s
Comprehensive Plan to help identify updated areas in the City’s
extraterritorial jurisdiction that are planned for future residential
growth.
63Recommendations
Initiatives Downtown New Richmond
Prioritize Expansion of Broadband
• Interviews with housing experts in the community revealed
broadband as a critical need in the community. With employers
increasingly offering flexibility for employees to work remotely, the
City will benefit if it can accommodate a remote workforce,
especially from households with jobs in the Twin Cities that require
only occasional commuting. The City should prioritize bringing
broadband to residential, business, and industrial areas of the City.
Prioritize Business Attraction
• Continue to prioritize business attraction to provide retail, dining,
and other commercial amenities residents are seeking.
• Form partnerships with local development corporations to execute
projects consistent with community objectives
Impact Fee Reduction for Affordable Housing Projects
• Through the interview process, it was mentioned that the City has high
impact fees in comparison to surrounding communities. After its
impact fee analysis in 2022, the City should consider lowering its fees
for affordable housing projects.
64Example Cottage Court
Recommendations
Initiatives
Identify Areas Suitable for Mixed Unit Types
• Small-lot and large-lot new development is needed, so are unit type mixes within new
subdivision development. Integrating a mix of housing types (attached/detached, 3-9
unit rental) within subdivisions creates more choices and options in the housing
market – ensuring households of all incomes can find suitable housing in most
neighborhoods. This enables more people to stay in a neighborhood over time as
their housing needs change. For this initiative the city should identify:
• Sites that transition to higher intensity areas
• Sites large enough to place higher density in the center with intensity of use Assist in Development of Community Land Trust
transitioning down to single family density with existing neighborhoods
• Community land trusts acquire land and maintain
• Potentially mixed use corridors
ownership of it permanently, to ensure long-term
• Predesignated sites in new subdivisions
housing affordability. With prospective homeowners,
Source: https://www.opkansas.org/wp-content/uploads/2019/11/Cottage-court-neighborhood-Langley-WA-
Actively Seek Cottage Court-Style Development web.jpg
land trusts enter into a long-term renewable lease.
• Cottage Court style development is an affordable ownership option. This style of When the homeowner sells, the family earns only a
development includes small groupings of housing around a shared public space and may portion of the increased property value. The remainder
be particularly attractive to seniors looking to downsize. Cottage Courts can be is held in trust, preserving affordability for future low-
implemented through PUD (Planning unit development) zoning to provide suitable (but to moderate-income families. The City should contact
modified) setbacks, density, parking arrangements, etc. the Madison Area Community Land Trust for best
• The City should identify areas where this could be possible, including both redevelopment practices in developing this type of organization.
and new neighborhood locations.
65You can also read