New Zealand Country Report - IEA Bioenergy Task 33
←
→
Page content transcription
If your browser does not render page correctly, please read the page content below
College of Engineering

Department of Chemical & Process Engineering
www.cape.canterbury.ac.nz                                              Christchurch
Tel: +64 3 364 2543, Fax: + 64 3 364 2063                              Private Bag 4800
Enquiries: shusheng.pang@canterbury.ac.nz                              New Zealand

                         New Zealand Country Report

                                IEA Bioenergy Task 33

                                        Shusheng Pang

                 University of Canterbury, Christchurch, New Zealand

                                       December 2012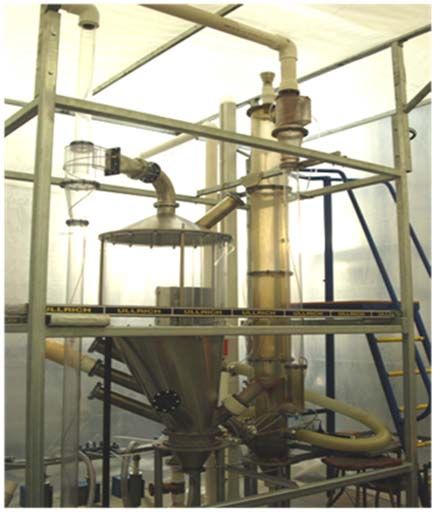
Table of Content

1. THE GOVERNMENT ENERGY STRATEGIES AND SCHEMES ..................................................... 1
   1.1. NEW ZEALAND ENERGY STRATEGY (NZES) 2011‐2021 ................................................................... 1
   1.2. NZ ENERGY EFFICIENCY AND CONSERVATION STRATEGY (NZEEZS) 2011‐2016 .................................. 1
   1.3. EMISSIONS TRADING SCHEME (ETS) 2008 (AMENDED IN 2009) ....................................................... 2
   1.4. BIOENERGY STRATEGY 2010........................................................................................................ 2
2. BIOMASS RESOURCE ESTIMATED ......................................................................................... 3
   2.1. COLLECTABLE FOREST HARVESTING RESIDUES .................................................................................. 4
   2.2. AVAILABLE WOOD PROCESSING RESIDUES........................................................................................ 5
   2.3. AVAILABLE AGRICULTURAL RESIDUES .............................................................................................. 5
3. RESEARCH & DEVELOPMENT INSTITUTES ............................................................................. 6
   3.1. UNIVERSITY OF CANTERBURY ....................................................................................................... 6
     3.1.1. BTSL research programme ............................................................................................ 7
     3.1.2. Achievement .................................................................................................................. 7
   3.2. CRL ENERGY LTD ....................................................................................................................... 9
4. DEMONSTRATION AND COMMERCIALISATION .................................................................... 9
   4.1. WAIARIKI WOOD WASTE GASIFICATION PLANT ................................................................................. 9
   4.2. FLUIDYNE GASIFICATION ........................................................................................................... 10
   4.3. POTENTIAL OPPORTUNITY .......................................................................................................... 10
   4.4. PAGE MACRAE GASIFIER............................................................................................................ 11
REFERENCES........................................................................................................................... 12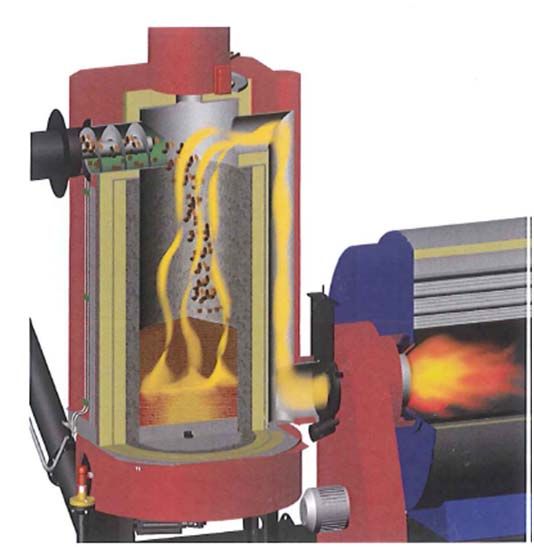
1. The Government Energy Strategies and Schemes
1.1. New Zealand Energy Strategy (NZES) 2011‐2021
The NZES (MED 2011) was released on 30 August 2011 to replace the 2007 version. It provides
the strategic direction for supply and use of energy to contribute to the growth of New Zealand
economy for the benefit and well-being of all New Zealanders.
The goal is to make the most of its abundant energy potential through the environmentally
responsible development and efficient use of the country’s diverse energy resources.
The aim is to achieve a 50% reduction in our greenhouse gas emissions from 1990 levels by
2050.
It proposes four priorities for achieving the goal:
a. Development of resources;
b. Securing and supply of affordable energy;
c. Efficient use;
d. Environment responsibility.
The country has abundant renewable energy resources including hydro, geothermal, wind
and biomass.
a. Government is committed to the target of 90% of our electricity generation from
renewable energy sources by 2025 (currently it is 79% mainly from hydro).
b. Government joined in the International Renewable Energy Agency, effective on 1 May
2011.
c. Government will continue to ensure market incentives and regulatory framework support
for further investment in appropriate renewable projects by removing unnecessary
regulatory barriers.
1.2. NZ Energy Efficiency and Conservation Strategy (NZEEZS) 2011‐2016
The NZEEZS (MED 2011) is a companion to the NZES. It aims to encourage energy consumers
to make wise decisions and choose efficient products. The energy efficiency target is to achieve
energy intensity improvement of 1.3% per annum through the following four key sectors.
Transport, a more energy efficient transport system, with a greater diversity of fuels and
renewable energy technologies: 29 PJ of savings by 2015 or 4% fuel saving improvement
from 2008 levels in GJ/kilometres travelled on land.
Business, enhanced business growth and competitiveness from energy productivity
investment: 21 PJ of savings by 2015 or 14% improvement in the commercial and industrial
sector energy intensity level (GJ/$1000 of GDP).
Homes, warm, dry and energy efficient homes with improved air quality to avoid ill-health
and lost productivity.
Products, greater business and consumer uptake of energy efficient products.
1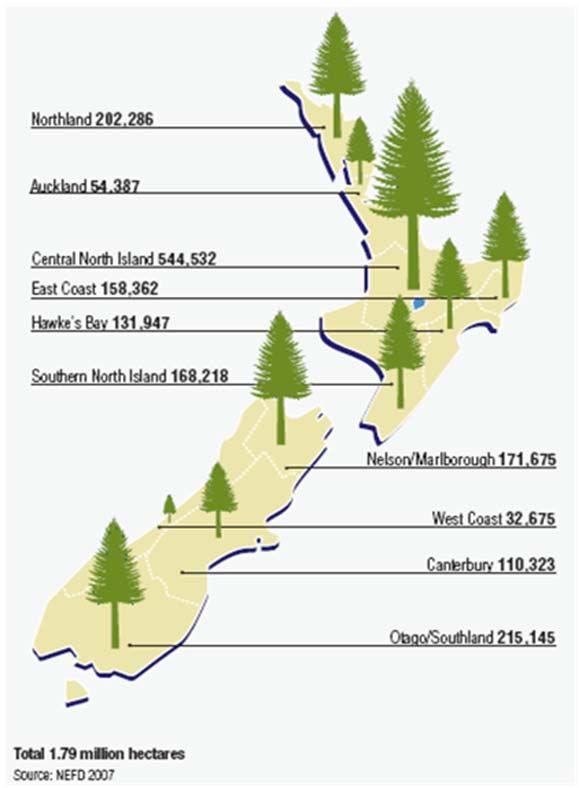
1.3. Emissions Trading Scheme (ETS) 2008 (amended in 2009)
The ETS (Climate Change Inf. 2011) is a way of meeting New Zealand’s international obligation
for climate change by putting a price on emission and providing an incentive to reduce emissions
and to encourage tree planting. The purpose is to reduce the amount of greenhouse gases emitted
in New Zealand by charging those who emit greenhouse gases while doing certain activities.
Reduction of emission can be achieved with investment in clean technology and renewable
power generation, and planting trees.
Emission price was set at NZ$25/unit with current price being half of that at NZ$12.50/unit
(one unit is equal to 1 tonne emission of CO2 equivalent). However, it is under review by an
ETS panel who recommended a current price of NZ$12.50/unit and increase to NZ$25/unit
gradually by 2015 as shown as the black line in Fig. 1.
Fig. 1. Transition and timing of carbon pricing
1.4. Bioenergy Strategy 2010
The Bioenergy Strategy (BANZ et al 2010) was launched by non-government organisations
including the Bioenergy Association of New Zealand (BANZ), the NZ Forest Owners
Association and five forestry related companies.
It aims to achieve economic growth and employment, and realise greater value from New
Zealand’s existing forestry resource and new energy crops by providing impetus to the
growing bio-economy.
Its target is to lift the national growth in bioenergy use by 2040 to 25% of consumer energy,
substantially above its current 8.5%.
This growth is driven by increasing domestic demand for heat from proven wood fuel and
biogas technologies, and for transport fuels in the form of biogas, biodiesel or bioethanol.
This includes a 60% increase in NZ’s use of biomass for heat.
2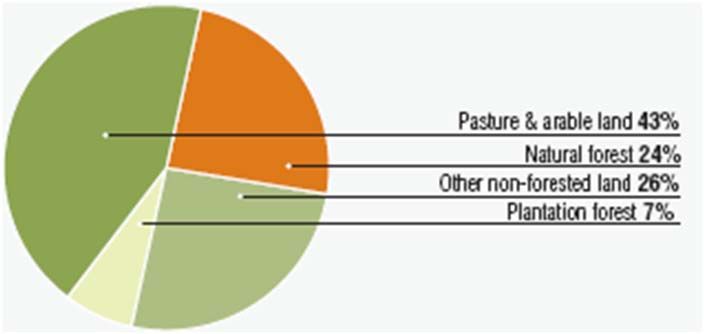
The above target was estimated based on the existing and potential biomass resources and
technologies, which will be implemented in three phases.
a. Foundation building phase (2010 - 2015).
b. Development phase (2015 - 2020).
c. Expansion phase (2020 - 2040).
2. Biomass resource estimated
New Zealand consists of North Island, South Island and a few small islands with a total land area
of 26.77 million ha (or 267,707 km²). The projected population is 4.4 million currently (Statistics
NZ et al 2010). The land is used mostly for forest, pasture and agriculture as shown in Fig. 2
(NZFOA et al 2010). This means there are plenty of forest harvesting residues, wood processing
residues and agricultural residues as biomass resource.
For the biomass resources, attention should be paid to the plantation forest of 1.79 million ha
(NZFOA et al 2010) and grain crop area of 0.13 million ha (Statistics NZ 2008). The
distributions of forest and grain crop plantation are illustrated respectively in Fig. 3 and Table 1.
Central North Island (CNI) stands out as the largest forest plantation area, accounting for 30% of
the national plantation forest, while Canterbury has the largest grain crop area, accounting for
65% of the national total. The distribution of biomass resources follows a similar pattern by
region to the plantations.
Fig. 2. NZ land use
3Table 1. NZ grain crop area by region in
2008 (Statistics NZ 2008)
Region ha
Northland 700
Auckland 1,100
Central North Island 8,300
East Coast 2,800
Hawke’s Bay 5,600
Southern North Island 11,400
Total North Island 29,900
Tasman/Nelson Not available
Marlborough 500
West Coast nil
Canterbury 81,000
Otago/Southland 14,400
Total South Island 96,500
NZ Total 126,400
Fig. 3. NZ plantation forest distribution map
(NZFAO et al 2010)
2.1. Collectable Forest harvesting residues
Forest harvesting residues are the residues at landing and cutovers on the forest floor which have
been estimated using proportion of the residues to harvested logs and the log production as well
as harvesting systems. Fig.4. shows the estimation and prediction of collectable forest residues
from 2007-2040 in the country and in the major forest area, Central North Island (CNI). The
national collectable forest residues range from 0.6 to 2.5 million odt p.a. (oven dry tonne) which
will reach their peak in the period of 2023 to 2027. CNI stands out to be the most abundant area
for the forest residues, supplying 0.3 to 0.7 million odt p.a. which accounts for approximately
40% of the national supply on average.
2.5
NZ total
Collectable forest residues,
2.0
Central North Island
million odt
1.5
1.0
0.5
0.0
2005 2010 2015 2020 2025 2030 2035 2040
Fig.4. Collectable forest harvesting residues in NZ
42.2. Available wood processing residues
Wood processing residues are estimated based on the proportion of processing residues and the
log processed in NZ. The wood processing residues include bark, sawdust, off cuts, shavings, log
cores in veneer based wood products, veneer breakages, sander dust, trim offs and black liquor.
Some good quality chips from sawmill offcuts are sold for pulp mills and medium density
fibreboard (MDF) manufactures. Most of the wood processing residues have been used on site
by the processing plants to fully or partially meet their heat and electricity demand. In some
cases like MDF plants, wood processing residues are purchased to supplement its energy supply.
The estimation and prediction of available wood processing residues are illustrated in Fig. 5. The
national available wood processing residues are fairly stable at around 0.6-0.7 million odt p.a.
from 2006 to 2021, reaching to a peak value of 1.3-1.7 million odt p.a. in 2023-2027 before
deceasing in the following years. Similarly to the supply of forest residues, CNI has the most of
the available wood processing residues, accounting for 57% of the national total on average.
They are at around 0.5 million odt p.a. with the peak value of 0.7 million odt p.a. in 2024. With
the significant amount of forest and processing residues, CNI is considered to be a suitable area
for plants of bioenergy or biomass to liquid fuels.
2.5
Whole NZ
Available wood processing residues,
2.0
Central North Island
1.5
million odt
1.0
0.5
0.0
2005 2010 2015 2020 2025 2030 2035 2040
Fig.5. Available wood processing residues in NZ
2.3. Available agricultural residues
Residues from agricultural sector were estimated from production of three primary grains in
New Zealand including wheat, barley and maize using Harvest Index. Residues from the grain
production are estimated based on mass ratio (1:1) of residues to grains harvested. The available
residues for collection are half of the total residues with 50% left on field for soil nutrients.
The production of wheat, barley and maize in New Zealand and in Canterbury area are estimated
to be fairly constant from 2010 at about 0.84 and 0.54 odt p.a., respectively. The collectable
agricultural crop residues are shown in Fig.6. Canterbury produces 64% of the national residues
at around 0.27 million odt p.a., which is considered to be the only region that has sufficient
agricultural residues to supplement a thermal chemical conversion plant.
50.6
NZ Total
Agricultural crop residues,
0.5 Canterbury
0.4
million odt
0.3
0.2
0.1
0.0
2000 2002 2004 2006 2008 2010 2012 2014 2016
Fig.6. Available agricultural residues in NZ
3. Research & Development Institutes
University of Canterbury (UOC) in Christchurch and CRL Energy Ltd in Lower Hutt are the
only two institutes in New Zealand to conduct research and development on thermal gasification.
UOC is focusing on biomass gasification and collaborating with CRL for co-gasification of
biomass and coal.
3.1. University of Canterbury
The author of this country report has established and been leading biomass gasification projects
since 2004 in the Department of Chemical and Process Engineering (CAPE). A 100 kW
(biomass in) dual fluidised bed (DFB) gasifier has been designed, constructed, commissioned
and improved in the past 7 years. Fig.7 shows a photo of the gasifier with controlling system.
The concept of the DFB gasifier was similar to the Güssing gasifier and the gasifier developed at
Vienna University of Technology (VUT). Collaboration has been established between UoC and
VUT. Modification of the gasifier has been conducted for testing of New Zealand feedstocks.
Fig. 7. 100 kW biomass gasifier in CAPE of UoC
63.1.1. BTSL research programme
The current research programme conducted at the University of Canterbury is Biomass to
Syngas and Liquid Fuel (BTSL) (Pang 2011). The programme is funded by the Ministry of
Business, Innovation and Employment (MBIE) for six years from 2008 to 2014. The programme
is to adapt and develop the most advanced thermo-chemical conversion technologies to suit the
NZ biomass resources. These technologies include using gasification to convert biomass into
hydrogen-rich syngas followed by Fischer-Tropsch (F-T) synthesis to produce biodiesel for
transport.
To suit the widely distributed and low density biomass, three options for syngas production are
under development including gasification of entire biomass, co-gasification of biomass with
coal, and densification of biomass by pyrolysis for gasification. The latter two processing routes
will supplement the low energy content biomass which would otherwise cost too much in
transport and storage on a commercial scale plant. In addition, the programme develops new
biomass resources of herbaceous species and short rotation crops. An integrated model is being
established to conduct feasibility studies from biomass to F-T biodiesel.
The programme is in collaboration with two research organisations (CRL Energy Ltd., and Plant
and Food Research Ltd.) and supported by industry partners. An advisory Board has been
established comprising invited bioenergy experts, representatives from the research collaborators
and industry partners to oversee the overall research direction. A research team in CAPE at the
UoC consists of five academic staff, three research associates, and eight postgraduate students
with support from a number of technicians.
3.1.2. Achievements
Various feedstocks have been tested on the CAPE gasifier including:
Wood pellets.
Blends of wood pellets and biosolids or dried sewage.
Blends of biomass and coal.
Modelling of gasification of biomass, and blended biomass and coal:
Modelling of steam gasification of single chars.
Modelling of gasification of biomass, and blended biomass and coal.
The models can predict gas composition, gasification reaction rate and temperature profiles.
The models have been validated and are being used for parameter sensitivity analysis.
Structure of the DFB gasifier has been modified for longer running time with the followings.
A straight extension on siphon return leg to reduce sand losses by bypassing.
Cyclone particle trap extension on producer gas cyclone to allow emptying of the ash trap on
the run.
In-bed feed system instead of over-bed.
Sand recharging lock hopper for topping up bed material on the run.
A new control system was installed with data logging, gasifier monitoring and operation control.
7Operation of the DFB gasifier has been optimised for right ratio of H2 to CO in FT fuel
synthesis, high C conversion efficiency and low tar content. Optimisation was conducted to
investigate the effects of the following parameters:
Steam/biomass ratio.
Gasification temperature.
Catalytic bed materials including olivine, dolomite, magnetite and calcite.
Gas contact time or BFB bed height.
Flexibility of the DFB gasifier has been demonstrated in producing producer gases with a wide
range ratio of H2 to CO from 0.9 to 4.4. This means that the DFB gasifier we developed can be
used for generation of energy using the producer gas of low ratio of H2 to CO, for generation of
Fischer-Tropsch syngas using the optimum H2 to CO ratio of 2, or for hydrogen production using
the high ratio of H2 to CO.
To improve the gasification technology, fundamental studies are also carried out with
mathematic modeling to simulate biomass gasification and co-gasification. A cold transparent
gasification model as shown in Fig. 8 has been designed and constructed for study of flow
hydrodynamics in the DFB gasifier and to develop design tools for scaling up of the DFB
gasifier.
Fig. 8. Cold and transparent DFB model in UoC
A tar analysis method using GC-FID has been successfully developed to enable in-house and
same day analysis. An internal standard calibration (with 5 different concentrations and 3
repeatable measurements) of 23 species has been conducted including 17 polycyclic aromatic
hydrocarbons, 2 Heterocyclic compounds and 4 Aromatic compounds.
Gas cleaning technology is also under development, using integrated scrubber and stripper
columns. Canola derived biodiesel is used as solvent in the system so that the tars in the producer
gas are firstly absorbed in the scrubber and then the tars in the loaded biodiesel is released in the
stripper to hot air. The hot air with tar can be sent to the combustion column of the gasifier for
recovery of the tar energy.
83.2. CRL Energy Ltd
CRL Energy Ltd. is a coal research institute located in Lower Hutt, Wellington. They have
constructed a 200 kWin fluidized bed (FB) gasifier for research on lignite gasification to produce
hydrogen since 2004. A gas clean-up line has been installed including a water-gas shift reactor, a
Palladium membrane and a high temperature and high pressure gas separation unit to get pure
hydrogen gas for fuel cell. The gasifier is now also used for co-gasification of coal and biomass.
Experiments have been conducted to investigate the effects of the ratio of biomass to coal and
gasification agents of air and oxygen. It was found that it is critical to prepare a uniform blend of
biomass and coal for feeding to the gasifier. A method has been developed to making coal-
biomass blend pellets (Levi 2011).
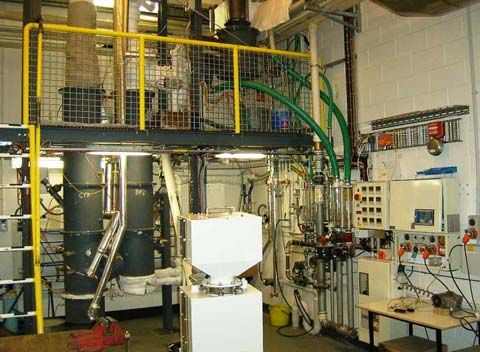
Currently, a 50 kW O2 blown FB gasifier is in construction which is integrated with water
electrolysis. The system is shown in Fig.9. It is planned to conduct co-gasification of up to 45%
biomass with coal (Levi 2011).
Fig.9. O2 blown FB gasification system in CRL
4. Demonstration and Commercialisation
4.1. Waiariki wood waste gasification plant
A 1.5MW Agder Biocom (Norway) gasifier has just been built and in commissioning at Waiariki
Institute of Technology (WIT), Rotorua, New Zealand. This project is jointly funded by New
Zealand government (EECA), Windsor ™ Engineering Group Ltd (turn-key project) and WIT
(owner). The gasification plant is served with the following functions:
As a training facility for wood processing students at the WIT.
As a R&D test facility to introduce gasifier technology to the wood processing industry in
NZ.
9 To replace the use of natural gas for the existing boiler to generate steam for two Windsor
timber drying kilns of 20 and 30 m³ timber capacity.
The gasifier shown in Fig.10 is characterised as:
Updraft type
Thermal output 1.2 MW with 78% net efficiency using wood fuel with MC of up to 35%.
Fuels: mixed shavings, hogging, sawdust and bark.
Particulate emissions not greater than 50mg/Nm³.
Fig.10. Working principle of the Waiariki gasifier
4.2. Fluidyne Gasification
Fluidyne Gasification Ltd. in Auckland is active overseas to develop and commercialize its
downdraft gasification process (100kWe-2MWe). The managing director, Doug Williams works
in retirement with commercial groups wishing to implement gasification, and selected student
mentoring assisting research into biomass carbons. A number of projects have been undertaken
overseas including (Williams 2011):
100kWe Andes Class gasifier development programme in California, to replace the use of
LPG to heat the CalForests Forestry Tree Nursery.
Gasifiers with larger gas outputs equivalent to 250-500 kWe are to be built with a change of
design concept containing the oxidizing bed parameters by 2013-15.
West Biofuels in Woodland, California.
The technology is currently licensed for sale in Australia through Flow Force Technologies
Biocharcoal utilisation:
o in potting mix for seedling trees.
o activated carbon.
4.3. Potential opportunity
A potential commercial opportunity has just been raised to treat the demolished timber from the
earthquake damaged buildings in Christchurch. Gasification of the timber is a promising way to
10utilise the waste for generation of heat or CHP for the inner city. It is in process to establish a
collaboration between the UoC and the Christchurch City Council.
4.4. Page Macrae gasifier
Page Macrae Engineering Ltd. has shut down its 2MWth updraft gasification plant for two years
as the user, CHH plywood mill, was closed down in Taronga, New Zealand.
11References
BANZ (Bioenergy Association of NZ), NZ Forest Owners Association, New Zealand Farm
Forestry Association, New Zealand Institute of Forestry, NZBIO, Forest Industry Contractors
Association, and Future Forests Research Ltd, 2010. New Zealand Bioenergy Strategy.
Accessed on 26 September 2011 at www.bioenergy.org.nz.
Climate Change Information 2011. Emissions Trading Scheme. Accessed on 3 November 2011
at www.climatechange.govt.nz .
EECA (Energy Efficiency and Conservation Authority) 2009. Biodiesel Grand Scheme 2009.
Accessed on 3 November 2011 at www.eeca.govt.nz/biodiesel-grants .
Levi, T. 2011. Thermo-chemical Conversion R&D Activities at CRL Energy including the
Gasification of Coal and Biomass for Purified Hydrogen Production. Presentation to the
Workshop of IEA Bioenergy Task 33, Gasification and Alternative Fuels Development. 15 April
2011, Christchurch, New Zealand. Accessed on 4 November 2011 at
www.woodtech.canterbury.ac.nz/resources.shtml .
MED (Ministry of Economic Development), 2011. New Zealand Energy Strategy 2011-2021,
Developing Our Energy Potential, and the New Zealand Energy Efficiency and Conservation
Strategy 2011-2016. MED on behalf of the New Zealand Government. Accessed on 19
September 2011 at www.med.govt.nz/energy-strategy .
NZFOA (NZ Forest Owners Association), Wood Processors Association of NZ, Ministry of
Agriculture and Forestry, 2010. NZ Forest Industry Figures and Facts 2008/2009. Accessed on 3
November 2011 at www.maf.govt.nz/portals/0/documents/forestry/statistics/forestry-stats/facts-
figures-08-09.pdf .
Pang, S. 2011. R&D Activities on Biomass Gasification for Syngas and Liquid Fuels at the
University of Canterbury. Presentation to the Workshop of IEA Bioenergy Task 33, Gasification
and Alternative Fuels Development. 15 April 2011, Christchurch, New Zealand. Accessed on 4
November 2011 at www.woodtech.canterbury.ac.nz/resources.shtml .
Statistics NZ, 2008. Agricultural production statistics –June 2008. Accessed December 2009 at
www.stats.govt.nz/browse_for_stats/industry_sectors/agriculture-horticulture-forestry/info-
releases.aspx .
Statistics NZ, New Zealand Registrar General’s Office, and Census and Statistics Department,
2010. The New Zealand Official Yearbook. David Bateman Ltd.
Williams, D. 2011. The Enigma of Gasification (Cinderella or Princess). Presentation to the
Workshop of IEA Bioenergy Task 33, Gasification and Alternative Fuels Development. 15 April
2011, Christchurch, New Zealand. Accessed on 4 November 2011 at
www.woodtech.canterbury.ac.nz/resources.shtml.
12You can also read