NEWS, 1950-1995 EVENT FLOW - HOW EVENTS SHAPED THE FLOW OF
←
→
Page content transcription
If your browser does not render page correctly, please read the page content below
E VENT F LOW - H OW E VENTS S HAPED THE F LOW OF THE
                                                                 N EWS , 1950-1995

                                                                  Melvin Wevers                                           Jan Kostkan
                                                              Department of History                          Center for Humanities Computing Aarhus
                                                    University of Amsterdam, the Netherlands                       Aarhus University, Denmark
arXiv:2109.08589v1 [cs.CY] 17 Sep 2021

                                                           melvin.wevers@uva.nl                                     jan.kostkan@cas.au.dk

                                                                                          Kristoffer L. Nielbo
                                                                                Center for Humanities Computing Aarhus
                                                                                      Aarhus University, Denmark
                                                                                            kln@cas.au.dk

                                                                                            September 20, 2021

                                                                                               A BSTRACT
                                                  This article relies on information-theoretic measures to examine how events impacted the news for
                                                  the period 1950-1995. Moreover, we present a method for event characterization in (unstructured)
                                                  textual sources, offering a taxonomy of events based on the different ways they impacted the flow of
                                                  news information. The results give us a better understanding of the relationship between events and
                                                  their impact on news sources with varying ideological backgrounds.

                                         1   Introduction
                                         Huddled around television sets or with ears clung to radio receivers, people all around the world heard Neil Armstrong
                                         utter the words: “[t]hat’s one small step for man; one giant leap for mankind.” This landmark event took place on July
                                         21, 1969. The date denotes the day on which the landing took people, even though one could convincingly argue that
                                         this day is part of a sequence of events leading up to this historic moment. In the days before the landing, newspapers
                                         published articles that counted down to the event and added commentary to the event, fueling anticipation in public
                                         discourse. On a longer time scale, the moon landing was part of a larger event: the space race, a competition between
                                         the United States and the Soviet Union for technological dominance. This distinction calls to mind Fernand Braudel’s
                                         famous description of events as “surface disturbances, crests of foam that the tides of history carry on their strong
                                         backs [1].”
                                         Events, such as the moon landing, are essential for our experience of history. We do not perceive time as is but through
                                         our experience of change in which events demarcate historical temporality. We rely on events to structure the world
                                         around us, as individuals and as societies [2]. William H. Sewell, Jr. describes an event as “an occurrence that is
                                         remarkable in some way - one that is widely noted and commented on by contemporaries [3].” In the book What is an
                                         Event?, Wagner-Pacifici uses 9/11 as a key example to theorize about the form and flow of events. She points out that
                                         historians have been preoccupied with bounding events in time and space, while she emphasizes “the ongoingness of
                                         events.” As an event unfolds, it disrupts the historical flow while the public tries to make sense of what is happening.
                                         Afterward, the public reflects on these events and sets out to integrate these events into a historical narrative. As events
                                         gain traction, they transform how we experience historical time.
                                         Understanding how historical temporality differs from natural temporality is crucial for “understanding how history has
                                         shaped the identity of modern society and culture.[4]” History is a process of both remembering and forgetting events
                                         and their relations. For contemporary, the moon landing was a singular event unlike any other, yet, canonized history
                                         knows more than one of these singular events. Was the moon really as impactful at the time, or has the wheel of time
                                         strengthen its position in our collective memories.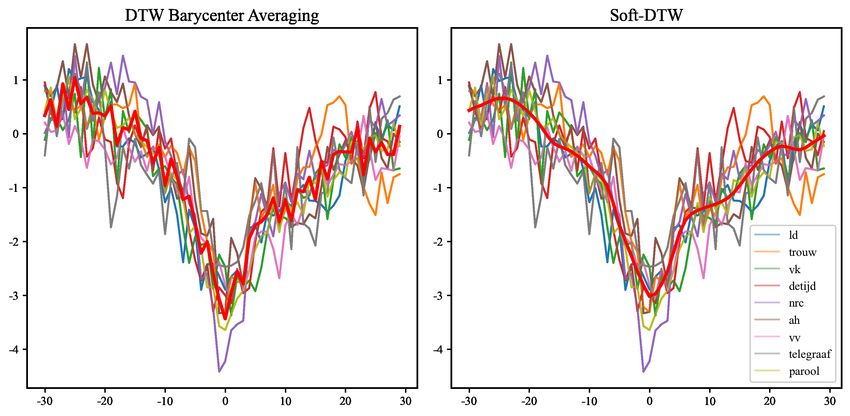
A PREPRINT - S EPTEMBER 20, 2021
As Wagner-Pacifici points out, events cannot always be tied to exact dates, even though historical events are often
connected to specific dates, such as the moon landing, the fall of the Berlin Wall, or winning a European soccer final.
Rather than only departing from specific dates in a top-down manner, can we also detect the unfolding of events and
their impact on the historical flow in a more data-driven, bottom-up manner? This paper sets out to answer this question
by analyzing the relationship between events and the historical flow, represented by the information presented on the
front pages of newspapers.
In our case, we model the ways events impacted language use. More specifically, we examine disruptions in the
information flow of news on front pages. For example, events can disrupt the flow of the news by decreasing the amount
of novel information presented on the front pages. In the run-up to an event, an increasing focus of the public’s eye
might be reflected in the increasing uniformity of discourse. Alternatively, an event could have a sudden impact while
retaining the public’s attention for an extended period. One could hypothesize different archetypical forms of events. In
what follows, we try to establish universal motifs, or event flows, from the data itself. The three central questions to this
paper are: (1) Do events impact historical flow, as represented by front pages in newspapers? (2) Can we cluster events
based on the way they impacted the flow of information? (3) Can we use these clusters to query for events? We call
these clusters, event flows, as they represent generalized manners in which events have impacted historical flow.1
A recent special forum in the journal History and Theory clearly describes the long-standing historiographical debate
on the concept of the event [5]. One of the main challenges in history is to combine theoretical work on events with
empirical studies of the temporality of events and their relationship to collective memory. The authors claim that
systemic analysis of the temporal nature of events, which could shed light on an event’s identity, are largely unexplored.
This paper offers a computational method that contributes to this effort to understand better how events and their
temporal structure have affected public discourse and, by extension, collective memory.
2 Related Work
Previous studies have shown that word usage in newspapers is sensitive to the dynamics of socio-cultural events [6, 7, 8].
Furthermore, the co-occurrence of words in newspaper reporting has been shown to capture thematic development
accurately [9], and, when modeled dynamically, is indicative of the evolution of cultural values and biases [7, 10, 11].
Methods from complexity science, such as Adaptive Fractal Analysis, have been used to identify distinct domains of
newspaper content based on temporal patterns in word use (e.g., advertisements and articles) [12] and to discriminate
between different classes of catastrophic events that display class-specific fractal signatures in, among other things,
word usage in newspapers [13].
Several studies have shown that measures of (relative) entropy can detect fundamental conceptual differences between
distinct periods [6, 14, 15], concurrent ideological movements (e.g. progressive and conservative politics) [16, 17], and
even, the development of ideational factors (e.g., creative expression) in writing with a serial structure [18, 19, 20].
More specifically, a set of methodologically related studies have applied windowed relative entropy to thematic text
representations to generate signals that capture information novelty as a reliable content difference from the past and
resonance as the degree to which future information conforms to said novelty [16, 18]. Two recent studies have found
that successful social media content shows a strong association between novelty and resonance [21], and that variation
in the novelty-resonance association can predict significant change points in historical data [22].
Our paper builds upon this work and will adapt the windowed relative entropy approach to a method that we call
Jump Entropy. This method allows us to examine how events have impacted the flow of information in and between
newspapers. We compare time series between newspapers and events, using Dynamic Time Warping Barycenter
Averaging (DBA) [23].
3 Data
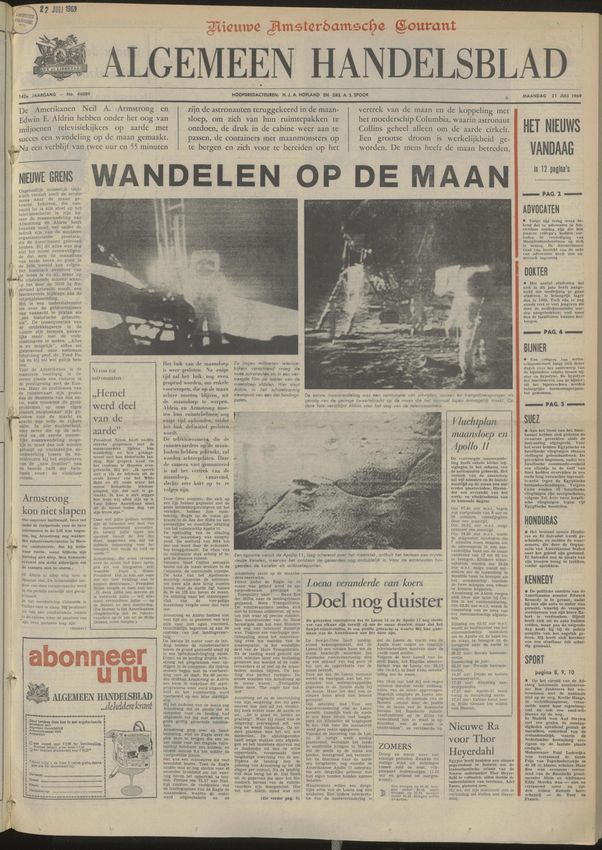
Front pages function as the pulse of the nation, displaying current and pressing events at specific time points. Figure 1,
for example, depicts the front page in Algemeen Handelsblad published on the day after the moon landing, which took
place on a Sunday. In big, bold letters, we read: “Walking on the Moon.”2 Multiple articles on this event feature on
this front page. In addition to the text, we see three images documenting this historic moment. For this study, we only
looked into the textual content—captured by optical character recognition (OCR)—and not at the images. The data
1
Data and code supporting this paper have been made available at https://doi.org/10.5281/zenodo.5509949 (data) and
https://github.com/melvinwevers/event-flow (code).
2
Translated from the Dutch phrase “Wandelen op de maan”.
2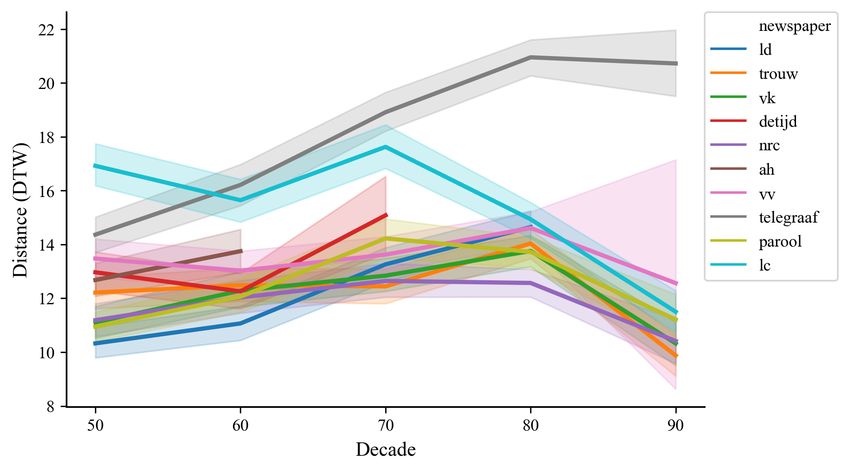
A PREPRINT - S EPTEMBER 20, 2021

                                 Figure 1: Frontpage of Algemeen Handelsblad on July 21, 1969

consists of the textual content represented on the front pages of ten Dutch national and regional newspapers published
between 1950 and 1995 (See Table 1 for details).3
For the data processing, which is not perfect due to flaws in the OCR technology, we removed stop words, punctuation,
digits, and words shorter than three and longer than seventeen characters. We lemmatized the text using the NLP toolkit
SpaCy.4 Next, we used Latent Dirichlet Allocation (LDA) with collapsed Gibbs sampling to train a topic model of the

   3
       It is important to note that not all newspapers run for the entire period.
   4
       https://spacy.io/

                                                                      3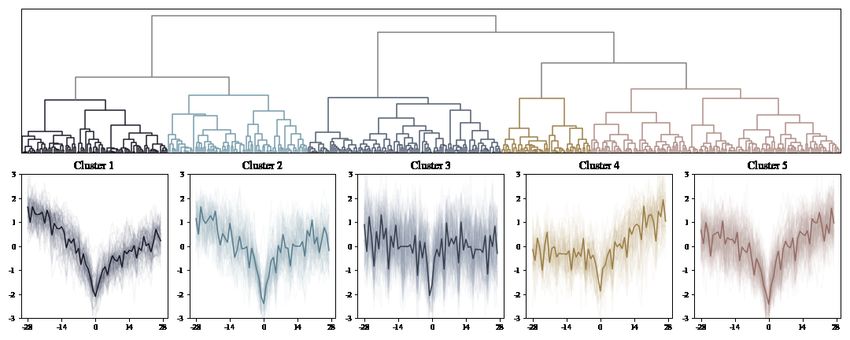
A PREPRINT - S EPTEMBER 20, 2021

                                     Table 1: Overview of newspapers in dataset
                           Newspaper                            period         type
                           Algemeen Handelsblad (AH)                       1950-1969      national
                           De Tijd (DT)                                    1950-1974      national
                           Leeuwarder Courant (LC)                         1950-1994      regional
                           Limburgs Dagblad (LD)                           1950-1989      regional
                           Nieuwe Rotterdamsche Courant (NRC)              1950-1994      national
                           Parool (PA)                                     1950-1995      regional
                           Telegraaf (TG)                                  1950-1994      national
                           Trouw (TR)                                      1950-1995      national
                           Volkskrant (VK)                                 1950-1995      national
                           Vrije Volk (VV)                                 1950-1990      national

data.5 The input document for topic modeling consisted of a concatenation of all the articles on one single front page.
This yields a matrix per newspaper of P (topick |documentd ) or θ, in this case documentd refers to a front page on a
specific date and topick holds the probability distribution of topics over documents. These ten matrices functioned as
input for the calculation of the Jump Entropy.
In addition to the newspaper data, we constructed a list of sixty events for 1950-1995, using historical subject-matter
knowledge combined with Wikipedia.6 This list includes global and national events.

Method
Jump Entropy To measure the flow of information between front pages, we propose an adapted version of the
approach introduced by [16]. Barron et al. [16] measured the amount of novelty (how unexpected is a document, given
previous documents) and transience (the degree to which patterns in documents fade or persist in future documents).
They calculate this using varying window sizes, i.e. comparing the novelty of document compared to the average
relative entropy contained in a varying number of documents. Relative entropy is a divergence measure that is able to
capture the amount of “surprise” between two probability distributions, where (in this case) the reader learns to expect
one distribution, p~, and then encounters second, say ~q. These probability distributions are captured in θ, i.e. the topic
distributions from one time point compared to another. In our case, this would be between front pages in one newspaper.
Calculating novelty and transience using this windowed approach assumes that information accumulates in a continuous
flow. This approach is quite sensitive to outliers, especially for shorter time windows. Also, due to the cyclical nature of
events (e.g. seasonal or annual events), or the cascading, ripple effect in which an event might have impacted newspaper
discourse, taking a continuous window might flatten out these effects.
To better capture the effect of an event on different time scales and trace ripple effects in public discourse, we adapted
their approach. We introduce Jump Entropy, an approach that replaces the shifting window for jumps of different sizes.
Rather than moving through the set linearly, we compare sets of front pages that are separated by a given distance. This
distance between the two sets is expressed by J, the jump size. While using a fixed range of documents (14 days, t - 7
and t + 7), we vary the jump size (J) and calculate the JSD between a set of front pages around the focal point t and
front pages around a focal point either in the past (negative jump size) or the future (positive jump size).7
While [16] compare one front page with a range of front pages, this method compares two ranges of front pages
separated by a jump. Put differently, we measure the average entropy for a range of documents and then jump into the
past or future and compare this range to a similar range in this period. This approach allows us to measure the amount
of “surprise” between the focal set to a set in the past or the future; as such, we can spot re-use of themes or recurring
debates. Compared to the windowed approach, this method is less sensitive to outliers. We can find cyclical patterns,
i.e., which period in the past or future is most similar to the focal period.
In addition to adding jumps, we also used a different metric than [16]. Rather than using Kullback-Leibler (KLD),
we used Jensen-Shannon divergence (JSD), a less well-known formulation of relative entropy. JSD has several
   5
      Using topic coherence, the optimal number of topics (k) centered on 100. Going above or slightly below this number did not
impact the results. However, when too few topics are selected the matrix becomes too sparse which makes it difficult to detect shifts
in entropy.
    6
      See Appendix A for an overview of these events.
    7
      We also experimented with shorter time windows, but this adds noise to the signal.

                                                                 4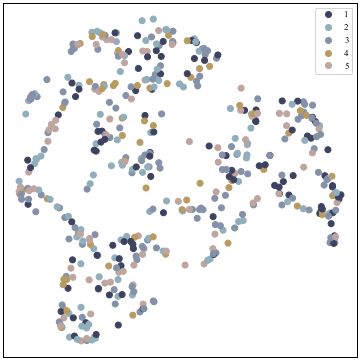
A PREPRINT - S EPTEMBER 20, 2021

favorable properties when dealing with cultural information that is not produced in a strictly one-directional fashion.
While newspapers are published day by day, the information represented in the papers is not necessarily produced
in a one-directional fashion. Articles might have been written earlier, or authors might reflect back onto earlier
events. We contend that JSD better reflects these assumptions. First and foremost, JSD is symmetric ensuring that
JSD(P |Q) = JSD(Q|P ) for probability distributions P and Q. Second, as a smooth version of KLD, JSD is
well-behaved when P and Q are small. Finally, the square root of JSD is a proper distance metric that can be, for
example, be used for clustering probability distributions. A disadvantage of JSD compared to KLD is that it is more
computationally costly. However, this additional cost does not significantly impact the current study.
We model the difference between articles s(j) and s(k) as their relative entropy:

                                                        1               1
                                  JSD(s(j) | s(k) ) =     D(s(j) | M ) + D(s(k) | M )                                    (1)
                                                        2               2

with M = 21 (s(j) + s(k) ) and D is the Kullback-Leibler divergence:

                                                              K                  (j)
                                                              X     (j)         si
                                          D(s(j) | s(k) ) =         si × log2    (k)
                                                                                                                         (2)
                                                              i=1               si

We calculated the average relative entropy between a range (t) of topic distributions (s) at moment i (si+t ) and the
same range of documents at moment j (sj+t ). t ranged from -14 to 14, and the jump size (J) ranges between -1500 and
1500 with steps of 15:

                                                          w
                                                       1 X
                                            JJ (i) =         D(s(i) | s(i+vj) )                                          (3)
                                                       w j=1

where v = −1 for t < 0 otherwise v = 1, and D is the distance measure (in this case JSD), w is a window size and J
is the set of jumps of size w, and t is the time point (‘direction’) at which JJ (i) is computed.
After calculating the jump entropies for a newspaper, we can use them to visualize event flows. Figure 2 shows the
event flow for eight random event in the newspaper De Volkskrant. For each figure, on the x-axis, we see the jump size,
and on the y-axis, the relative entropy. The center of the x-axis (0) indicates the date of the event, and to the left we see
jumps in the past and to the right jumps into the future. This graph captures the flow of information leading up to and
after the event.

Comparing Event Flows To group events within and between newspapers in an unsupervised manner requires
a method to cluster dynamic processes and compute archetypical (averaged) representations of these time series.
Dynamic-Time Warping Barycenter Averaging (DBA) is an ideal solution for exactly that. DBA is based on Dynamic
Time Warping (DTW), a technique for optimally aligning time series and flexibly capturing similarities inside the series
[23]. As such, DTW accounts for non-linear variations in the time series, i.e., fluctuations do not need to occur at
the same time steps [24]. This makes DTW a better distance metric for clustering than traditional Euclidean distance
metrics, which have been found to be an inaccurate measure for clustering [25, 23].
In principle, DTW allows us to align and compare events between newspapers. However, as pointed out by [23],
while DTW is one of the most used similarity measures for time series, it cannot be reliably used for clustering using
well-known algorithms since they rely on K-medoids, which require no averaging. DBA offers an extension of DTW to
compute a consensus representation for a set of time series [23]. This allows us to calculate the average event flow for
one event using data from ten newspapers. Figure 3 gives an example of this process using a DBA and a smoothened
version of DTW (soft-DTW) using a soft minimum. [23] show that DBA can be used as input for the k-means clustering
of time series.
Rather than using k-means clustering, we applied agglomerative clustering. This approach has two main advantages
over k-means clustering. First, the method is more explainable; we can inspect how clusters are created, how they are
distributed over the dataset, and which clusters are more similar than others. Second, agglomerative clustering led to
better separation of the clusters than k-means clustering (see Figure 4).
We clustered using the following steps:

                                                              5
A PREPRINT - S EPTEMBER 20, 2021
Figure 2: Event Flows of De Volkskrant, window size of 50, rolling mean of 5 (orange line).The center of the x-axis
reflects the date of the event, and to the left we see jumps in the past, and the right jumps into the future. This graph
captures the flow of information leading up to and after the event. On the y-axis, we capture the amount of new
information. A lower score means that front pages are more similar, thus a line going down means an increasing focus
on a topic.
Figure 3: Dynamic Time Warping Barycenter Averaging (DBA) of the time series of the Moon Landing. The red line
shows the average time series, while the colored lines show individual time series per newspaper. On the left, we apply
the default DBA method, on the right we see Soft-DTW, which uses a differentiable loss function to find the barycenter.
The x-axis indicates the window before and after the event (centered at 0).
6A PREPRINT - S EPTEMBER 20, 2021
(a) K-means clustering (b) Agglomerative clustering
Figure 4: UMAP projection of clusters learned by k-means (left) and agglomerative clustering (right).
1. Applying a window size of 28.8
2. Time series were z-normalized.
3. Calculate pairwise DTW distance between the events, acquiring a distance matrix.
4. Project the distance matrix in to two dimensions using UMAP (Uniform Manifold Approximation and
Projection).
5. Grid search through clustering parameters (number of clusters, clustering method), aiming for a high Silhouette
score. Additional sanity checks of cluster coherence were taken using the UMAP projection.
6. After the grid search, euclidean distance was picked as the clustering metric, while UPGMA (unweighted pair
group method with arithmetic mean), also known as average linkage, was picked as the linkage criterion.
7. Calculate an archetypical time series using DBA for each found cluster.
Using the described methods, we executed the following steps:
• compare similarities and differences between events across newspapers
• establish archetypical event flows using agglomerative clustering
• use an averaged event flow to query for similar events
4 Results
In what follows, we will first check whether there exists a difference between newspapers and specific event flows. This
step helps us establish for which events there was consensus among newspapers or which newspapers deviated in their
reporting on a particular event. Rather than just focusing on our selection of events, we also use a list of random dates
as a baseline.
Newspaper difference using random dates We selected the event flows with a jump size of thirty, i.e, thirty days
in the future and thirty in the past, for 1,000 random dates between 1950 and 1995 from all the included newspapers.
After z-normalizing the time series for every date, we calculated the average event flow per date using DBA. Next, we
calculated the distance for each newspaper to each date’s average event flow using DTW. This distance to the mean
shows us which newspapers deviated the most from the average for that date. In Figure 5, we see the distance from the
mean per newspaper grouped per decade.
8
There were four to five clusters for all window sizes between five and fifty. We settled for 28 days for interpretative reasons, as it
corresponds to four weeks, or approximately a month of front pages.
7A PREPRINT - S EPTEMBER 20, 2021
Figure 5: Distance per newspaper to average time series for a random set of 1,000 dates. Mean-aggregated by decade
with CI at 95%.
Figure 6: Distance to average event time series. The newspapers and events are sorted based on their mean distance.
Dark refers to a shorter distance, while light refers to longer distances. White indicates missing values. For legibiilty,
we only included the top 10 events closest to the mean and every other second from the remainder of the list of events.
From Figure 5, we can gauge that the regional newspaper Leeuwarder Courant (LC) and national newspaper De
Telegraaf deviated the most from the mean, with the latter diverging considerably over the course of these fifty years.
This confirms what we knew about the country’s most popular newspaper’s ideological course, which moved to the right
in this period [26]. Also, the changing course of the Leeuwarder Courant dovetails with the merger of the newspaper
with another regional newspaper Friese Koerier [27]. It might be that this merger has pushed the newspaper toward to
average Dutch newspaper landscape.
Newspaper differences using selected events In addition to calculating the difference between papers for random
dates, we used our list of events. For each event, we calculated an average event flow using DBA. Next, we calculated
the distance from each event per newspaper to the average event flow. From this, we learn for which events the event
flows in newspapers were the most similar, and for which events newspapers diverged.9
Figure 6 shows that the top five events on which the newspapers reported uniformly were: the Suez crisis in 1956, the
1973 oil crisis, the Nigerian civil war (1967-1970), the fall of Saigon (April 30, 1975), and the moon landing (July 21,
9
Since Algemeen Handelsblad and De Tijd only appeared for a small subset of the period, we excluded these two newspapers
8A PREPRINT - S EPTEMBER 20, 2021
Figure 7: Clustering dendrogram (top) with per-cluster archetypical time series (bottom). DBA time series are indicated
by bold lines. Underlying event flows used for the calculation are shown in thin lines. Selected events, window size of
28.
1969). We also see that NRC Handelsblad, Het Parool, Het Vrije Volk, and De Volkskrant, were most closely aligned in
terms of their event flows, with De Telegraaf and Leeuwarder Courant, again, being the outliers. Here we also clearly
see how De Telegraaf is behaving quite distinct compared to the other newspapers. Especially on Middle Eastern
affairs, such as the Yom Kippur War (1973) and the Iran hostage crisis (1979-1981), other papers were very much in
line with De Telegraaf being the exception.
Archetypical time series Using DBA in combination with agglomerative clustering, we looked for clusters of event
flows in our data. We excluded De Telegraaf because of its deviant behavior. Using a window size of 28, we used the
58 events for the nine remaining newspapers as input. Using Silhouette analysis and cluster separation in the UMAP
projection, we determined that the optimal number of clusters was closest to five. Figure 7 shows the average event
flows within these five clusters.
From this clustering, we learn that events impacted the news in five characteristic manner. These manner capture how
this impact unfolded over time and helps us to understand how events impacted the flow of information in the news, and
by extension, how events impacted our historical temporality. The five clusters can be described as follows:
• Cluster 1: The downward slope before the event indicates a growing focus on an event, with a slow release
indicating persisting, albeit abating focus on the topic after the event.
• Cluster 2: The downward slope before the event indicates a growing focus on an event, with a flat line after
the event indicative of a persistent focus on a topic after the event. Compared to Cluster 1, the event’s impact
is more sudden, and it captured the public’s attention for a longer period.
• Cluster 3: A noisy pattern that indicates no clear anticipation and a quick release after the event. Events
with this signature might have occurred in periods with a quick news cycle, i.e., many news events rapidly
superseding each other.
• Cluster 4: Stable entropy, indicated by lack of slope, which suggests an increasing focus on a topic in the
days before an event. The slope after the event indicates a release of focus after the event. This cluster is the
mirror version of Cluster 2 and, to a lesser extent, Cluster 1.
• Cluster 5: This cluster is most similar to cluster 4, albeit more balanced. There is growing anticipation and a
release after the event. These event characteristics are indicative of events, such as the Moon Landing, that
capture the public’s attention in the days before and after an event.
Querying for Events One of the applications of the cluster-based approach is that we can use the average event
flow of a cluster (indicated by bold lines), to query for front pages that exhibit a similar pattern. This allows us to
search for all the front pages in a particular newspaper that exhibit a sudden focus on a topic, as expressed by Cluster 5.
Alternatively, we could also take a specific event, for example, the Oil Crisis in the 1970s, and look for similar events.
9A PREPRINT - S EPTEMBER 20, 2021
5 Conclusion
We have presented an adaptation to the method introduced in [16], which allows us to capture how events impacted
newspaper discourse, and by extension, reveal how the public’s eye was drawn to specific events. We have shown how
this method can be used to compare how newspapers responded to events and characterize events based on their impact
on newspaper discourse.
The interaction between newspapers and the outside world is a complex interaction. Nonetheless, we managed to
characterize ways in which front pages responded to world events. We can use these characterizations to define
archetypical time series that can be used to query newspaper data to locate similar events. In this study, we have shown
that there were events that impacted the news even though they are not remembered as having an impact, or vice versa.
In future work, we will examine how these disjunctions between the public’s memory of events and their impact on the
news related to the canonization of historical events.
Also, we found that some noteworthy events displayed no clear signal (cluster 3). For example, the accident with
the Challenger space shuttle on January 28, 1986, or the Coup in Ethiopia on December 13, 1960, did not elicit a
clear response in the newspapers. For now, we can only speculate about the reasons that these events did not impact
the information flow on the front pages of Dutch newspapers. One possibility is that the events did not grasp public
attention. Alternatively, it could be that the event was discussed in a more specialized section or that the general public
only identified an event as newsworthy well after it occurred.
Closer examination shows that the earthquakes in Chili in May 1960 followed the event flow displayed in Cluster 1,
which might seem surprising. However, in this case, there was also a summit with world leaders taking place that
increasingly captured the public’s attention. The earthquake disrupted this trend and suddenly introduced a new topic,
herewith increasing the entropy. This example also highlights one of the shortcomings of this approach. Events can
overlap each other, move away from the front pages, and after a turn of events they might return to the front again. This
movement throughout the papers is not yet captured with this approach. Future work will examine the relationships
between topics on the front pages and how they propagated throughout the newspaper. Retention, for instance, could
also be expressed by more in-depth reflections on the events in dedicated newspaper sections.
6 Acknowledgments
This study was a NeiC’s Nordic Digital Humanities Laboratory project (DeiC-AU1-L-000001), executed on the DeiC
Type-1 HPC cluster. We acknowledge The National Library of the Netherlands (KB) for making their newspaper data
available. Also, we express our gratitude to Simon DeDeo for his input during the early stages of this paper.
References
[1] Fernand. Braudel. The Mediterranean and the Mediterranean world in the age of Philip II. University of California
Press, Berkeley, California, 1995.
[2] Robin Wagner-Pacifici. What Is an Event? University of Chicago Press, 2017.
[3] William H. Sewell. Historical events as transformations of structures: Inventing revolution at the Bastille. Theory
and Society, 25(6):841–881, 1996.
[4] Reinhart Koselleck. Futures past on the semantics of historical time. Columbia University Press, New York, 2004.
[5] Theo Jung and Anna Karla. 1. Times of the Event: An Introduction. History and Theory, 60(1):75–85, 2021.
[6] Jo Guldi. The Measures of Modernity: The New Quantitative Metrics of Historical Change Over Time and Their
Critical Interpretation. International Journal for History, Culture and Modernity, 7(1):899–939, 2019.
[7] Joris van Eijnatten and Ruben Ros. The Eurocentric Fallacy. A Digital-Historical Approach to the Concepts of
‘Modernity’, ‘Civilization’ and ‘Europe’ (1840–1990). International Journal for History, Culture and Modernity,
7(1):686–736, 2019.
[8] Joke Daems, Thomas D’haeninck, Simon Hengchen, Tecle Zere, and Christophe Verbruggen. ‘Workers of the
World’? A Digital Approach to Classify the International Scope of Belgian Socialist Newspapers, 1885–1940.
Journal of European Periodical Studies, 4(1):99–114, 2019.
[9] David J. Newman and Sharon Block. Probabilistic topic decomposition of an eighteenth-century American
newspaper. Journal of the American Society for Information Science and Technology, 57(6):753–767, 2006.
10A PREPRINT - S EPTEMBER 20, 2021
[10] Debjyoti Paul, Yanqing Peng, and Feifei Li. Bursty event detection throughout histories. In 2019 IEEE 35th
International Conference on Data Engineering (ICDE), pages 1370–1381. IEEE, 2019.
[11] Melvin Wevers. Using Word Embeddings to Examine Gender Bias in Dutch Newspapers, 1950-1990. In
Proceedings of the 1st International Workshop on Computational Approaches to Historical Language Change,
pages 92–97, Florence, Italy, 2019. Association for Computational Linguistics.
[12] Melvin Wevers, Jianbo Gao, and Kirstoffer L. Nielbo. Tracking the Consumption Junction: Temporal Depen-
dencies between Articles and Advertisements in Dutch Newspapers. Digital Humanities Quarterly, 014(2),
2020.
[13] Jianbo Gao, Jing Hu, Xiang Mao, and Matjaž Perc. Culturomics meets random fractal theory: insights into
long-range correlations of social and natural phenomena over the past two centuries. Journal of The Royal Society
Interface, 9(73):1956–1964, 2012.
[14] Stefania Degaetano-Ortlieb and Elke Teich. Using relative entropy for detection and analysis of periods of
diachronic linguistic change. In Proceedings of the Second Joint SIGHUM Workshop on Computational Linguistics
for Cultural Heritage, Social Sciences, Humanities and Literature, pages 22–33, 2018.
[15] Mike Kestemont, Folgert Karsdorp, and Marten Düring. Mining the Twentieth Century’s History from the Time
Magazine Corpus. In Proceedings of the 8th Workshop on Language Technology for Cultural Heritage, Social
Sciences, and Humanities (LaTeCH), pages 62–70, Gothenburg, Sweden, 2014. Association for Computational
Linguistics.
[16] Alexander T. J. Barron, Jenny Huang, Rebecca L. Spang, and Simon DeDeo. Individuals, institutions, and innova-
tion in the debates of the French Revolution. Proceedings of the National Academy of Sciences, 115(18):4607–4612,
2018.
[17] Patrick Bos, Huub Wijfjes, Maaike Piscaer, and Gerrit Voerman. Quantifying “Pillarization”: Extracting Political
History from Large Databases of Digitized Media Collections. Proceedings of the 3rd HistoInformatics Workshop,
page 10, 2016.
[18] Jaimie Murdock, Colin Allen, and Simon DeDeo. Exploration and Exploitation of Victorian Science in Darwin’s
Reading Notebooks. arXiv preprint arXiv:1509.07175, 2015.
[19] Kristoffer L. Nielbo, M. L. Perner, C. P. Larsen, Jonas Nielsen, and D. Laursen. Automated Compositional Change
Detection in Saxo Grammaticus’ Gesta Danorum. In DHN, pages 320–332, 2019.
[20] Kristoffer L Nielbo, Katrine F Baunvig, Bin Liu, and Jianbo Gao. A curious case of entropic decay: Persistent
complexity in textual cultural heritage. Digital Scholarship in the Humanities, 34(3), 2019.
[21] K.L. Nielbo, P.B. Vahlstrup, and A. Bechmann. Trend Reservoir Detection: Minimal Persistence and Resonant
Behavior of Trends in Social Media. Proceedings of Computational Humanities Research, 1, 2021.
[22] E.E.H Vrangbæk and K.L. Nielbo. Composition and Change in De Civitate Dei: A Case Study of Computationally
Assisted Methods. Studia Patristica, 2021.
[23] François Petitjean, Alain Ketterlin, and Pierre Gançarski. A global averaging method for dynamic time warping,
with applications to clustering. Pattern recognition, 44(3):678–693, 2011.
[24] Thanawin Rakthanmanon, Bilson Campana, Abdullah Mueen, Gustavo Batista, Brandon Westover, Qiang Zhu,
Jesin Zakaria, and Eamonn Keogh. Addressing big data time series: Mining trillions of time series subsequences
under dynamic time warping. ACM Transactions on Knowledge Discovery from Data (TKDD), 7(3):1–31, 2013.
[25] T Warren Liao. Clustering of time series data—a survey. Pattern recognition, 38(11):1857–1874, 2005.
[26] Pien van der Hoeven and Huub Wijfjes. Concentratie en kritische autonomie, 1950-2000. In Huub Wijfjes and
Frank Harbers, editors, De Krant, pages 247–290. Boom, 2019.
[27] Marcel Broersma and Gitte Brugman. De nieuste tydingen: Leeuwarder Courant 250 jaar. Leeuwarder Courant,
2002.
11A PREPRINT - S EPTEMBER 20, 2021
A Appendix A: Selected Events
event date event date
Eisenhower President 1953-01-20 Jones Town 1978-11-18
Flood NL 1953-02-02 Snow Storms NL 1978-12-30
Suez Crisis 1956-10-30 Sjah Iran 1979-01-16
Earthquake Chili 1960-05-23 Harrisburg 1979-03-28
Coup Ethiopia 1960-12-15 Salt2 1979-06-18
Kennedy Inauguration 1961-01-20 Hostage Iran 1979-11-05
Startberlin Wall 1961-08-14 Election Irak 1980-06-20
Eichmann Execution 1962-06-01 Eta 1980-06-25
End Cuba Crisis 1962-10-29 Irak Iran War 1980-09-22
Coldest Winter 1963-01-15 Reagan Election 1980-11-04
Pope Dies 1978-08-07 Reagan Inauguration 1981-01-20
Coup Vietnam 1963-11-01 Protest Nuclear 1981-11-21
Riot Congo 1964-11-26 Protest Train 1982-01-18
Auschwitz Trial 1965-08-19 Coup Surinam 1982-03-11
Nigerian Civil War 1967-05-30 Israel Bombs 1982-04-21
Tet Offensive 1968-01-30 Van Agt Dissolve 1982-05-13
Mlk Death 1968-04-04 Nuclear Protest VS 1982-06-12
Nixon Candidate 1968-08-08 Financial Crisis Latin America 1982-08-12
Moon Landing 1969-07-21 Heineken Kidnapping 1983-11-09
Fall of Saigon 1969-07-25 Gulf War Intensifies 1984-02-16
Biafra End 1970-01-12 Iran Offensive 1984-10-18
Bloody Sunday 1972-01-31 Elfsteden 1985-02-21
Olympic Munchen 1972-09-05 Schengen Accord 1985-06-14
Yom Kippour 1973-10-06 Challenger Accident 1986-01-28
Oil Crisis 1973-10-17 Chernobyl 1986-04-26
Palestinian Hostage 1973-12-17 Intifada 1987-12-09
Train Hostage 1975-12-02 End Afghan Occupation SU 1988-04-14
Crash 747 Tenerife 1977-03-28 UEFA Eurocup 1988-06-25
Raf Death 1977-10-18 Lockerbie 1988-12-21
WC Argentina 1978-06-26
12You can also read