Investor Presentation - August 2020 Always Advancing to Protect What's Important
←
→
Page content transcription
If your browser does not render page correctly, please read the page content below

Investor Presentation
Always Advancing to Protect What’s Important

August 2020

Safe Harbor Statements
Forward-Looking Statements
Statements in this presentation that are not historical, including statements relating to the expected future performance of the Company, are considered “forward looking” and are presented pursuant to the safe harbor provisions of the Private Securities Litigation Reform
Act of 1995. You can identify forward-looking statements because they contain words such as “believes,” “expects,” “may,” “will,” “should,” “would,” “could,” “seeks,” “approximately,” “intends,” “plans,” “estimates,” “anticipates,” “outlook,” or “looking forward,” or
similar expressions that relate to our strategy, plans or intentions. All statements we make relating to our estimated and projected earnings, margins, costs, expenditures, cash flows, growth rates and financial results or to our expectations regarding future industry trends
are forward-looking statements. In addition, we, through our senior management team, from time to time make forward-looking public statements concerning our expected future operations and performance and other developments. These forward-looking statements are
subject to risks and uncertainties that may change at any time, and, therefore, our actual results may differ materially from those that we expected.

Important factors that could cause actual results to differ materially from our expectations, which we refer to as cautionary statements, are disclosed under “Risk Factors” and elsewhere in our Annual Report on Form 10-K and subsequent filings with the Securities and
Exchange Commission, including, without limitation, in conjunction with the forward-looking statements included in this presentation. All forward-looking information and subsequent written and oral forward-looking statements attributable to us, or to persons acting on
our behalf, are expressly qualified in their entirety by the cautionary statements. Some of the factors that we believe could affect our results include: (1) risks associated with our substantial indebtedness and debt service; (2) changes in prices and availability of resin and
other raw materials and our ability to pass on changes in raw material prices on a timely basis; (3) performance of our business and future operating results; (4) risks related to acquisitions, integration of acquired businesses and their operations (including the integration of
RPC Group Plc (“RPC”), and realization of anticipated cost savings and synergies and in the anticipated amounts or within the contemplated timeframes or cost expectations, the inability to realize the anticipated revenues, expenses, earnings and other financial results and
operational benefits, and the anticipated tax treatment; (5) reliance on unpatented proprietary know-how and trade secrets; (6) increases in the cost of compliance with laws and regulations, including environmental, safety, and production and product laws and regulations;
(7) risks related to disruptions in the overall economy and the financial markets that may adversely impact our business; (8) risk of catastrophic loss of one of our key manufacturing facilities, natural disasters, and other unplanned business interruptions; (9) risks related to
market acceptance of our developing technologies and products; (10) general business and economic conditions, particularly an economic downturn; (11) risks that our restructuring programs may entail greater implementation costs or result in lower cost savings than
anticipated; (12) ability of our insurance to fully cover potential exposures; (13) risks of competition, including foreign competition, in our existing and future markets; (14) uncertainty regarding the United Kingdom’s withdrawal from the European Union and the outcome of
future arrangements between the United Kingdom and the European Union; (15) risks related to the phase-out of the London Interbank Offered Rate (LIBOR), or the replacement of LIBOR with a different reference rate or modification of the method used to calculate LIBOR;
(16) new legislation or new regulations and the Company’s corresponding interpretations of either may affect our business and consolidated financial condition and results of operations; (17) risks related to international business, including as a result of the RPC transaction,
including foreign currency exchange rate risk and the risks of compliance with applicable export controls, sanctions, anti-corruption laws and regulations; and (18) the other factors discussed under the heading “Risk Factors” in our Annual Report on Form 10-K and
subsequent filings with the Securities and Exchange Commission. We caution you that the foregoing list of important factors may not contain all of the material factors that are important to you. Accordingly, readers should not place undue reliance on those statements. All
forward-looking statements are based upon information available to us on the date of this release. We undertake no obligation to publicly update or revise any forward-looking statement as a result of new information, future events or otherwise, except as otherwise
required by law.

This presentation should be read together with “Management’s Discussion and Analysis of Financial Condition and Results of Operations” and the consolidated financial statements and the related notes thereto included in our public filings.

Non-GAAP Financial Measures
This presentation includes certain non-GAAP financial measures such as operating EBITDA, adjusted EBITDA, adjusted net income, and free cash flow intended to supplement, not substitute for, comparable measures under generally accepted accounting principles (GAAP).
Investors are urged to consider carefully the comparable GAAP measures and the reconciliations to those measures provided in our earnings release, presentations, and SEC filings. For further information about our non-GAAP measures, please see our earnings release, SEC
filings and supplemental data at the end of this presentation.

Website Information
We often post important information for investors on our website, www.berryglobal.com, in the “Investor Relations” section. We use this website as a means of disclosing material, non-public information and for complying with our disclosure obligations under Regulation
FD. Accordingly, investors should monitor the Investor Relations section of our website, in addition to following our press releases, SEC filings, public conference calls, presentations, and webcasts. The information contained on, or that may be accessed through our website,
is not incorporated by reference into, and is not a part of this document.

No profit forecast
Nothing contained herein shall be deemed to be a forecast, projection or estimate of the future financial performance of RPC or the combined business following the completion of the combination, unless otherwise stated.

LTM Information
LTM information presented herein is the Last Twelve Months of reported information as of the date represented.

Certain information included in this presentation has been sourced from third parties. Berry does not make any representations regarding accuracy, completeness or timeliness of such third party information. Permission to cite such information has neither been sought nor
obtained.

                                                                                                                                                                                                                                                                                      2
Safety
                          Our #1 priority and core value is the health and safety of our people

                                                                                                        Industry Average

                                                                         Significantly lower than the
     OHSA Incident Rate

                                                                         industry recordable average

                          Never Ending Commitment to Identifying, Managing, and Eliminating Risk
                                                                                                                           3
Berry Overview

                 3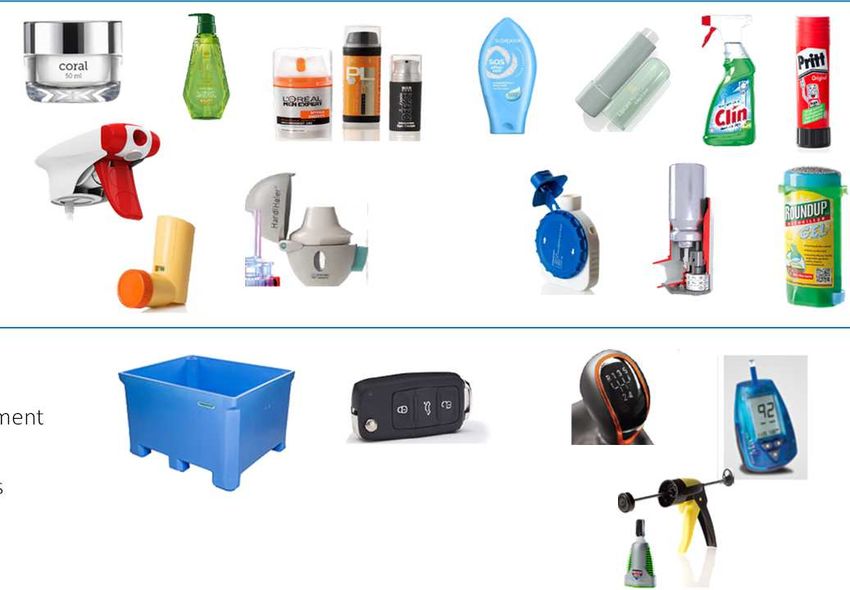
A leading global supply, design, and
 engineering company for value-added
 packaging and protective solutions

                                                                                           Strong, growing, dependable,
                                                                                           and predictable cash flows

                    Low cost manufacturer of                                                                                Proven growth
                    thousands of products in                                                                                platform
                    stable end markets

 $12.6 B                                                293                                             ~47,000                39            100,000+
Annual Revenues                                       Facilities                                            Employees       Countries       Items Manufactured

                                                                                                                                                                 5
       Information is pro forma estimates for most recent acquisitions along with management estimates as of fiscal 2019.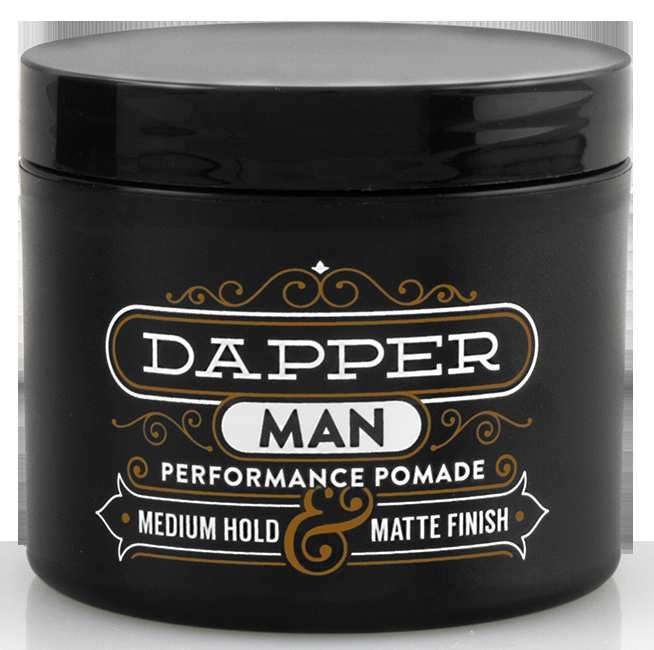
Berry Overview

                             ~70% of sales are in stable, consumer-oriented end markets

                                                           Revenue FY19                                                                  Revenue FY19
                                                           by End Market                                                                 by Geography
                                                                 Food & Beverage                                    34%                     North America 51%

           ~$12.6                   B                            Home, Health & Personal Care 30%                         ~$12.6     B      EMEA           40%
                                                                 Specialties                                        25%                     Asia Pacific   5%
                 revenue                                                                                                   revenue
                                                                 Distribution                                       11%                     ROW            4%

                                                                                                                                                                 6
   Information is pro forma estimates for most recent acquisitions along with management estimates as of fiscal 2019.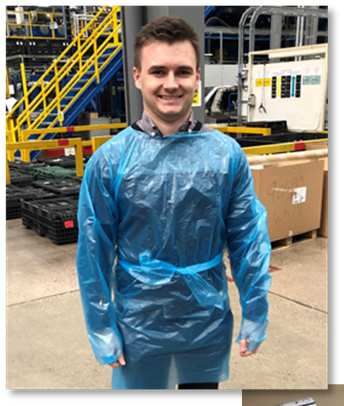
Four Complementary Segments
Consumer Packaging -                                                Consumer Packaging -                                       Health, Hygiene &
                                                                                                                                                    Engineered Materials
    International                                                      North America                                              Specialties

     36% of Revenue                                                             24% of Revenue                                    20% of Revenue          20% of Revenue
        Revenue                                                                        Revenue                                       Revenue                 Revenue
           $4.6B                                                                         $3.0B                                         $2.5B                  $2.5B
• Closures                                                           •    Closures                                         •   Diapers              • Consumer and industrial
• Containers                                                         •    Drink cups                                       •   Adult incont.          flexible packaging
• Bottles                                                            •    Bottles                                          •   Feminine care        • Industrial & specialty tapes
• Consumer & industrial                                              •    Prescription vials                               •   Medical garments     • Can liners
  flexible packaging                                                 •    Containers                                       •   Disinfectant wipes
• Medical devices
                                                                     •    Tubes                                            •   Dryer sheets
• Recycling & waste mngt.
                                                                                                                           •   Filtration
  solutions

    A unique global consumer packaging platform

                                               A One-Stop Shop Offering with a Global Manufacturing Platform

        Information is pro forma estimates for most recent acquisitions along with management estimates for fiscal 2019.
                                                                                                                                                                                     7
        -Berry produces components of some of the products in the HH&S segment.
Key Investment Highlights
              1   Global leadership position with scale

                  2       Consistent, predictable, & dependable free cash flow

                      3     History of revenue and EBITDA growth

                      4     A leading innovator backed by investments in design and engineering….

                      5     ….and is at the forefront of sustainability

                  6       Unique long-term M&A strategy opportunity with a proven track record

              7   Margin stability across various input cost cycles

          8   Serves stable end markets with favorable long-term dynamics
                                                                                                    8
1   Global Leadership Position with Scale
                                                                                                                                                                                                Revenue

    •     Largest resin buyer with ~7 billion lbs                                                                                                                         $13.0         $12.6
                                                                                                                                                       $12.0
          procured annually
    •     Leadership position across the majority of                                                                                                   $10.0

          our product portfolio                                                                                                                          $8.0
                                                                                                                                                                                                 $5.4
    •     The most expansive product offering and                                                                                                        $6.0
                                                                                                                                                                                                          $4.8   $4.5
          global footprint
                                                                                                                                                         $4.0                                                           $2.9

                                                                                                                                                         $2.0

                                                                                                                                                           $-
                                                                                                                                                                          AMC            BERY    SON      SEE    SLGN   ATR

                                               Low Cost Manufacturer – Sustainable Competitive Advantage

        Berry revenue represents pro forma for most recent acquisitions. Competitor group represents plastic producing peers. Competitor group revenue based on public LTM data as of
                                                                                                                                                                                                                               9
        November 21, 2019.
2   Consistent, Predictable, & Dependable Free Cash Flow
                                                                                                                                                                          Free cash flow yield (1)                          ~14%       ~15%

                                                                                                                                                                                                                                         $900 +
                                                                                                                                                                                                                             $830

• 5-year free cash flow CAGR of >20%                                                                                                                                                                               $764

                                                                                                                                                                                                         $634
                                                                                                                                                                                              $601
• Exceeded free cash flow guidance every                                                                                                                                            $517
  year since IPO                                                                                                                                                 $436

• Normalized FCF of $900+ million
                                                                                                                                                             FY 2015               FY 2016   FY 2017   FY 2018   FY 2019   FY 2020E   Normalized
                                                                                                                                                                                                   Guidance    Actual

                             Berry’s FY ’20E FCF Yield is >14% (1) – Well Above Peers LTM Average of ~8% (2)

    (1)  Based on latest shares outstanding and stock price as of the most recent reported quarter.
    (2)  Packaging peer group includes: Amcor, Aptar Group, Ball Corporation, Crown Holdings, Graphic Packaging, Owens Illinois, Sealed Air, Silgan, and Sonoco. Packaging peer
         average based on the latest calculated public data available as of August 4, 2020. Free cash flow calculated as cash flow from operations less net capital expenditures
         from public cash flow statements.
    Note: Normalized free cash flow is expected free cash flow assuming the achievement of expected cost synergies and the exclusion of restructuring and integration costs                                                                        10
    associated with achieving synergies, on a tax adjusted basis.
3 Strong Financial Performance Track Record
Revenue $8,878 Free Cash Flow
$800 $764
$8,000
$700 $634
$601
$6,000 $600
$517
$500 $436
$4,000
$400
$2,000 $302
$329 $300
$0 $200
1999 2004 2009 2014 2019 2014 2015 2016 2017 2018 2019
Adjusted Earnings Per Diluted Share
$1,600 Operating EBITDA $1,530
$4.00
$3.50 $3.37 $3.41
$1,200 $3.09
$3.00
$800 $2.48
$2.50
$2.00 $1.70
$400 $1.56
$1.50
$72
$0 $1.00
1999 2004 2009 2014 2019 2014 2015 2016 2017 2018 2019
Proven Track Record of Growth 11
Dollars in millions, except per share data. Represents fiscal revenue and operating EBITDA for respective years4 A leading innovator backed by investments in design and
engineering…..
Selected examples of innovation
• Investment in innovative product design, process and conversion Breathable film
technologies Breathable film allows
moisture control for
hygiene applications
• Currently 30+ focused design and innovation centers with thousands with soft, quiet
of patents features enabling
comfort and discretion
• Innovation capability is a key competitive advantage over smaller
competitor base Next generation trigger pumps
Pre-compression
• Innovation examples across all of our segments, e.g. patented sports technology keeps the
caps, breathable film technology, fully recyclable flexible pouch, and trigger sprayer
perpetually primed,
next generation tripper pumps dispensing output at
high velocity
124 A leading innovator backed by investments in design and
engineering….
Health, Hygiene, & Consumer Packaging
Specialties (Global) Engineered Materials
• Emerging Markets • One-stop shop • E-Commerce
(Higher growth GDP) • Design flexibility • Material science
• Rising middle class • Improved load
• Clarity & sustainability
• Infection prevention management
• Convenience
• Adult Incontinence • Film strength
Advantaged Products in Targeted Markets
135
….and is at the forefront of sustainability
Innovative design solutions On-site recycling facilities
Berry’s Partner Initiatives
• Recyclability, recycled content, and • Best-in-class UK-based plastic waste • Alliance to End Plastic Waste (AEPW)
reusability are increasingly a sought after recycler
design consideration • Closed-loop recycler in ag, commercial, and • Impact 2025
• Berry is uniquely positioned to help industrial solutions • Signed Ellen MacArthur Foundation
customers through our design and • Growth in our reliable collection system to
engineering capabilities enhance waste mngt. and increase • Partnership with SABIC – chem. recycling
• We anticipate more sustainable designs but recycling, as well as, avoid litter and plastic
no move back to other materials given leakage into the environment
Berry does not manufacture any products that
plastics unique advantages
are restricted under any legalized bans
Sustainability is an Opportunity for Berry
146Long-term consolidation opportunities - drive future
inorganic growth and shareholder returns
• Top priority is to de-lever to 3.x
• Completed 46 acquisitions to date
• Average ~5% cost synergies of acquired targets revenue
Rigid Plastics Flexible Plastics Nonwovens Market fragmentation
Top 3
24% 27%
30% #4-10
N.A.
only 41% #11-100
49% 49%
27% 24%
29%
We Believe There Will be Decades of Consolidation Opportunities in a Growing Substrate
15
Source: Plastics News (N.A. only) and Nonwoven Industry Magazines. Rigid Plastics includes thermoforming, blow molding and injection molding. Flexible Plastics includes film and sheet.
Rigid and flexible markets is North American only. Nonwovens is global market.7 Margin stability - resin is a pass-through
Resin – Primary raw material Over the past 8 quarters resin volatility was ~40%;
Berry margins remained in a small range
• Resin comprises approximately
50% of COGS 90
• ~70% of resin pounds sold are 80
on contractual pass through
Cents per LB
70
• Approximately 55% of our buy 60
PE Price
PP Price
is polyethylene and 40% is LTM EBITDA
Margin
polypropylene 50
18.0% 17.5% 17.4% 17.5% 17.4% 17.2% 17.0% 17.1% 17.6%
40
~7 Billion Pounds Purchased Annually
168 Growing Substrate
Plastic Packaging Offers:
Global Packaging Market
• Durability
• Protection/Safety 2000 2015 2025 E
• Design versatility
• Cost advantageSustainability
18Benefits of Plastics – Lightweight Products
If plastic packaging was replaced with alternatives,
Packaging Characteristic Advantages
like paper, metal, and glass: Influential Trend Winning Characteristic
Alternative Packaging • Shelf stability
Plastic Materials At-home Consumption • Multi-use
Alternatives would require 2x as • Protection
much energy as plastics
• Strength/protection
Alternatives would require 6x as Increased e-Commerce
• Spoilage assurance
much water as plastics Adoption
• Lightweight
Alternatives would generate 5x
as much solid waste as plastics Elevated Focus on • Versatile options
Health & Hygiene • Adaptable
Alternatives would generate 4x as much
greenhouse gas emissions as plastics
Sustainability • Closable & reusable
• Lightweight
Plastic Packaging has a Lower Overall Environmental Impact than Other Packaging Alternatives
19Impact 2025
Products Performance Partners
Minimize product impacts Minimize operational impacts Maximize positive impacts
by engaging partners on key issues
Optimize Design Climate Change End Plastic Waste
• Lightweight products • Reduce greenhouse gas emissions • Expand and modernize waste
• Design 100% of packaging to 25% by 2025 versus our 2016 infrastructure to increase recovery
be reusable, recyclable, or baseline* and prevent loss of plastic to the
compostable environment
Continuous Improvement • Engage the plastics industry on
Sustainable Sourcing
• Reduce landfill waste OCS
• Increase recycled content 5% per year* Limit Global Warming
• Encourage the development • Reduce energy and water • Increase renewable energy
of renewable materials consumption 1% per year* • Expand the use of plastic in place
Operation Clean Sweep® of alternative materials
• Prevent resin loss through OCS • Promote science-based targets
• Implement OCS at acquisition sites
within the first year
20Ahead of Schedule for Impact 2025 Targets
Recycled Content: We set a new record for annual usage of post-consumer plastic in FY19 of 70,000 metric tons (154
million pounds). Much of the increase was driven by our acquisition of RPC, which is included on a pro forma basis.
Greenhouse Gas Emissions (GHG): We continued our long-term reduction in Scope 1+2 GHG emissions intensity, having
reduced our intensity 3% year-over-year and 46% since the we began measuring its carbon footprint in 2008. We are
ahead of schedule for achieving our science-based target of a 25% reduction in Scope 1+2 GHG emissions intensity by
2025, having already achieved a 14% reduction vs. our 2016 baseline.
Landfill Waste: We realized a 13% reduction in its landfill waste intensity from 2018 to 2019. This exceeds the our goal
of a 5% reduction year-over-year.
Energy: For the year, we reduced its energy intensity by 3% year-over-year. This exceeds the our goal of a 1% reduction
year-over-year.
Water: In the year 2019, we decreased absolute water intensity 12% from 2018 to 2019, far exceeding the 1% year-
over-year reduction target.
21We Play an Essential Role in the Supply Chain
As a global leader in food, hygiene, healthcare, personal care and other protective packaging, we play a crucial role and are
an essential part in the supply chain, for safety of necessities, such as food, medicines, sanitizing products and protective
healthcare apparel.
Packaging promotes hygiene and prevents spread of disease. It keeps food safe, prevents spoilage, and preserves its original
properties and it avoids waste. Families and healthcare professionals rely on sterile packaging and plastic packaging to help
protect health and hygiene.
Hygiene/Safety Cleaning Food Medicines
22Supporting Our Local Communities
“We donated ~100,000 face shields to local first responders and healthcare workers”
“We supplied necessary protective gear to a nearby hospital in Barcelona, Spain”
“We donated 1,500 airless bottles to the University hospitals in France”
“Our facilities in South Africa, donated plastic sheeting for the manufacture of 300 visors for medical use”
We donated over 50,000 hand sanitizer bottles to communities and businesses to aid in the protection of spreading the infection
“We produced gowns for England’s National Health Services in a matter of days”
23Alliance To End Plastic Waste (AEPW)
• 40+ global companies from the plastics and consumer goods value chain
• Goal to deploy $1.5 billion to solutions over the next five years
• The Alliance will develop and bring to scale solutions that will minimize and manage plastic waste and promote
solutions for used plastics by helping to enable a circular economy
• Infrastructure development – to collect and manage waste and increase recycling
• Innovation – to advance and scale new technologies that minimize waste, make recycling and recovering
plastics easier, and create value from all post-use plastics
• Education and engagement – of governments at all levels, businesses, and communities to mobilize action
• Clean up – of concentrated areas of plastic waste already in the environment, particularly major rivers that
carry vast amounts of land-based waste to the ocean
• Berry already has a history of reducing the amount of resin annually in our products, as well as, using post-consumer
recycled materials in our product offerings
https://endplasticwaste.org/
24Impact Report & GRI Index
Report in accordance with Global Reporting Initiative (GRI) Standards, includes assurance
statements for absolute energy, carbon emissions, and renewable purchases
Provides examples of the work Berry has done to:
• Reduce waste to landfill
• Source renewable energy
• Test and evaluate new, more efficient equipment
• Institute standardized management plans to reduce environmental impacts
• Conduct product life cycle assessments and explore sustainable materials
• Promote social initiatives in the communities where we live and work
Current and past reports can be found here:
https://sustainability.berryglobal.com/resources/
25Berry Strategy
26Clear Strategy Focused on Value Creation
Cash Flow From Operations
$1.45 Billion Cost reduction
projected in FY 2020 25% Maintenance
50%
Capex
25%
Additional share repurchases Growth
Further long-term
Dividends opportunities $620 million Targeted capital
projected in FY 2020
spending for organic growth
& cost reduction
M&A Debt Pay Down
Disciplined and Longer-term
conservative strategy Target leverage
opportunity with 3.x Our Top Priority
experienced teams
Strong, Dependable, and Stable Free Cash Flow Allows Quick De-leveraging
27Enhanced FCF Generation and De-leveraging History
Strong, consistent free cash flow Ability to rapidly de-lever post acquisition
• Exceeded free cash flow guidance every year Case Study Projected
since IPO
• Incremental free cash flow from RPC 5.1x
4.8x
4.9x
$900 +
$830 3.X
~4.0x
3.9x
$764
$634
$601
$517
$436
FY 2015 FY 2016 FY 2017 FY 2018 FY 2019 FY 2020E Normalized Leverage 2-Years Leverage 2-Years
+
Guidance Actual
@ Close Post Close @ Close Post Close
$900+ Million of Normalized Free Cash Flow 28Appendix: Current Topics
29 20
29Fiscal Year 2020 Guidance
Cash flow from operations $ $1,450
Less: capital expenditures (620)
Free cash flow $ $830
Free cash flow $ 830
Capit al expenditures 620
Cash int erest expense 430
Taxes 170
Working capital & other costs 50
Operat ing EBITDA $ 2,100
- Lower debt leverage
Key Objectives - Grow organically
- Integrate RPC acquisition
= Maximize Shareholder Value
Note: Dollars in millions.
We have not provided guidance for the most directly comparable U.S. GAAP financial measure because such information is not
available without unreasonable effort due to the high variability, complexity, and low visibility with respect to certain items,
including tax accruals, restructuring charges, gains and losses related to acquisition and divestiture of businesses, the ultimate
outcome of certain legal or tax proceedings and other unusual gains and losses. These items are uncertain, depend on various
30
factors, and could be material to our results computed in accordance with U.S. GAAP.Interest Expense, Foreign Currency Exposure, and Liquidity
Interest expense exposure Liquidity
• Over $3 billion of interest rate hedges (swapped variable to fixed) • $906 million cash on hand
• ~70% of our revenue is in stable, consumer-centric end markets • $850 undrawn ABL Revolver
• Consistent and defensive cash flow ~$1.8 billion total liquidity
• No financial maintenance covenants
A 0.25% change in LIBOR would impact our annual interest • No near-term debt maturities
expense by ~$8 million on variable term loans
Term Loans $ 6,213 Foreign currency exposure
Term Loan Hedges (3,207)
• Over $3 billion of cross currency swaps (Euro & GBP)
Total Variable $ 3,006 28%
• 60% USD, 30% Euro and 10% GBP debt allocation
Capital leases and other $ 40 • Objective of matching geographic debt with earnings
Term Loan Hedge 3,207
1st & 2nd Lien Notes 4,507
Euro = +/- $5.5 million of EBITDA
Total Fixed $ 7,754 72%
A 1% move in:
GBP = +/- $1.5 million of EBITDA
31
Note: Dollars in millionsRPC Overview
32RPC: European leader with a unique design and innovation
platform
Leading European rigid and flexible packaging manufacturer serving a range of
consumer, healthcare, and industrial markets
Expansive commercial and operational presence
Balanced long and short-run production capabilities, enhanced by specialty Innovative design
innovation, engineering, and recycling expertise solutions
Leading consolidator in Europe
Platforms: Injection, blow and rotational molding, thermoforming, and blown
film extrusion
Recycled and sustainable
input polymers
33RPC: End Market Overview
End markets Product samples % of legacy RPC sales
Food & beverage
Containers
Convenience foods ~40%
Dry foods
Coffee capsules
Closures and caps
Consumer goods
Personal care, beauty
Healthcare & hygiene
Household chemicals
Medical inhaler devices
~40%
Drug delivery/dosing systems
Other consumer products
Specialties
Material handling/waste management
Automotive ~20%
Tobacco, nicotine delivery systems
Tooling/machinery
Construction
34RPC: Global Presence, with Scale in Europe
RPC locations
Berry locations
Combined Global Mfg. Locations
North America 127
EMEAI 139
Rest of World 27
Global Footprint to Better Serve Our Growing Customer Needs
35RPC: Provides enhanced ability to serve customers
Common Approaches
• Local, national, and international reach,
quality and service
• Long-term relationships
• Disciplined cost management
• Differentiated standardization and
customization capabilities
• Premium, low-cost and sustainable
solutions
• Local, in-market presence
• Deep product breadth and selection
Significant Capabilities and Solutions Serving an Attractive Customer Base
36Appendix: Our Businesses
28
37Our Leadership
Tom Salmon Mark Miles
Chairman & CEO CFO & Treasurer
Passionate leader focused on improving Berry’s financial Disciplined and financially driven leader highly focused on
performance, creating an entrepreneurial-like workplace creating long-term value for Berry
while helping our customers succeed
• Named CFO January 2014
• Named CEO February 2017 • Previous 11 years with Berry as EVP, Controller and
• Prior 12 years with Berry: various leadership roles, Treasurer
including President and COO; led both Engineered • Started with Berry in 1997 as Corporate Controller
Materials and Consumer Packaging divisions • Integral part of management for 36 of Berry’s 45
• Prior experience includes leadership roles at Tyco acquisitions
Adhesives, Honeywell and General Electric
38Diverse and Stable Customer Base • Longstanding relationships with diverse mix of leading • 20,000+ customers globally multi-national, regional & local customers • Top customer represents
Segment Breakdown – End Market and Geography
                         Consumer Packaging -                    Consumer Packaging-                                   Health, Hygiene, &                              Engineered
                             International                          North America                                         Specialties                                   Materials
                                                                         Specialties
                                                               Distribution                                                                 Home, Health &
              Home, Health &                     Food &                            6%        Food &                                         Personal Care
              Personal Care                      Beverage                  7%                                                                                                          46%      Distribution
                                   25%                                                       Beverage

                                               38%
Revenue by                                                                                                                                  73%
                                                                   27%                                                                                           23%
End Market:                                                                                 60%
                                                                                                                      27%

                                                       Home, Health &                                   Specialties                                    Specialties
                                         37%           Personal Care                                                                                                                         Food &
                         Specialties                                                                                                                                          31%            Beverage
                                                                                                                            Asia
                                                                                                                            Pacific
                                                                                                                                                                       EMEA    ROW
                                                                                                                                                                         1% 1%
                                                                                                                                      10%   North America
                      ROW
                                                                                                              ROW
                              10%
                                                                                                                      18%
Revenue by                                           EMEA                                                                                   48%
Geography:        Asia
                            11%                79%
                  Pacific

                                                                                                                              24%
                                                                                   100%                           EMEA                                                        98%

                                                                            North America                                                                                           North America

                                                                                                                                                                                                          40
                 Berry estimates
Consumer Packaging - International
Containers Closures Beverage Healthcare Personal Care Household Specialties
Product
Examples
Amcor Aptar Alpla Albea Albea Amcor Greif
Alpla Reynolds Bericap Aptar Aptar Aptar Husky
Competitors Coveris Mold-Rite ITW Hi-Cone Gerresheimer Alpla Alpla OnePlastics Grp
Greiner Silgan Reynolds Nemera Coveris Plastipak SULO
41
Not inclusive of all products or competitorsConsumer Packaging – North America
Containers Closures Drink Cups Bottles Tubes Rx Vials Overcaps Jars
Product
Examples
Airlite Aptar Dart Alpha Albea Apothecary Aptar Alpha
Products
IPL Reynolds LidWorks Amcor CCL Cobra Mold-Rite
Competitors Centor
Polytainer Mold-Rite Reynolds Reynolds Essel Propack Dubuque Intrapack
Tri State
Silgan Silgan Viva Underwood Omega
42
Not inclusive of all products or competitorsHealth, Hygiene, & Specialties
Adult Surgical Products & Pharmaceutical
Diapers Feminine Care
Incontinence Medical Packaging & Rigid Medical
Product
Examples
Avgol Avgol Avgol Ahlstrom- Gerresheimer
Munksjö
Competitors Fitesa Fitesa Fitesa Nypro
Gulsan Gulsan Amcor
Pegas West
Fitesa Pharmaceutical
Toray RKW Pegas
SAAF
Wipes Filtration Geosynthetics Ag & Other Building Wraps
Product
Examples
Jacob Holm Freudenberg Low & Bonar Fitesa Barricade
Sandler John Mansville Naue Mogul DuPont
Competitors
Spuntech Mogul TenCate Owens Corning Kingspan
Suominen Thrace TenCate
43
Not inclusive of all products or competitorsEngineered Materials
Stretch Films Can Liners Tapes Converter Films
Product
Examples
Inteplast Aluf 3M Amcor
Malpack Inteplast IPG Charter NEX
Competitors
Paragon Novolex Scapa Next Gen
Sigma Sigma Shurtape Sealed Air
Shrink Films Food Films Retail Bags PVC Films
Product
Examples
All American Amcor Clorox Anchor
Amcor Printpack Polyamerica Fine Pkg
Competitors
Colormasters Sealed Air Reynolds Polyvinyl
Hillside WinPak Reynolds
44
Not inclusive of all products or competitorsAppendix: Supplemental Data
(1) Adjusted EBITDA, free cash flow, and adjusted net income should not be considered in isolation or construed as an alternative to our net income (loss) or other measures as determined in accordance with GAAP. In addition, other companies in our
industry or across different industries may calculate adjusted EBITDA, free cash flow, and adjusted net income and the related definitions differently than we do, limiting the usefulness of our calculation of adjusted EBITDA, free cash flow, and adjusted
net income as comparative measures. EBIT, operating EBITDA, adjusted EBITDA, free cash flow, and adjusted net income are among the indicators used by the Company’s management to measure the performance of the Company’s operations and thus
the Company’s management believes such information may be useful to investors. Such measures are also among the criteria upon which performance-based compensation may be based
41
45Supplemental Data
Fiscal Year 2019 Net Sales and Operating New Structure
EBITDA Recasts for Segment Realignment
Consumer Packaging - International (CPI)
NET SALES FQ1 '19 FQ2 '19 FQ3 '19 = RPC’s international business
+ HH&S’s international rigid business
Consumer Packaging - Int'l $ 51 $ 50 $ 52 + EM’s international flexible business
Engineered Materials (9) (9) (9) Consumer Packaging - North America (CPNA)
Health, Hygiene & Specialties (42) (41) (43) Consumer Packaging
= Consumer Packaging
Engineered Materials + RPC’s North American rigid business
OPERATING EBITDA FQ1 '19 FQ2 '19 FQ3 '19
Health, Hygiene, & Specialties
Consumer Packaging - Int'l $ 8 $ 7 $ 9 Health, Hygiene, & Specialties (HHS)
Engineered Materials (1) (1) (1) = Health, Hygiene, & Specialties
- International rigid business (to CPI)
Health, Hygiene & Specialties (7) (6) (8)
Engineered Materials (EM)
= Engineered Materials
+ RPC’s Canadian films business
- International flexible business (to CPI)
46
Note: Dollars in millionsNon-GAAP Financial Measures
Actual Guidance
FY 2015 FY 2016 FY 2017 FY 2018 FY 2019 FY 2020
Cash flow from operations $637 $857 $975 $1,004 $1,201 $1,450
Capital expenditures, net (162) (283) (263) (333) (399) (620)
Payment of tax receivable agreement (39) (57) (111) (37) (38) -
Free cash flow $436 $517 $601 $634 $764 $830
47
Note: Dollars in millionsNon-GAAP Financial Measures
Fiscal Year 1999 2004 2009 2014 2019
U.S. GAAP Operating income $34 $94 $186 $316 $974
(2)
Add: restructuring and transaction activities 5 6 11 30 (132)
Add: business optimization and other costs (1) 2 - 39 81 75
Add: depreciation & amortization 31 61 254 358 613
Operating EBITDA $72 $161 $490 $785 $1,530
Fiscal Year 2014 2015 2016 2017 2018 2019
Net income per diluted share $ 0.51 $ 0.70 $ 1.87 $ 2.54 $ 3.67 $ 3.00
Other expense (income) 0.20 0.52 (0.18) 0.03 0.18 1.15
Non-cash amortization 0.25 0.17 0.24 0.24 0.21 0.21
Restructuring and transaction activities (2) 0.17 0.07 0.26 0.18 0.27 (0.98)
Other non-cash charges - - 0.38 0.22 0.04 0.29
Business optimization 0.43 0.24 0.20 0.13 0.13 0.05
Tax reform adjustments, net - - - - (0.92) -
Income tax impact on items above - - (0.29) (0.25) (0.21) (0.31)
Adjusted net income per diluted share $ 1.56 $ 1.70 $ 2.48 $ 3.09 $ 3.37 $ 3.41
Note: Dollars in millions, except per share data
(1) Includes integration expenses and other business optimization costs. 48
(2) Primarily includes expenses related to acquisitions and gains related to the sale of assets.Non-GAAP Financial Measures
Operating Depreciation & Restructuring & Operating LTM Operating
(2) (1)
Quarterly Period Income Amortization Transaction Activities Other EBITDA Net Sales EBITDA Margins
Sept '17 199 138 7 6 350 1,881
Dec '17 163 129 13 5 310 1,776
Mar '18 188 132 15 15 350 1,967 18.2%
Jun '18 216 136 15 7 374 2,072 18.0%
Sept '18 194 141 10 1 346 2,054 17.5%
Dec '18 176 138 13 4 331 1,972 17.4%
Mar '19 185 132 22 15 354 1,950 17.5%
Jun '19 215 127 - 6 348 1,937 17.4%
Sept '19 398 216 (162) 45 497 3,019 17.2%
Dec '19 199 216 18 18 451 2,818 17.0%
Mar '20 284 213 19 23 539 2,975 17.1%
Jun '20 347 209 19 6 581 2,910 17.6%
Note: Dollars in millions
LTM operating EBITDA margins calculated by dividing the sum of the previous four quarters operating EBITDA by the sum of the previous four quarters net sales
(1) Primarily includes other non-cash charges, such as stock compensation expense.
49
(2) Primarily includes expenses related to acquisitions and transaction activities.Dustin M. Stilwell
Director, Head of Investor Relations
Berry Global Group, Inc.
101 Oakley Street, 3rd floor
P. O. Box 959
Evansville, IN 47706
Tel: +1.812.306.2964
ir@berryglobal.com
www.berryglobal.com
50You can also read