FULL YEAR RESULTS 2018 - 28 AUGUST 2018
←
→
Page content transcription
If your browser does not render page correctly, please read the page content below
FULL YEAR RESULTS 2018
28 AUGUST 2018
DISCLAIMER
This investor presentation (Presentation) has been prepared by Orocobre Limited (the Company or Orocobre). It contains general information about the Company as at the date of this
Presentation.

The information in this Presentation should not be considered to be comprehensive or to comprise all of the material which a shareholder or potential investor in the Company may require
in order to determine whether to deal in shares. The information in this Presentation is of a general nature only and does not purport to be complete.

This Presentation does not take into account the financial situation, investment objectives, tax situation or particular needs of any person and nothing contained in this Presentation
constitutes investment, legal, tax or other advice, nor does it contain all the information which would be required in a disclosure document or prospectus prepared in accordance with the
requirements of the Corporations Act. Readers or recipients of this Presentation should, before making any decisions in relation to their investment or potential investment in the Company,
consider the appropriateness of the information having regard to their own objectives and financial situation and seek their own professional investment, legal and taxation advice
appropriate to their particular circumstances.

This Presentation is for information purposes only and does not constitute or form part of any offer, invitation, solicitation or recommendation to acquire, purchase, subscribe for, sell or
otherwise dispose of, or issue, any entitlements, shares or any other financial product. Further, this Presentation does not constitute financial product or investment advice (nor tax,
accounting or legal advice), nor shall it or any part of it or the fact of its distribution form the basis of, or be relied on in connection with, any contract or investment decision.

The distribution of this Presentation in other jurisdictions outside Australia may also be restricted by law and any restrictions should be observed. Any failure to comply with such restrictions
may constitute a violation of applicable securities laws.

Certain statements in this Presentation are forward-looking statements. You can identify these statements by the fact that they use words such as “anticipate”, “estimate”, “expect”,
“project”, “intend”, “plan”, “believe”, “target”, “may”, “assume”, "should", "could", "predict", "propose", "forecast", "outlook" and words of similar import. Indications of, and guidance on,
future earnings and financial position and performance are also forward-looking statements. Forward-looking information may include, but is not limited to, the successful ramp-up of the
Olaroz Project, and the timing thereof; the design production rate for lithium carbonate at the Olaroz Project; impacts of weather and climatic conditions, the expected brine grade at the
Olaroz Project; the Olaroz Project’s future financial and operating performance, including production, rates of return, operating costs, capital costs and cash flows; the comparison of such
expected costs to expected global operating costs; the ongoing working relationship between Orocobre and the Provinces of Jujuy and Salta in Argentina; the on-going working relationship
between Orocobre and the Olaroz Project's financiers, being Mizuho Bank and JOGMEC and the satisfaction of lending covenants; the future financial and operating performance of the
Company, its affiliates and related bodies corporate, including Borax Argentina S.A. (Borax Argentina); the estimation and realisation of mineral resources at the Company’s projects; the
viability, recoverability and processing of such resources; timing of future exploration of the Company’s projects; timing and receipt of approvals, consents and permits under applicable
legislation; trends in Argentina relating to the role of government in the economy (and particularly its role and participation in mining projects); adequacy of financial resources, forecasts
relating to the lithium, boron and potash markets; potential operating synergies between the Cauchari Project and the Olaroz Project; the potential processing of brines from the Cauchari
Project and the incremental capital cost of such processing, expansion, growth and optimisation of Borax Argentina’s operations; the integration of Borax Argentina’s operations with those
of Orocobre and any synergies relating thereto and other matters related to the development of the Company’s projects and the timing of the foregoing matters.

                                                                                                                                                                                         2
DISCLAIMER (CONT.)
Forward-looking statements are based on current expectations and beliefs and, by their nature, are subject to a number of known and unknown risks and uncertainties that could cause the
actual results, performances and achievements to differ materially from any expected future results, performances or achievements expressed or implied by such forward-looking
statements, including but not limited to, the risk of further changes in government regulations, policies or legislation; that further funding may be required, but unavailable, for the ongoing
development of the Company’s projects; fluctuations or decreases in commodity prices; uncertainty in the estimation, economic viability, recoverability and processing of mineral resources;
risks associated with development of the Olaroz Project; unexpected capital or operating cost increases; uncertainty of meeting anticipated program milestones at the Olaroz Project or the
Company’s other projects; risks associated with investment in publicly listed companies, such as the Company; risks associated with general economic conditions; the risk that the historical
estimates for Borax Argentina’s properties that were prepared by Rio Tinto, Borax Argentina and/or their respective consultants (including the size and grade of the resources) are incorrect
in any material respect; the inability to efficiently integrate the operations of Borax Argentina with those of Orocobre; as well as those factors disclosed in the Company’s Annual Report for
the financial year ended 30 June 2017 and Sustainability Report 2017 available on the ASX website and at www.sedar.com.

No representation, warranty or assurance (express or implied) is given or made by the Company that the forward-looking statements contained in this Presentation are accurate, complete,
reliable or adequate or that they will be achieved or prove to be correct.

Subject to any continuing obligation under applicable law or relevant listing rules of the ASX, the Company disclaims any obligation or undertaking to disseminate any updates or revisions to
any forward-looking statements in this Presentation to reflect any change in expectations in relation to any forward-looking statements or any change in events, conditions or circumstances
on which any such statements are based. Nothing in this Presentation shall under any circumstances create an implication that there has been no change in the affairs of the Company since
the date of this Presentation.

US investors should note that while the Company's reserve and resource estimates comply with the JORC Code, they may not comply with Industry Guide 7, which governs disclosures of
mineral reserves in registration statements filed with the US Securities and Exchange Commission (SEC). In particular, Industry Guide 7 does not recognise classifications other than proven
and probable reserves and, as a result, the SEC generally does not permit mining companies to disclose their mineral resources in SEC filings. You should not assume that quantities reported
as “resources” will be converted to reserves under the JORC Code or any other reporting regime or that the Company will be able to legally and economically extract them.
To the maximum extent permitted by law, the Company, the lead manager and their respective related bodies corporate and affiliates, and their respective directors, officers, partners,
employees, agents and advisers expressly disclaim all liability (including without limitation, liability for negligence) for any direct or indirect loss or damage which may be suffered by any
person in relation to, and take no responsibility for, any information in this Presentation or any error or omission therefrom, and make no representation or warranty, express or implied, as
to the currency, accuracy, reliability or completeness of the information contained in this Presentation.

By attending an investor presentation or briefing, or by accepting, accessing or reviewing this Presentation, you acknowledge and agree to the terms set out in this disclaimer.

                                                                                                                                                                                       3
A STRONG OPERATING RESULT
Record prices and margins, strong cashflow                                                                                      Price (US$/tonne)

                                                                                                                                                                                      12,578
Sales de Jujuy Joint Venture (Olaroz)                                                                                                  Up 29%

• Record full year revenue up 24% to US$148.9 million on sales of 11,837 tonnes                                                                                 9,763

• Record Olaroz sales price of US$12,578 / tonne FOB1, price received FY19 year                                                                        AverageFY17
                                                                                                                                                              price received (US$/tonne)
                                                                                                                                                                              FY18
  to date of approximately US$14,000 / tonne

• Cost of sales of US$4,194 / tonne2 and record gross cash margin of US$8,384 /                                                 Margin (US$/tonne)
  tonne                                                                                                                                                                                8,384
                                                                                                                                       Up 39%
                                                                                                                                                                6,053
• EBITDAIX3 of US$94.6 million, up 33% on previous corresponding period

• Olaroz was again strongly cashflow positive internally funding US$40 million of
                                                                                                                                                         Gross FY17
                                                                                                                                                               cash margin (US$/tonne)
                                                                                                                                                                              FY18
  early works on Stage 2 expansion

Orocobre                                                                                                                        EBITDAIX (US$M)
• Record underlying net profit of US$25.7 million, statutory Group net profit of                                                                                                         95
                                                                                                                                       Up 33%
  US$1.9 million after Borax impairment of US$8 million and other items of
                                                                                                                                                                  71
  US$15.8 million

• Orocobre group cash balance at 30 June 2018 of US$316.7 million, and net cash
  of US$229 million                                                                                                                                               EBITDAIX
                                                                                                                                                                  FY17     (US$M)FY18

                                1.   Orocobre reports price as “FOB” (Free On Board) which excludes additional insurance and freight charges included in “CIF” (Cost, Insurance and Freight or delivered to
                                     destination port) pricing. The key difference between an FOB and CIF agreement is the point at which responsibility and liability transfer from seller to buyer. With a FOB
                                     shipment, this typically occurs when the goods pass the ship’s rail at the export port. With a CIF agreement, the seller pays costs and assumes liability until the goods reach
                                     the port of destination chosen by the buyer. The Company’s pricing is also net of Toyota Tsusho commissions. The intention in reporting FOB prices is to provide clarity on the
                                     sales revenue that flows back to SDJ, the joint venture company in Argentina
                                2.   Excludes royalties and head office costs                                                                                                                           4
                                3.   See Notes page
FINANCIALS
OLAROZ JOINT VENTURE STRUCTURE
                             • TTC owns 15% of ORE issued
                               capital

                             • SDJ Joint Venture is equity
                               accounted due to the control
                               structure in the Group’s financial
                               report

                             • Proportionally consolidated
                               results have been prepared to
                               indicate contribution of
                               underlying operations

                             • The JEMSE and Toyota Tsusho
                               interests in Sales de Jujuy Pte. Ltd
                               are recognised as a Non-
                               Controlling Interests (NCI)

                                                            6
OLAROZ STRONGLY PROFITABLE IN FY18
                                                                                                                          •   Olaroz sales of 11,837 tonnes of lithium
Proportionally Consolidated P & L                                                                                             carbonate at average of US$12,578/t
Proportionally Consolidated P&L                     ORE Group          SDJ PTE Eliminate         Add back Consolidated    •   Olaroz cash operating costs of
                                                     Statutory          (100%) NCI of PTE          equity Group incl          US$4,194/tonne (excluding royalties and
                                                       Results                               accounting of         PTE        head office costs)
                                                                                                PTE profit                •   Gross cash margins of US$8,384/tonne
                                                          US$M           US$M           US$M       US$M          US$M         (67%)
                                                                                                                          •   ORE Group EBITDAIX includes profit on the
Revenue                                                     17.4         148.9          (49.9)               -   116.4        sale of exploration assets of US$2.1M
            *                                                                                                             •   ORE’s corporate costs US$8.8m inclusive of
EBITDAIX                                                   (9.4)           94.6         (31.2)               -    54.0        transaction costs, share based payments
Depreciation & amortisation                                (1.8)           (8.8)           2.4               -    (8.2)       and additional employee costs
       **
EBITIX                                                    (11.2)           85.8         (28.8)               -    45.8    •   Depreciation costs of US$741/tonne
Interest                                                     4.3         (13.0)            4.3               -    (4.4)   •   Financing costs of US$13M include interest
      ***
EBTIX                                                      (6.9)           72.8         (24.5)               -    41.4        from project funding and working capital
Foreign currency losses                                                                                                       and accrued interest of shareholder loans.
                                                           (3.0)         (10.1)            3.4               -    (9.7)
Impairment                                                 (8.0)              -              -               -    (8.0)   •   Foreign exchange loss increase resulted
Share of profit of joint ventures, net of                                                                                     from the effect of the USD strengthening
tax                                                         19.8               -              -         (19.8)        -       against the AUD and ARS mainly related to
                                                                                                                              the VAT balances which are peso based.
Total profit/(loss) for the year before
tax                                                          1.9           62.7         (21.1)          (19.8)    23.7    •   Borax took an impairment of US$8M.
Income tax expense                                              -        (31.9)           10.1               -   (21.8)   •   Share of net loss from Advantage Lithium
Total profit/(loss) for the year after tax                   1.9           30.8         (11.0)          (19.8)     1.9        Corp (associate) of US$1.5M
                                                                                                                          •   Income tax expense of US$31.9M due to
                                                                                                                              changes in Argentine tax legislation related
                                                                                                                              to future withholding tax on dividends and
 *EBITDAIX, **EBITIX, and ***EBTIX are non audited, non IFRS measures, refer to slide in the appendix
                                                                                                                              the impact of devaluation on ARS
                                                                                                                              denominated carried forward losses
                                                                                                                              partially offset by benefit from tax rates
                                                                                                                              reduction in Argentina.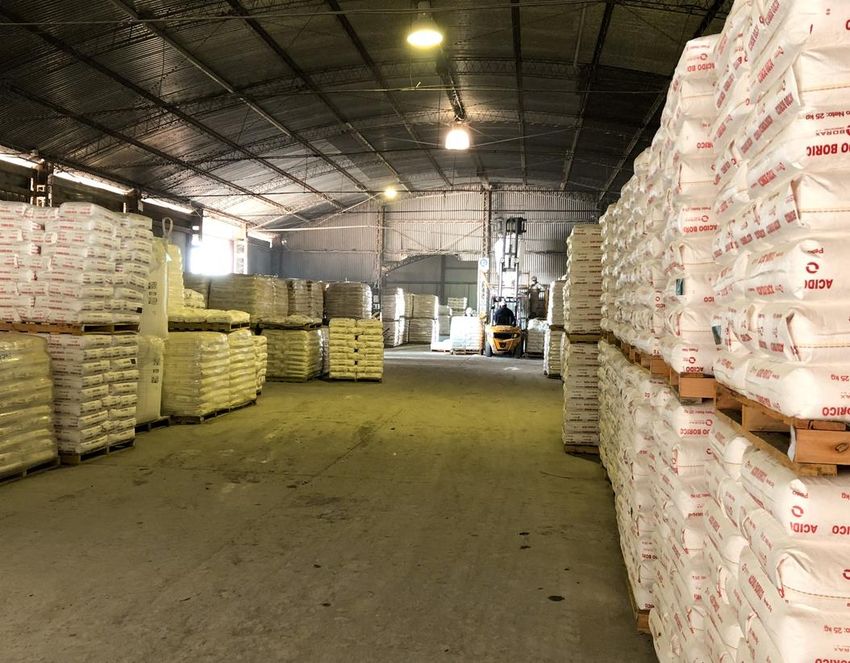
UNDERLYING ATTRIBUTABLE PROFIT (ORE SHARE)

                                         8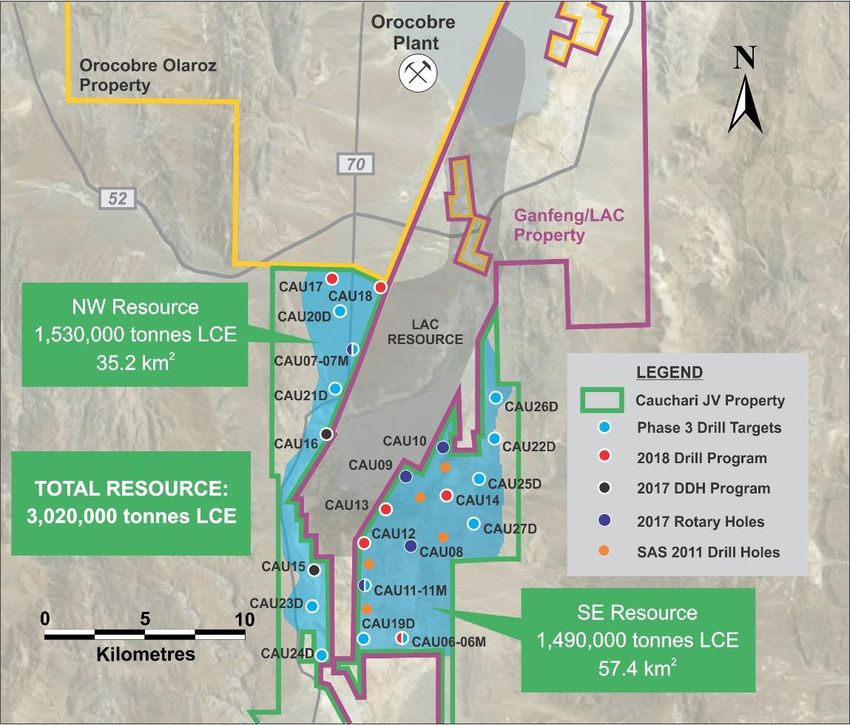
A STRONGER BALANCE SHEET
Proportionally Consolidated Balance Sheet                                                                                            Increase in cash and cash equivalents of US$275.4M mainly due to
                                 ORE Group              Eliminate ORE                                                  % Variance    strategic placement and rights issue.
 Proportionally Consolidated                  SDJ PTE                  Eliminate NCI of Consolidated Consolidated
                                  Statutory                 Group PTE                                                movement for
 Balance Sheet                                 (100%)                      PTE (33.5%) Group incl PTE Group incl PTE
                                    Results              related items                                                      period
 US$ million                          FY18      FY18              FY18            FY18          FY18           FY17 FY18 vs FY17
 Current assets

 Cash and cash equivalents          316.7      19.5                -            (6.5)        329.7          54.3            507%     Decrease in VAT receivable due to Peso devaluation and VAT
 Trade and other receivables         52.2      11.1           (44.7)            (3.7)         14.9          14.6              2%     recoupment.
 Inventory                            6.5      31.5                -           (10.5)         27.5          21.3             29%
 VAT receivable                       0.2      10.8                -            (3.6)          7.4          12.8            -42%
 Other                                   -      7.2                -            (2.4)          4.8          12.4            -61%
 Total current assets               375.6      80.1           (44.7)           (26.7)        384.3         115.4            233%
                                                                                                                                     Decrease of other assets due to the SBLC release back of
 Non-current assets                                                                                                                  US$9.8M.

 Plant and equipment                  0.1       339.7                          (99.0)        240.8         246.9             -2%
 Development assets                   7.4          -               -                -          7.4           1.5            393%     Increase in development of assets due to investment in Cauchari,
 Investment in joint ventures        84.8          -          (84.8)                -             -             -             -
                                                                                                                                     Hydroxide plant and exploration properties.
 Investment in associates            20.0          -               -                -         20.0          21.5             -7%
 Inventory                            0.7      34.6                -           (11.6)         23.7          13.5             76%
 Trade and other receivables         33.1       1.0           (23.5)            (0.4)         10.2           9.7              5%
 Other                                1.1      34.6                -           (10.5)         25.2          12.9             95%     Increase in inventory at Olaroz largely due to build up of stock level
 Total non-current assets           147.2     409.9          (108.3)         (121.5)         327.3         306.0              7%     of brine inventory, finished goods, reagents and spare parts.
 Total assets                       522.8     490.0          (153.0)         (148.2)         711.6         421.4              69%

 Current liabilities                                                                                                                 Increase in other non-current assets due to restricted cash at SDJ
                                                                                                                                     (DSRA) partially guaranteeing project loan.
 Trade and other payables             7.5      27.2             (7.1)           (6.7)         20.9          16.1              30%
 Loans and borrowings                 0.7     109.2           (37.6)           (24.0)         48.3          43.7              11%
 Other                                0.6       1.3                 -           (0.4)          1.5           6.9             -78%    Reduction of borrowings due to the net pay down of working capital
 Total current liabilities            8.8     137.7           (44.7)           (31.1)         70.7          66.7               6%    facilities and project loan.
 Non-current liabilities

 Trade and other payables             0.6       1.5             (0.9)           (0.2)          1.0           3.4            -71%
                                                                                                                                     Increase in deferred tax liabilities due to the net accounting impact
 Loans and borrowings                    -    133.9           (22.6)           (37.2)         74.1          92.2            -20%     from changes to Argentina tax law of US$9M and the net impact of
 Deferred tax liability                  -     60.6                 -          (18.4)         42.2          17.8            137%     devaluation on peso carry forward losses of US$3.5M. Whilst the
 Other                               11.3      15.3                 -           (5.1)         21.5          23.3             -8%     Income Tax rate in Argentina will progressively reduce from 35% to
 Total non-current liabilities       11.9     211.3           (23.5)           (60.9)        138.8         136.7              2%     25% by 2020 resulting in a tax benefit of US$3.5M, a dividend
                                                                                                                                     withholding tax to foreign shareholders of 7% was introduced in
 Total liabilities                   20.7     349.0           (68.2)           (92.0)        209.5         203.4               3%
                                                                                                                                     2018 gradually increasing to 13% by 2020 which resulted in a
 Net assets                         502.1     141.0           (84.8)           (56.2)        502.1         218.0            130%     permanent difference of US$13M in the FY18 tax expense.
                                                                                                                                     Excluding these items and other accounting related permanent
                                                                                                                                     differences the effective tax rate for the period was 35% at SDJ.

                                                                                                                                                                                                   9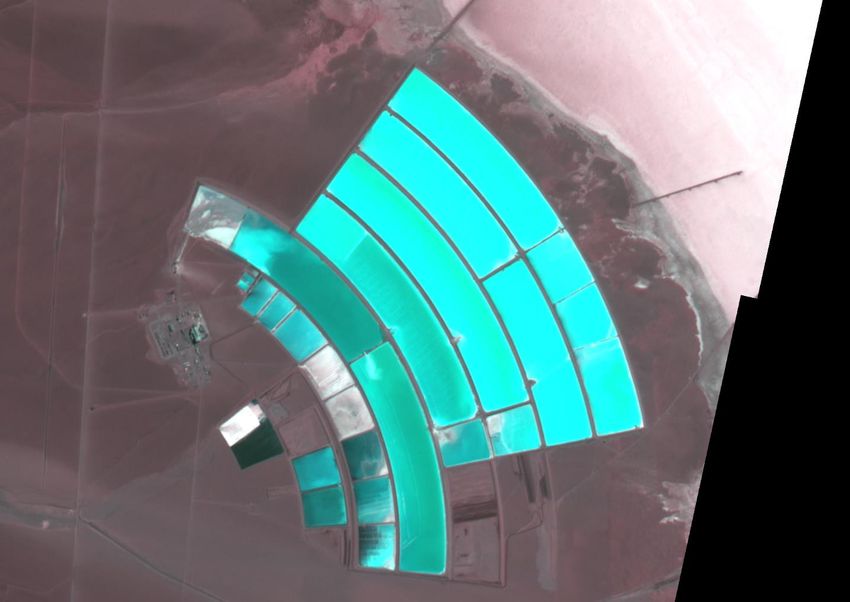
POSITIVE OPERATIONAL CASHFLOWS
Proportionally Consolidated Cashflow
                                                   ORE Group                   Eliminate ORE
Proportionally Consolidated Cash Flow                                                         Eliminate NCI of Consolidated
                                                    Statutory SDJ PTE (100%)       Group PTE
Statement                                                                                                 PTE Group incl PTE
                                                      Results                   related items

Full year ended 30 June 2018                                                    US$ million

Cash flows from operating activities
Receipts from customers                              14.3         148.0                 -          (49.6)         112.7
                                                                                                                               Strong cash inflows generated by Olaroz as higher average prices were
Payments to suppliers and employees                 (28.9)       (102.6)                -           34.4          (97.1)
                                                                                                                               achieved
Interest received / paid                              0.6           (0.6)               -            0.2            0.2
VAT recouped                                             -         18.0                 -           (6.0)          12.0
                                                                                                                               VAT recouped at SDJ of US$18M during the period translating to
Other cash receipts                                      -           8.3                -           (2.8)           5.5
                                                                                                                               Orocobre’s share of US$12M.
Net cash used in operating activities               (14.0)         71.1                 -          (23.8)          33.3

Cash flows from investing activities                                                                                           Development expenditure of assets due to investment in Cauchari,
Payments for development expenditure                 (6.5)             -                -              -            (6.5)      Hydroxide plant and exploration properties.
Proceeds from sale of assets                          3.3              -                -              -             3.3
Purchase of plant and equipment                      (1.6)        (21.7)                -            7.3           (16.0)
Investment in joint ventures                         (8.3)             -             8.3               -                -
                                                                                                                               Proceeds from sale of exploration assets
Net cash used in investing activities               (13.1)        (21.7)             8.3             7.3           (19.2)

Cash flows from financing activities                                                                                           Cash outflow is due to project loan guarantee at Olaroz, partially offset
Release of standby letters of credit                  9.8         (17.2)                             5.8            (1.6)      by release of SBLC from working capital facility.
Proceeds from issue of shares net of transaction
                                                   284.2           12.4             (8.3)           (4.1)         284.2
costs
Proceeds from borrowings                              0.8              -                -              -             0.8       Proceeds from strategic placement and rights issue partially offset by
                                                                                                                               transaction costs
Repayment of borrowings net of Proceeds              (1.0)        (29.3)                -            9.7           (20.6)

Loan to joint venture partners                       (1.0)             -                -              -            (1.0)
Loan to joint ventures                               (0.5)             -                -              -            (0.5)      Net repayment of borrowing at 100% in SDJ includes debt principal and
                                                                                                                               interest payments of US$28.6M of project loan.
Net cash provided by financing activities          292.3          (34.1)            (8.3)           11.4          261.3

Net increase in cash and cash equivalents          265.2           15.3                 -           (5.1)         275.4

Cash and cash equivalents, net of overdrafts, at
                                                     51.6            4.1                -           (1.4)           54.3
the beginning of year
Effect of exchange rates on cash holdings in
                                                     (0.1)             -                -              -            (0.1)
foreign currencies
Cash and cash equivalents, net of overdrafts, at
                                                   316.7           19.4                 -           (6.5)         329.6
the end of year

                                                                                                                                                                                                           10
OLAROZ REPAYING DEBT & RELEASING CASH
160.0
• Increases in production and
revenues during the fiscal year
resulted in strong operating cash
12.3 inflows from EBITDAIX
-6.9
120.0 18.0 • Capital increase is a JV equity
contribution for the establishment
-22.3 -0.7
of the debt service reserve account
94.6
(DSRA) for Mizuho/JOGMEC project
financing
US$ M
80.0 -19.5
• VAT net reimbursement of
-14.9 US$3.1M
• Financing costs and project finance
-17.1 principal and interest payments net
-7.4 from cashflow
40.0 -1.4
-7.2
• Capex includes expansion costs of
-12.1
US$5.3M
15.4 • Restricted cash relates to the debt
0.0 service reserve account
• Brine inventory includes higher well
pump rates building up volume for
Stage 2 and heavy secondary liming
of high magnesium pond 4B in the
first half
* Excludes depreciation 11STRONG CASHFLOW REDUCING PROJECT DEBT
Olaroz Project Facility (100%)
200 • ~US$70M principal of the Project Debt
(~37% reduction) repaid by 10 September
180
2018 and US$17.1M paid into DSRA
• Project Debt balance reducing to
160 ~US$122M during September 2018
(US$105M net of DSRA)
Millions
140
• Project Debt repayments scheduled every
six months to September 2024
120
• Project Debt incurs a low average interest
100 rate of ~4.25%
• Orocobre proportional net cash of
US$229.1M at 30 June 2018 (net debt
US$62.5M at 30 June 2017)
12ACCUMULATED INFLATION VS DEVALUATION
Feasibility study costing
• The Argentine peso (ARS) has devalued approximately 620% from December 2010 through June 2018. The
Argentine peso devaluation has shown a significant increase from April 2018 of approximately 43%
• Over recent years devaluation being less than inflation has increased cost pressure on both Olaroz and Borax. The
recent devaluation has brought the Peso back in line with long term inflation decreasing cost pressures
• Devaluation also reduces the amount of ARS based balances such as VAT, carry forward tax losses, prepayments
and account payables which have an impact in FX
• US$ versus ARS cash costs are approximately 55/45 at Sales de Jujuy and 40/60 to Borax Argentina.
13OROCOBRE GROWTH PROJECTS
STAGE 2 EARLY WORKS WELL UNDERWAY
• Stage 2 early works include new ponds, roads, vegetation
  clearing, drilling, camp infrastructure and engineering
• US$40 million has been committed from operating
  cashflow prior to FID (total capex remains US$285 million)
• FID expected shortly
Capacity         •   25,000 tonnes primary grade lithium carbonate
                 •   Total Olaroz capacity of 42,500 tonnes of lithium carbonate
                 •   Product mix to be 17,500 tonnes purified lithium carbonate and
                     25,000 tonnes primary lithium carbonate, of which 9,500 tonnes
                     will be converted to 10,000 tonnes lithium hydroxide
Commissioning    •   1H CY2020

Run-rate         •   Less than Stage 1 operating costs as no purification circuit
operating cost
Capital costs    •   Total development capital – US$285 million (excluding VAT of
                     c. US$42 million) but including crystallisers for both stages

Construction     •   Early works commenced, remainder subject to Orocobre and JV
                     Board approvals and commencing following confirmation of
                     project financing, approvals and EPCM arrangements
                 •   Construction expected to be completed during 2H CY2019
Approvals        •   Pond and related infrastructure construction approval obtained
                 •   Processing plant construction approval received

                                                                                      15
POND CAPACITY GROWING AHEAD OF PRODUCTION
Ponds under going salt harvesting
• Total new pond areas of approximately
9km2, increasing pond system to
>13km2
• Two new ponds have been filled
• A further four ponds are currently
under construction
Ponds account for 50% of capital
(US$m, 100% Olaroz)
Wells and Ponds 140
Processing 67
Other (including crystallisers) 53
Contingency 25
Total (ex VAT) 285
New ponds under construction New ponds already filled New ponds under construction
16LITHIUM HYDROXIDE PLANT UPDATE
Orocobre & TTC continue to progress the Lithium Hydroxide Plant which will further enhance Orocobre’s strong margins
Lithium Hydroxide market Update
• Long-term battery grade hydroxide prices (2017-2030) are forecast • The LiOH Plant will process Li2CO3 from Olaroz and deliver value-added
to maintain a US$2,500 per tonne premium to battery grade LiOH to customers agreed between Orocobre and Toyota Tsusho
carbonate
• Estimated capital cost of US$60-70 million (pre subsidies and financing) for
• Nickel based cathodes (NMC and NCA formats) are forecast to a 10,000 tpa LiOH plant which will deliver premium product at premium
account for ~80% of the total cathodes market by 2025 up from pricing
~33% in 2017
‒ Provides product diversification suitable for different battery
• Naraha will gain first-mover advantage in Japan with no current or technologies
announced hydroxide capacity in the country to date
‒ Ownership to match current Olaroz ownership proportions (excluding
• A shortfall of approximately 80ktpa LCE in hydroxide capacity is JEMSE)
currently forecast for 2025
‒ Potential for significant margin growth on primary Li2CO3 converted
• The size of the nickel-based cathode market is forecast to grow from to LiOH
~80Gwh in 2017 to 816Gwh by 2025
• Operating costs estimated to be approximately US$1,500/tonne, down
from initial estimate of US$2,500/tonne
• Subsidies of US$27 million have been secured from the Japanese
government
• Orocobre and Toyota Tsusho are targeting commissioning during H1
CY2020
17ADVANTAGE LITHIUM / CAUCHARI JV
Advantage Lithium (AAL)
Orocobre hold ~33.5% of AAL issued shares
Cauchari Project (25% ORE, 75% AAL)
• Advantage has released a preliminary study into the
technical and economic viability of the project in
accordance with Canadian standards*
• +6-fold increase of the inferred resource to 3.02 Mt LCE at
Cauchari at 450 mg/l Lithium
• The updated resource covers a significantly larger area and
extends to greater depths in the NW and SE Sectors
• Significant potential for additional resource expansion at
depth
• The brine has excellent chemistry for processing and the
Mg/Li ratio averages 2.5, very similar to Orocobre’s Olaroz
project
• Phase 3 drilling is underway to upgrade this inferred
resource and underlying brine to measured and indicated
resources for the definitive feasibility study (DFS)
scheduled for completion in Q2 2019
* As Inferred resources were the basis of the subject study there is a low level
of geological confidence and no certainty that production targets stated in the
study will be realised
18BORAX ARGENTINA
BORAX ARGENTINA

•   Sales for the full year of US$17.4 million
    (2017 US$17.2 million)
•   EBITDAIX breakeven excluding asset sale
    (2017: US$1.7 million net loss)
•   Production performance improving with
    lower unit costs and benefiting from recent
    Peso devaluation
•   Impairment of US$8 million reduces carrying
    value of plant and equipment to nil
•   Trading conditions are improving – last four
    months sales are up 12% yoy
•   Significant value exists in the assets and
    Tincalayu expansion studies are under
    review regarding a production increase from
    30ktpa to 100-120 ktpa borax decahydrate
    equivalent

                                                   20
MARKETS
LONG TERM FUNDAMENTALS OUTWEIGH SHORT
TERM VOLATILITY
Short-term Factors                        Long-term Factors

1. Frequent shifts in Chinese EV policy   1.   Government Mandates, Quotas & Subsidies
2. Seasonal Chinese production            2.   Car Manufacturer commitments to grow EV sales, models and share of fleet
3. Chinese spot price volatility          3.   Battery Capacity Announcements
4. Inventory levels                       4.   Growing investment in EV charging infrastructure
                                          5.   Improving battery technology e.g. lowering cost of battery, increasing range of
                                               EV’s, increase size of battery
                            Long Term     6.   Improving Total Cost of Ownership for Drivers
                          Fundamentals
                                          7.   Wider range of EV models appealing to consumer tastes
                                          8.   Volatility of oil/diesel price vs. long-term improvements in charging
        Short Term                             technology, speed and availability
         Volatility
                                          9.   Broader Environmental Policy e.g. CO2 Emission
                                          10. Accelerating growth in Energy Storage Systems
                                          11. Government initiatives to shift public transport to electrified modes
                                          12. Historical ramp-up profile of supply projects
                                          13. High degree of technical expertise required to achieve sustainable, consistent
                                               lithium operations & high quality
                                                                                                                       22
CHINESE SPOT vs CONTRACT PRICES
Jan 2018: New EV subsidies announced
Lithium Carbonate Import Prices of Key Markets CIF (USD/t) &
supporting a change in battery technology
Chinese Lithium Carbonate 'spot' price Delivered Ex-VAT (USD/T) toward higher range & energy density.
April 2016: Reports emerge of Chinese Minimum range required for subsidy
April 2017 – December 2017: Chinese
car manufacturers fraudulently increased from 100km to 150km.
Govt introduces revised EV subsidy
claiming EV subsidies resulting in the but remains under review. Feb-June 2018: Transition period
removal of financial incentives. allowing for ‘retooling’. A reduced
subsidy of 14,000 yuan (versus 15,000
$25,000 yuan) provided for EVsSPODUMENE CONCENTRATE IMPORTS CONTINUE
DESPITE THE CONVERSION BOTTLENECK
1
Key Factors contributing to continued inventory build in China: CY 2016 Hard Rock Imports Jan-May 2018 Hard Rock Imports
2x
1. Misalignment between conversion capacity and ramp up of 7%
hard rock projects; and Conversion capacity cannot keep 28%
2. Conversion plants requiring additional time to adjust pace with imports of Australian
and Canadian hard rock.
operations and qualify the converted product from new hard 72%
93%
rock supply with different grade to historical imports
Inventory Converted Inventory Converted
Chinese Hard Rock Imports 2017 - 2018
100
2
80 Grade of Jan-May 2018 Hard Rock
Grade of CY 2016 Hard Rock
imports 2x Imports
60
Like brine, hard rock projects 31%
40 require time to reach desired
100% quality of converters.
69%
20
0
2017 Inventory 2018 Jan-May 2018 Imports 2018 + 2017 6%
6%
Aust & Can. Converted at Imported
Hard Rock 2017 Utilisation Inventory
Imports Rate
Source: Chinese Customs Data, Australian Port Data
24CHINESE SPOT vs CONTRACT PRICES
Chinese Spot Price Contract
Term of contract Single purchase, ~30t lots Quarterly, Bi-annual, Annual, Up to 10 years
Suppliers Smaller &/or lower quality Chinese producers, high South American producers e.g. ALB, SQM, FMC, ORE;
cost & contaminants e.g. Chinese brine, lepidolite, Large Chinese producers e.g. Tianqi, Ganfeng
domestic mineral, Converted new Australian
concentrate & DSO
Primary Customers Traders, compounders, small converters, small Medium to large cathode & anode customers
cathode & anode customers, small ceramic & glass internationally, large car & battery manufacturers
Est Share ~2016-2018 5-10% of market 90-95%
Seasonality & Key Short-term fundamentals. Long-term fundamentals including Government
Drivers Due to the small size of the Chinese spot market, mandates, Car manufacturer targets, Environmental
price is volatile & highly sensitive to short-term protection policy.
changes including inventory levels, weather,
environmental policy, China EV policy, plant
maintenance.
Albemarle, Luke Kissim, Q2’18 results: ‘because of our long-term FMC, Paul W.Graves, Q2’18 results: ‘I'll keep making the point
contract strategy, Chinese spot pricing has no impact on until I maybe go blue in the face that the Chinese spot market
our pricing and you shouldn't see a correlation. I think this for carbonate is not a really very useful market. Even if it is a
quarter, really, you begin to see that as the Chinese spot pricing is market to look at, it carries very little informational content for
down and our pricing is up year-over-year. So we think that's a the overall state of the market or what customers are looking
validation and we will continue to see that.’ for with their own contracting strategies. So while I recognize
that people pick up on that data, it's leading everybody down
the wrong path as to what the true fundamentals of the
market are.
25CHINESE EV SUBSIDIES NOW HIGHER FOR LONGER
RANGE VEHICLES OF THE FUTURE
Comparing EV Policy 2017 vs 2018
50000
45000 2017 Average Weighted Range for
Global fleet of BEV = 245km
Subsidy (Yuan)
44000
36000
34000
24000
20000
15000
0 50 100 150 200 250 300 350 400 450 500
EV Range km
2018 Subsidy 2017 Subsidy
Key Changes in subsidies Minimum range increased from 100 to 150km Greater incentives provided for EV’s over 300km range
Energy Density
4
Subsidy for per vehicle (Yuan) = 2018 subsidy
Subsidy standard regarding range per charge × supports nickel 3
Battery energy density adjustment factor × based cathodes Cost 2 Range
vehicle energy consumption adjustment factor. due to superior 1
Subsidy limit for per unit battery energy does not energy density NMC
exceed 1,200 yuan/kWh. and range LFP
Life Span Safety
Source: Benchmark Minerals June 2018; Industrial Minerals; Avicienne; International Energy Agency, ‘World Energy Investment 2018’ 26FUTURE LITHIUM DEMAND IS SUPPORTED BY GOVT,
BATTERY & CAR MANUFACTURERS PLANS
Lithium demand under various scenarios (LCE tpa)
1,600,000
‘EV30@30’ campaign aims to achieve 30% EV
penetration by 2030 by addressing consumer
1,400,000 4 attitudes – e.g. increased EV infrastructure,
improved range
1,200,000 Car manufacturer commitments to sales targets,
3
models & share of fleet
1,000,000
2 Battery Capacity announcements
800,000 Government mandates impact approximately 70%
of the global car stock and include policies
600,000 implemented by China, the European Union, India,
1
Japan, Netherlands, Norway, France, Slovenia, New
Zealand, Korea, Finland, Netherlands, United
400,000 States, Other European Union, United Kingdom
200,000 Ex-auto demand growth driven by energy storage
system (ESS)
0
2017 2018F 2019F 2020F 2021F 2022F 2023F 2024F 2025F
Demand Ex-Auto Government Mandates
Battery Capacity Announcements Car Manufacturer Targets
EV30%@2030 ORE (pessimistic) demand forecast
Source: Benchmark Minerals; International Energy Agency, ‘Electric Vehicle Outlook 2018’, Company AnnouncementsTHE VALUE OF CONSUMER-TARGETED GOVERNMENT
INITIATIVES HAS GROWN 10 FOLD IN THE PAST 5 YEARS
• Government mandates impact approximately 70% of the global car stock
• In 2017, purchase incentives provided by central and local Governments amounted to USD 10 billion, representing 24% of total spend on electric cars
• Average purchase prices of EV’s before subsidies are almost one-quarter lower there than they were five years ago
Global Spend on Electric Vehicles Government Targets
(USD billions)
China 5 million EV’s by 2020
50
European Union 15% EV sales by 2025 and 30% by 2030
45
India 30% electric car sales by 2030.
40 Japan 20-30% electric car sales by 2030
35 Netherlands 10% electric car market share by 2020
30 The value of Government initiatives Norway 100% EV sales by 2025
have grown x10 in the past 5 years
25 France Ban sales of ICE cars by 2040
Slovenia 100% EV sales by 2030
20
New Zealand 64,000 EVs by 2021
15
Korea 200,000 EVs in passenger EV’s by 2020
10
Finland 250,000 EVs by 2030
5 Netherlands 10% EV share by 2020
0 United States 3,300,000 EVs in eight states combined by
2010 2011 2012 2013 2014 2015 2016 2017
Other European Union 5.42 million to 6.27 million electric cars by 2030
Consumer Spending Government Initiatives
United Kingdom Ban ICE vehicles by 2040
Source: International Energy Agency, ‘World Energy Investment 2018’
*Spending is inclusive of sales taxes. Government incentives assigned per model in each year based on national policy documents and include tax incentives and transfers to
consumers or manufacturers to reduce purchase prices. Where possible, local incentives are weighted by distribution of national sales. Non-purchase incentives, such as lower
road taxes or parking fees, are not included. Averages weighted by sales per model. Ranges converted to Worldwide Harmonised Light Vehicles Test Procedure (WLTP).STRONG DEMAND & PERSISTENT UNDERSUPPLY
Orocobre View of
Lithium Supply and Demand LCE tpa
900
800
700
600
500
Thousands
400
300
200
100
0
2016 2017 2018F 2019F 2020F 2021F 2022F
Hard Rock & Clay (includes ex-Australia supply)
South American & Chinese Brine
Capacity at Utilisation (80% ex-China Brine; 60% China, 10% mineral losses for hard rock)
Pessimistic: CAGR 2017-'22 = ~21%; 2020 EV Penetration = ~3.5%; 2016-'20 EV Growth YoY = ~40%; ESS Growth YoY = 30-40%
Base: CAGR 2017-'22 = ~28%; 2020 EV Penetration = ~4.5%; 2016-'20 EV Growth YoY = ~49%; ESS Growth YoY = 30-40%
Optimistic: CAGR 2017-'22 = ~34%; 2020 EV Penetration = ~5.5%; 2016-'20 EV Growth YoY = ~57%; ESS Growth YoY = 30-40%
29SUMMARY
Strong position as a low cost, high margin producer with
Olaroz EBITDAIX US$94.6M
FY19 production to be higher than FY18
Growth projects fully funded:
• Olaroz expanding to 42,500 tpa, work underway
• 10,000 tpa lithium hydroxide plant to be built in
Japan
• FIDs expected shortly
Both projects to be commissioning in 1H 2020
Long term lithium market fundamentals remain strong
Further staged expansions to grow Olaroz production into the
future – Stage 3 and beyond
Borax showing improved results with last 4 months sales up
12% yoy
30NON-IFRS MEASURES & DEPRECIATION
NON-IFRS MEASURES
• EBITDAIX, EBITIX, and EBTIX are non-IFRS financial information and have not been subject to audit by the Company’s external auditor
• EBITDAIX is ‘Earnings before interest, tax, depreciation, amortisation, impairment and foreign exchange losses/gains’.
• EBITIX is ‘Earnings before interest, tax impairment, and foreign exchange losses/gains’.
• EBTIX is ‘Earnings before tax, impairment and foreign exchange losses/gains’. EBITDAIX is used to measure segment performance and have been
extracted from Note 25 ’Segment Reporting of the annual report.
• Statutory profit/(loss) is profit/(loss) after tax attributable to owners of the parent.
• ‘Proportional consolidation's a non-audited accounting method which includes items of income, expense, assets and liabilities in proportion to the
company’s percentage of participation in the joint venture.
DEPRECIATION
• Accounting depreciation
- Depreciation method: Unit of production
- Useful life: From 20 to 40 years depending on the asset based on LCE production of 17,500 tonnes per annum
• Tax depreciation for Olaroz
- Infrastructure: Accelerated depreciation over three years of 60%, 20% and 20%
- Equipment: Accelerated depreciation over three years of 33.3%, 33.3% and 33.3%
32NOTES TO SLIDES
• ktpa is thousands of tonnes per annum
• NCI is non controlling interest
• LCE Lithium Carbonate Equivalent
• pcp is previous corresponding period
• tpa tonnes per annum
Slide 4
1. EBITDAIX is ‘Earnings before interest, tax, depreciation, amortisation, impairment and foreign exchange
losses/gains’.
2. Orocobre reports price as “FOB” (Free On Board) which excludes additional insurance and freight charges included
in “CIF” (Cost, Insurance and Freight or delivered to destination port) pricing
Slide 7
➢ EBITDAIX, EBITX, and EBTX are non audited, non IFRS measures, refer to slide in the appendix
➢ Proportional consolidation is a non audited presentation of the financial statements for commentary purposes
➢ “NCI” is the Non Controlling Interest which represents the portion of equity ownership in the Joint Venture not
attributable to Orocobre Limited
33KEY CHANGES TO TAXATION IN ARGENTINA
• Tax reform published on 29 December 2017 introduced significant changes to the Argentine tax system. Two of the most important changes were the progressive
reduction of the corporate income tax rate over a three-year period (from 35% in 2018 down to 25% in 2020), and the introduction of a withholding tax on profit
distributions (dividends) to foreign shareholders.
• The withholding tax will be applicable to distributions on profits beginning on 1st January 2018 and the respective rate will be of 7% in 2018-2019 and of 13% from
2020. The withholding tax to the shareholder may be considered as a tax credit against its assessable income in its domicile Country.
• Shareholders from Countries in which Argentina has a Double Taxation Agreement with may access a lower withholding tax rate on dividend distributions if the
receiver of the dividend has a certificate of fiscal residence.
• Generally tax losses can be carried forward up to 5 years. Under the mining law this period can be extended based on the generation of taxable income and Fixed
Assets useful life.
• Thin capitalization rules: the new regime applies to any related party loan regardless or whether the entities are local or foreign. Tax reform limits the scope of the
regime to financial loans, excluding loans used for purchasing goods or services. Interest and related finance costs will be deductible up to 30% of taxable income
(before depreciation and finance cost) or a limit to be established by tax authorities (not finalised). Excess of finance costs not deductible during the period may be
carried forward up to 5 years taking into account the established limit in the finance cost deduction.
• Withholding taxes.
- Dividends of 7% in 2018-2019 and 13% from 2020 onwards.
- Interest generally of 35%. Can be reduced down to 15% in certain instances.
- Royalties/fees of 35%.
34VAT
• Exports are exempt from VAT (tax rate 0% for VAT debits).
• VAT Credits generated through the purchase of raw materials, goods and CAPEX can be recovered through the following alternatives:
a) compensation with other indirect taxes (e.g., Social Security Contributions, VAT withheld to suppliers);
b) reimbursement (i.e. 21% of FOB Exports exceeding VAT paid), or
c) sale to third parties (market discount in the circa of 3% - 3.5%)
• In every lodgement of VAT reimbursement request, the Tax Office will grant a VAT export refund up to the limit of the 21% of the FOB Exports (Exports VAT). The
differences between the 21% of FOB and VAT lodged is treated as follows:
- VAT related to the current month of sales is preferentially claimed before the Total VAT balances related to prior periods carried forward (and the project
construction in the case of SDJ)
- If Exports VAT is in excess of VAT Credit, the difference will be used to claim the outstanding accumulated balance of the VAT Credit;
- If VAT Credit is in excess to Exports VAT, the difference will be accumulated as a VAT Credit to be recovered in the future with export sales.
• Once the Tax Office issues its approval resolution of the VAT reimbursement, companies can either wait for the payment (estimated 30 to 60 days) or transfer the
Exports VAT to companies with a commission. This alternative helps improve cash flow and reduce the exposure to devaluation of balances in ARS.
• The tax reform published on 29 December 2017 makes reference to a mechanism for tax reimbursement originated from investments. VAT credits generated through
the purchase, construction, manufacturing, or definitive importation of fixed assets that, after 6 consecutive months which remain outstanding from collection, may be
eligible for reimbursement. The tax authorities are yet to enact the methodology for such recovery mechanism at the date of this report.
35You can also read