NGA PAKA - PARKS & OPEN SPACES - Asset Management Plan MASTERTON DISTRICT COUNCIL 2021 2031 - PARKS & OPEN SPACES Asset Management Plan
←
→
Page content transcription
If your browser does not render page correctly, please read the page content below

NGA PAKA - PARKS & OPEN SPACES
Asset Management Plan
MASTERTON DISTRICT COUNCIL 2021 - 2031

                                         1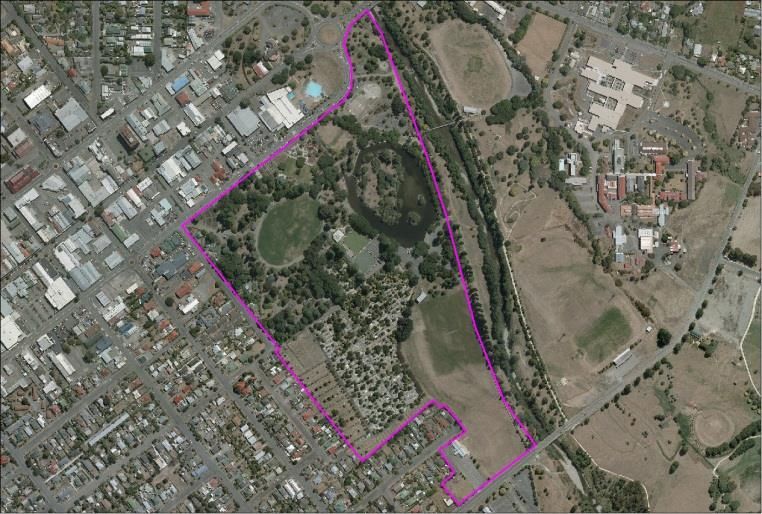
DOCUMENT CONTROL                                                         Adopted by
                                                                         Council
                                                                                             30 June 2021

All rights reserved. No part of this publication may be reproduced,
adapted, published or transmitted in any form or otherwise dealt with,
without the prior permission of the copyright owner.
Masterton District Council
PO Box 444
Masterton 5840

 QUALITY INFORMATION
 Document            Asset Management Plan
                                                                         REVISION HISTORY
 Reference           Version 1 Draft
                                                                         Revision     Date         Details             Authorised
 Date                November 2019                                       11           07/12/2017   Total review and    D Mawson, A
 Prepared By                                                                                       reformat            Jackson
                     David Mawson
                                                                         12           Nov 2020     Revision for 2021   D Mawson
 Reviewed By         Andrea Jackson
                                                                         13           June 2021    Final 2021 plan     D Mawson
 Peer reviewed       Resolve March 2021
 by
 Document            David Mawson
 Approved

                                                                                                                                     1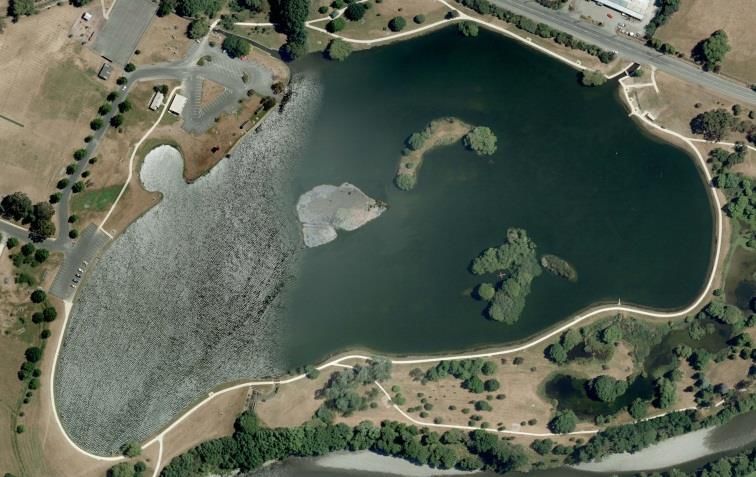
EXECUTIVE SUMMARY ................................................................................................................................................................................................................. 5
   SUMMARY ................................................................................................................................................................................................................................ 5

INTRODUCTION ............................................................................................................................................................................................................................ 6
   BACKGROUND .......................................................................................................................................................................................................................... 6
   SCOPE OF PLAN ........................................................................................................................................................................................................................ 6
   LINKS TO OTHER MANAGEMENT DOCUMENTS....................................................................................................................................................................... 6
   SUMMARY OF ASSETS .............................................................................................................................................................................................................. 7
   ASSET MANAGEMENT PROCESSES........................................................................................................................................................................................... 7
   GOALS AND OBJECTIVES OF ASSET OWNERSHIP ..................................................................................................................................................................... 7
   ASSET MANAGEMENT SYSTEMS .............................................................................................................................................................................................. 7
   STANDARDS AND GUIDELINES ................................................................................................................................................................................................. 8
   ASSET PLAN SOPHISTICATION TARGET LEVEL .......................................................................................................................................................................... 8
   SUMMARY OF ASSET MANAGEMENT PRACTICE ..................................................................................................................................................................... 8

LEVELS OF SERVICE..................................................................................................................................................................................................................... 10
   INTRODUCTION ...................................................................................................................................................................................................................... 10
   CUSTOMERS AND STAKEHOLDERS......................................................................................................................................................................................... 10
   ANNUAL RESIDENTS SURVEY ................................................................................................................................................................................................. 10
   PUBLIC MEETINGS ON SPECIAL PROJECTS ............................................................................................................................................................................. 14
   COMMUNITY OUTCOMES CONSULTATION ........................................................................................................................................................................... 14
   LEGISLATIVE AND OTHER REQUIREMENTS ............................................................................................................................................................................ 14
   OTHER CORPORATE OBJECTIVES ........................................................................................................................................................................................... 14

                                                                                                                                                                                                                                          2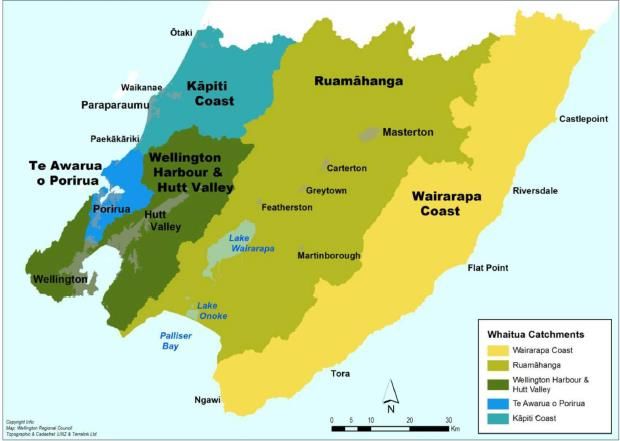
LEVELS OF SERVICE AND PERFORMANCE MEASURES ........................................................................................................................................................... 16
   PAST PERFORMANCE MEASURES .......................................................................................................................................................................................... 18
   FINANCIAL SUMMARY............................................................................................................................................................................................................ 20
   CHANGES IN CURRENT LEVELS OF SERVICE (LOS).................................................................................................................................................................. 20
   INTRODUCTION ...................................................................................................................................................................................................................... 22
   POPULATION EFFECT ............................................................................................................................................................................................................. 22
   RECREATIONAL TRENDS ......................................................................................................................................................................................................... 22
   TOURISM ................................................................................................................................................................................................................................ 23
   IMPLICATIONS FOR ASSETS BY PROVISION. ........................................................................................................................................................................... 24
   COST OF RESPONDING TO GROWTH AND DEMAND CHANGES ............................................................................................................................................ 25
   CONCLUSION FOR THE FUTURE DEMAND ON ASSETS .......................................................................................................................................................... 25

RISK MANAGEMENT................................................................................................................................................................................................................... 26
   NATURAL RESOURCES PLAN .................................................................................................................................................................................................. 34
   OPERATIONAL LEVEL RISK ASSESSMENT: .............................................................................................................................................................................. 34
   SUMMARY OF TRENDS IN RISK ASSESSMENT ........................................................................................................................................................................ 34
   CLIMATE CHANGE AND STORMWATER PROTECTION ........................................................................................................................................................... 34
   INCREASED FLOOD RISK ......................................................................................................................................................................................................... 37
   EARTHQUAKE RESILIENCE RISKS ............................................................................................................................................................................................ 37
   COST OF MITIGATING IDENTIFIED RISKS................................................................................................................................................................................ 38
   CONCLUSION .......................................................................................................................................................................................................................... 39

LIFE CYCLE MANAGEMENT PLANS ............................................................................................................................................................................................. 40
   INTRODUCTION ...................................................................................................................................................................................................................... 40

                                                                                                                                                                                                                                           3
ASSET DESCRIPTION ............................................................................................................................................................................................................... 40
MAINTENANCE PLAN ............................................................................................................................................................................................................. 43
RENEWAL / UPGRADING PLAN .............................................................................................................................................................................................. 46
CRITICAL ASSETS – RESERVES AND PARKS ............................................................................................................................................................................. 47
SIGNIFICANT NEGATIVE EFFECTS ........................................................................................................................................................................................... 47
DATA CONFIDENCE LEVEL ...................................................................................................................................................................................................... 48
ASSET CREATION / ACQUISITION PLAN.................................................................................................................................................................................. 48
FINANCIAL FORECAST ............................................................................................................................................................................................................ 48
DISPOSAL PLAN ...................................................................................................................................................................................................................... 48
PLAN IMPROVEMENT AND MONITORING ................................................................................................................................................................................. 57
INTRODUCTION ...................................................................................................................................................................................................................... 57
CURRENT AMP IMPROVEMENT PROGRAMME...................................................................................................................................................................... 57
APPENDIX AND REFERENCES ..................................................................................................................................................................................................... 58
4There are risks associated with parks and open spaces assets, and
EXECUTIVE SUMMARY the main risk identified is possible changes to climate. Climate
Summary changes will affect how council manage its parks and reserves assets
in the future and how these assets are affected by associated
This Parks and Open Spaces asset management plan covers the
activities due to climate change, in particular the availability of water
parks, reserves, sports-fields and cemetery assets that Masterton
for our sports fields and gardens.
District Council currently owns and operates.
This asset management plan should be read in conjunction with the Queen Elizabeth Park and Henley Lake (both in Masterton Urban
long-term plan (LTP 2021-31) which is the district’s overall plan for the area) are currently holders of the Recreation Aotearoa Green Flag
next ten years to promote the social, economic, environmental and Awards. Queen Elizabeth is a multi-award winner and Henley Lake
cultural well-being of the community now and in the future. received its first award in 2020/21.
The plan contributes towards achieving the Masterton district
council’s stated community outcomes of being an easy place to move
around, achieving a strong sustainable economy, having an active,
involved & caring community. Making us a sustainable, healthy natural
environment, and creating a knowledgeable resilient community.
Strategic and tactical asset management also plays a role in
improving social and environmental outcomes for Masterton.
In February 2021 Council adopted its first Parks and Open Strategy
(POSS) and whilst it is too soon for this Asset Management Plan to
include all the POSS recommendations future Annual Plans and the
next AMP will recognise any changes that the POSS has bought about.
The council provides and maintains and manages 215 hectares of 38
urban and 8 rural recreation spaces including parks, lakes, beachfront
esplanades, reserves and sports fields. These include sports grounds,
gardens, neighbourhood open spaces, natural bush, a network of
walking and cycling trails, and both urban and rural cemeteries.
Possible new parks and open spaces assets will be funded in various
ways. They include rates funded, private developments and
partnerships with community organisations or trusts.
5INTRODUCTION Links to other Management Documents
Background This Parks and Open Spaces asset management plan has tactical
links not discussed in LTP assumptions that provide a link between
The purpose of this Parks & Open Spaces asset management plan Council’s strategic and operational plans. These are:
(“the Plan”) is to provide Masterton District Council (“Council”) with a
tool to assist with the management of its Parks & Open Spaces (“the Linkage between parks and opens spaces amp with other
assets”). This tool combines management, financial, engineering and strategic documents
technical practices and is intended to:
• Ensure that an agreed level of service is provided to defined Document Implication
standards at optimum cost
Active Wairarapa A plan which guides council’s general strategic
• Be sustainable in the long term Physical activity plan involvement with leisure.
• Comply with regulatory requirements
Reserve Required by the Reserves Act 1977, these are
• Help Council to achieve the outcomes the community has defined management plans management plans for specific reserves or
This Plan, prepared in 2021, supersedes Councils “Parks & Open groups of reserves. Each plan establishes a
Spaces Asset Management Plan 2018”. vision for a reserve or group of reserves and
provides a policy framework for the protection,
Scope of plan recreational use, management, and
Council owns, operates and maintains significant assets in reserves, development of the reserve.
sports grounds and beach esplanades, and a network of walking and While these plans have not been created
cycling trails and cemeteries. This Plan was developed to provide simultaneously, each reserve or reserve group
Council with a long-term view of: is to be reviewed on its own cycle. Some plans
• The current status of Council's assets are in draft, some are due for review, while the
rest have been adopted.
• What issues are likely to impact on these assets in the future
• What level of service should be provided to the community in the Global leisure Reports which guides council on current
future at a cost that is community affordable? reports demand of sport, current supply of facilites,
utilisation, gap analysis and 20 year devlopment
All the figures in this plan are expressed in New Zealand dollar values
plan.
as at 30 June 2020 and unless noted otherwise, are in GST exclusive
terms.
6Goals and objectives of asset ownership
Regional spaces and A plan which guides council.
places plan 2019 Council’s role in the delivery of Parks & Open Spaces may be that of
(Sport Wellington ) funder, Kaitiaki, provider or facilitator, and can be affected either
through direct ownership or via partnering and contracted
MDC LTP 2021 - 2031 10-year plan for all concil activities updated arrangements. Parks & Open Spaces are highly valued by the
every 3 years community and contribute to the social, economic and environmental
well-being of Masterton.
Parks and Open A new council strategy which will guide all areas Through the provision of attractive Parks and Open Spaces Council
Space Strategy of Parks and Open Space in Masterton District wishes to:
(POSS)
• Protect, preserve and enhance the natural environment
• Provide recreational opportunities for locals and visitors
Summary of Assets
• Encourage physical activity and healthy lifestyles by offering
The Parks & Open Spaces assets consists of 215 hectares of parks attractive environments for exercise and sport
and open space including Queen Elizabeth Park and Henley Lake Park
as well as neighbourhood open spaces, natural bush reserves, sports • Provide safe accessible social environments for all members of our
grounds, coastal and river esplanades, and a network of walking and community
cycling trails and cemeteries. Asset management systems
Structures including play equipment, playgrounds, memorial features Council’s services contract requires ongoing administration and
and water fountains, boundary fences and a range of outdoor monitoring of the works. This is to ensure the work is being carried
furniture which are covered in our facility asset management plan. out to Council’s satisfaction and in a cost-effective manner.
Asset Management Processes This contract has allowed for increased reporting on the information
Council’s role in advocating on behalf of the region’s Parks & Open held on the asset. Further work is also anticipated in terms of physical
Space community, users, ratepayers and residents is a key driver of inspection of the service.
the asset management process. It enables sound arguments to be put Council has installed an asset Management system called “Assetic’
to the appropriate bodies to ensure equitable access to, and funding which is a central strategic register and asset management system
for, the assets. Asset management plans clearly define both for all asset class. It includes in-built reporting, works tracking and
communities and Council objectives, and how these can be life-cycle costing. It is integrated with 'Assetic Predictor’ for a
successfully delivered within any environmental constraints that are complete Strategic Asset Management planning and operational
identified in the asset management plans.
7system capable of recording all asset information. As of June 2020, Asset plan sophistication target level
Open Space assets have not been transferred into the Assetic Data
The level of sophistication refers to the degree to which core and
system but will be the next Council Asset group to do so. Data is being
advanced criteria for asset management planning have been
recollected electronically so this transfer can take place.
achieved. Criteria for core and advanced asset management planning
are set out in the International Infrastructure Management Manual.
Standards and guidelines (IIMM)
In operating and maintaining its parks assets Council currently use This plan sets out to achieve the minimum level of sophistication
the following standards and guidelines as appropriate: where corporate expectations are expressed informally and simply.
• Reserves Act 1977 Summary of asset management practice
• Burial & Cremation Act 1964 The table below compares our current practice with appropriate and
best asset management practice. (Based on International
• NZS3910 Conditions of Contract for Building and Civil Engineering Infrastructure Management Manual – IIMM)
Construction
• NZS5828 Playground Equipment & Surfacing
• NZS4242 Headstones & Cemetery Monuments
8Parks and Open Spaces Asset Management Processes
Asset Management Activity Current practice Appropriate Best practice
Level of service Review LOS & consult with community at least every 3 years
Knowledge of assets Inventory of assets maintained
Strategic risk assessment 6 yearly. Operational risk assessment 3 yearly.
Risk management
Emergency response plans developed.
Condition assessment Contractors & specialist’s assessments.
Accounting / Economics NCS accounting system. Accrual based system.
Contractors monitor & report any issues. Council staff carry out
Operations
inspections
Contractors monitor & report any issues. Council staff carry out
Maintenance
inspections
Performance monitoring Reported monthly by contractor and annually by staff.
Performance & condition assessments used to prioritise lifecycle
Optimised lifecycle Strategy
strategy.
Design Project /
Expertise is contracted as required.
Management
Asset utilisation / Utilisation derived from use data. Demand forecasting reliant on historic
records, staff knowledge, and the 2019/20 Census and latest population
Demand modelling estimates data. Informetric population projections
Quality Assurance /
Improvements identified and in Plan.
Continuous Improvement
9The purpose of this Asset Activity Plan is to report on the current
LEVELS OF SERVICE service levels for each asset stream and how council operates these
Introduction on the community’s behalf. Options to vary the level of service are
also reported, resulting in the presentation of a series of possible
This Parks and Opens Space Asset Management Plan intends to
options for future maintenance or improvement.
match the level of service the asset provides with the expectations of
customers given financial, technical and legislative constraints. Customers and stakeholders
Asset management plans can be readily aligned with strategic Council’s Parks & Open Space service customers include our
financial planning. Formalised asset management systems and community, visitors, local industries and businesses.
practices provide the Council with key benefits, such as: Council’s Parks & Open Space service stakeholders encompass local
• Improved understanding of service level options and requirements. Iwi (including Rangitāne o Wairarapa and Ngāti Kahungunu ki
Wairarapa), the Department of Conservation, Greater Wellington
• Minimum life cycle (long term) costs for an agreed level of service.
Regional Council, Fish & Game New Zealand, sports clubs, contractors
• Better understanding and forecasting of asset related and the wider community.
management options and costs.
Annual residents survey
• Managed risk of asset failure. 2020 resident survey Parks and Open Spaces
• Improved decision making based on costs and benefits of The most recent survey was done in 2020 (Keyresearch May 2020).
alternatives. Current performance based on recent survey results and compared to
national and peer group averages is assessed as being adequate for
• Clear justification for forward works programmes and funding
the level of service desired by the community.
requirements.
Introduction
• Improved accountability over the use of public resources.
The Masterton District Council has a requirement to measure how
• Improved customer satisfaction and organisation image. satisfied residents are with the resources, facilities and services
Pursuing formal asset management planning enables council, as provided by Council, and to prioritise improvement opportunities that
owners of a comprehensive range of assets, to demonstrate to their will be valued by the community.
customers and other stakeholders that services are being delivered in Research objectives
the most effective manner.
To provide a robust measure of satisfaction with Council’s
performance in relation to service delivery.
10To determine performance drivers and assist Council to identify the major issues, and on our performance relative to the performance of
best opportunities to further improve satisfaction, including our peer group. It also compares Council to other Local Authorities
satisfaction amongst defined groups within the district. throughout New Zealand and to previous Communitrak results, where
applicable.
To assess changes in satisfaction over time and measure progress
towards the long-term objectives. The most recent survey was done in 2020 by KeyResearch and as
seen in the tables below, 90% of residents are satisfied or neutral
Methodology
with the levels of service delivered in Parks and Open Space and 90%
A statistically robust survey conducted online and via postal for Cemeteries.
survey with a sample of n=579 residents across the Masterton
District area.
Post data collection the sample has been weighted so it is aligned
with known population distributions for the Masterton District
Council area, as per the Census 2018 results, based on age, gender
and ethnicity.
A total of 3,000 invitations were posted. At an aggregate level the
sample has an expected 95% confidence interval (margin of error)
of +/ 4.1%.
Data collection took place between 16 April and 24 May 2020.
Notes
Due to rounding, percentages may add to just over or under (+/
1%) totals.
Historical residential surveys
Council conducts a resident’s survey and meets with focus groups to
gain feedback on community perceptions of Council every year.
The National Research Bureau (NRB) has carried out ‘Communitrak’
surveys for Council every year since 1993. This is a means of
measuring Council’s effectiveness in representing the wishes and
viewpoints of our residents. It provides a comparison for Council on
11Results of Masterton’s satisfaction survey for Parks and Open Space
Survey year (June) Very satisfied % Satisfied % Neutral % Dissatisfied % Very dissatisfied %
2020 June (New) 21 48 21 3 1
Survey year (June) Very satisfied % Fairly satisfied % Not very satisfied * very dissatisfied % Don’t know
%
2019 No survey No survey No survey No survey No survey
2018 44 43 11 1 1
2017 40 46 10 2 2
2016 38 48 11 1 2
2015 34 54 9 1 2
2014 37 52 7 2 2
2012 49 34 16 N/A 2
2011 47 40 12 N/A 1
2010 46 38 12 N/A 4
2009 50 36 11 N/A 3
Peer-group 2018 67 28 2 N/A 3
National average 59 34 4 N/A 2
2018
12Results of Masterton’s satisfaction survey for Cemeteries
Survey year (June) Very satisfied % Satisfied % Neutral % Dissatisfied % Very dissatisfied %
2020 June (New) 21 38 25 12 4
Survey year (June) Very satisfied % Fairly satisfied % Not very satisfied * very dissatisfied % Don’t know
%
2019 No survey No survey No survey No survey No survey
2018 12 49 10 1 27
2017 10 53 7 1 29
2016 15 49 8 1 27
2015 16 51 6 1 26
2014 9 47 9 2 33
2012 24 35 9 32
2011 24 35 9 32
2010 22 36 6 36
2009 24 42 9 25
Peer-group 2018 57 26 2 N/A 15
National average 41 30 4 N/A 24
2018
13Public meetings on special projects An engaged • Supporting and promoting strong capable community
The Council’s current policy is to ensure public consultation when and and sports groups, and their volunteers.
empowered
undertaking any major special projects as per our significance and • Supporting a vibrant arts and culture community.
community
engagement framework.
• Supporting an equitable society.
Community outcomes consultation
• Encouraging people to be active.
Parks and Open Spaces assets and services contribute to the
community outcomes outlined in the table below. These will be
reviewed every six years. Legislative and other requirements
Statutory requirements set the framework for the standards of
Community Outcomes
service that Parks and Opens Space assets have to meet and are
Community How Parks and Open Spaces Assets contribute generally non-negotiable. A complete list of legislation, relevant to
Outcome the provision of Parks and Opens Space assets, is listed in Appendix .
• Supporting programmes and projects that promote Other corporate objectives
A thriving and Masterton as a great place to visit.
The Local Government Act 2002 (Schedule 10) states that a purpose
resilient
• Encouraging and facilitating events. of local government is to promote the social, cultural, economic and
economy
• Pursuing affordability as a key objective. environmental well-being of its communities, now and for the future.
Council’s decision-making processes are structured to reinforce this
A sustainable • Protecting significant Landscapes. sustainable approach and the following table outlines how Council is
and healthy guided by these principles
• Providing parks, reserves and open spaces.
natural
environment • Pursuing greater energy efficiency. He Hiringa Tangata, He Hiringa Whenua/Our People, our land strategy
which will provide direction to support social, cultural, environmental
• Caring for waterways. and economic development that will have a tangible impact on the
wellbeing of our people.
14COUNCIL DECISION MAKING GUIDELINE FOR SUSTAINABLE DEVELOPMENT
Well, being Decision making guidelines
Social • A community-led Council-supported approach to community development
• Equal access to opportunities
• Residents are proud of our town and community
• Engaged communities that actively participate in the things that are happening in our district
• A town designed to maximise social wellbeing
Cultural • A commitment to working with Rangitāne o Wairarapa and Ngāti Kahungunu ki Wairarapa to strengthen relationships and
increase opportunities for meaningful partnership and collaboration
• A community that is proud of its cultural identity and heritage
Economic • Our district has clean air and water
• Our unique natural heritage and biodiversity is managed to ensure wider cultural and ecosystem values are recognised and
protected
• Address current and future impacts of climate change
• A community culture of sustainability
• A commitment to work together as Kaitiaki/stewards of our local environment.
Environmental • Attract business and encourage industry growth
• A community where people want to live
• Strong education sectors
• Growth in our tourism sector
• A commitment to working collaboratively
15Levels of service and performance measures
Levels of service, performance measures & targets
The Parks and Recreation Services are grouped into two categories – Parks & Open Spaces and Cemeteries.
Parks and Open Spaces performance and target measures.
Why Measure This? Measure Base measure 2018 Latest Result Performance Targets
2021 - 2031
Increasing utilisation of community facilities and green spaces:
We want our facilities and green spaces
to be used for activities and events that Number of structured
support the needs of our people and activities/ events in
attract visitors; that provide council’s parks and Parks & Sportsgrounds Parks & Sportsgrounds
Increasing utilisation
oportunities for people to connect, sportsgrounds. 359 236
exercise, celebrate and have fun.
The level of use of our green spaces,
sportsgrounds and stadium also reflects Number of people using
the appropriateness and effectiveness our recreational trails
of these spaces for our community and 266,783 entry and exit
that are part of our 312,440 Increasing utilisation
whether we are actually meeting needs. to trails
parks and reserves
network
All burials within a All burials within a All burials within a All burials within a
month were loaded by month were loaded by month were loaded by month were loaded by
Accurate online access to burial records
the 15th of the following the 15th of the following the 15th of the following the 15th of the following
month. month. month. month.
16Desired levels of service
The desired levels of service were identified in 2017 as options for Past performance measures
enhancing service levels. However, affordability is also a key
Below are the performance measures for the parks open space
consideration when establishing service levels. The current levels of
activities, and whether council has achieved them. This information
service were agreed with our community in 2006 then subsequently
was obtained from the annual reports for each year. Note it gives a
each LTP and again in 2020. The results of the Communitrak and
reasonably simplistic view of council’s performance and the reader is
KeyResearch surveys and planned condition assessments may
referred to the annual reports for further details.
identify level of service ‘gaps and thus improvements to be made.
Any identified opportunities for improvement will be incorporated into
this Plan.
Past Masterton District Parks, Reserves and Sports fields Performance Trends
Performance Measure 2013/14 2014/15 2015/16 2016/17 2017/18 2018/19 2019/20
Percentage of residents satisfied with Achieved Achieved Achieved Achieved Achieved Achieved Achieved
the service.
Percentage of users satisfied with the Achieved Achieved Achieved Achieved Achieved Achieved Achieved
service.
Percentage of households who have Achieved Achieved Achieved Not achieved Not achieved Achieved Achieved
visited a park in the past year
Sports Turf meets standard agreed with Not achieved Achieved Achieved Achieved Achieved Achieved Achieved
local sports code.
All playgrounds meet safety standards. Achieved Achieved Achieved Achieved Achieved Part achieved Part achieved
Service requests are acknowledged Not achieved Achieved Achieved Achieved Achieved Achieved Achieved
within five working days.
Reserves have current Management NEW Not achieved Not achieved Part achieved Part achieved Not achieved Not achieved
Plans (reviewed five yearly).
18Past Masterton District Cemeteries Performance Trends
Performance Measure 2013/14 2014/15 2015/16 2016/17 2017/18 2018/19 2019/20
General satisfaction with Not achieved Achieved Achieved Achieved Achieved Achieved Achieved
cemeteries.
Satisfaction amongst those who Achieved Achieved Achieved Achieved Achieved Achieved Achieved
have visited a cemetery.
Compliance with the Burial & Note 1 Achieved Achieved Achieved Achieved Achieved Achieved
Cremations Act 1964.
Proportion of time that cemetery Note 1 Achieved Achieved Achieved Achieved Achieved Achieved
management contracts are met each
month.
Accurate online access to burial Not achieved Achieved Achieved Achieved Achieved Achieved Achieved
records.
*Note 1 – New or not measured.
No satisfaction survey carried out in in 2012/13 or 2019
Council-managed sports grounds meeting local sports club requirements. Not national or International code standards.
19Financial summary In 2019/20 for Cemeteries the cost to deliver the current levels of
service was:
In 2019/20 for Parks & Open Spaces the cost to deliver the current
levels of service was: • Operating Expenditure: $169,322
• Operating Expenditure: $3,282,182 • Rate’s contribution: $89,007
• Rate’s contribution: $2,971,541 • Rates as a proportion of Total Cost: 52.5%
• Rates as a proportion of Total Cost: 90.5%
Changes in current levels of service (LOS)
A number of projects and activities have been proposed as suggested increases or decreases in the current service levels. None of the projects are
required to maintain existing levels of service and have been included in this Plan to facilitate decision-making at Council level. The cost benefits
have not been quantified in the following Table.
It should be noted that the level of services provided through the upgrading of assets is subject to the availability of capital contributions for that
service.
Work and cost required to enhance current level of service Parks and Open Spaces
Action/Work Driver Estimated cost Scheduling How this is funded
Consent option investigation. $30,000 investigation 2021 Rates
Potential changes to how we
Lake of Remembrance $TBC work
deliver water to lake and
community expectations
To spatially understand the TBC (POSS findings) From 2021 TBC
Increasing park and Parks and Open Space
recreation space from POSS requirements to ensure all of
findings Masterton’s community are
provided
20Changes required to meet $850,000 From 2021 Loan
Changes to Henley lake resource consent and
community expectation
Town centre revamp project Enhance customer experience $1,350,000 over 10 years 2024 – 2034 Loan
– Waipoua Precinct
Work and cost required to enhance current level of service Cemeteries
Action/Work Driver Estimated cost Scheduling How this is funded
No LOS changes proposed for Cemeteries in this AMP
21FUTURE GROWTH AND DEMAND This requires clubs/codes to adapt their offerings. Local examples
include netball, basketball and bowls offering evening inter-business
Introduction competitions.
The objective of asset management is to create, operate, maintain, On average, 76% of people in the Wairarapa are physically active for
rehabilitate and replace assets at the required level of service for more than 150 minutes each week, compared to a national average of
present and future customers in a cost effective and sustainable 74%.
manner. This Plan must therefore forecast the needs and demands of
It is estimated that some 500 people use Masterton-based fitness
the community now and in the future, and outline strategies to
center’s each day with a total of 1200 people holding a fitness centre
develop the assets to meet current and future needs.
membership.
Council has considered the following factors for Parks & Open Space
Data from Sport New Zealand; Sport and Active Recreation Survey
assets in addition to those described in Part A to predict future
2014 shows Adult participation has declined by 7.7 percent between
demands:
1998 and 2014, and club membership had decreased by 11.1 percent
• Recreational trends (community, sports, participation and which is not the case with Wairarapa RSOs.
recreation trends)
Research from Sport New Zealand 2011 Young Peoples Survey show
• Community and user groups demand for improvements sports/activities that had relatively high participation rates in both
the school setting and with clubs which is relevant to trends in the
• All population demographics
Wairarapa. Junior club membership is increasing, and we continue to
Population effect have one of the highest secondary school participations rates in the
With a reasonably static population (1% forecast population growth), country.
Council does not expect the demand on Parks & Open Space assets to Wairarapa secondary schools continue to have the highest
change significantly. The household distribution and urban/rural split participation rates in the country. NZSSSC national data shows that
should continue to be monitored. If the rural population does continue (2016) 71% of secondary school students in the Wairarapa play sport
to increase on the outskirts of the urban area, this growth could be for their school.
accommodated by expanding existing urban facilities.
Anecdotally Wairarapa primary schools tell us that 90%, if not more,
Recreational trends primary age children play sport for either a club or school. In order to
The national trend for passive and active recreation is changing. sustain participation at this level, sport requires more volunteers at
Notably there has been a trend away from membership towards all level of sport.
casual participation.
22Tourism Source MBIE and Stat NZ
Current tourist volumes Projections for tourist volumes
Current tourism numbers for the Masterton District cannot be Council funds Destination Wairarapa to promote Masterton as a
assessed as reliable stand-alone figures for Masterton are not tourist destination. New economic development initiatives to
available. However, statistics for the Wairarapa region provide an promote the District will support this and could increase tourist
overview of regional tourism. numbers to the District. Hosting more events and/or promoting
In 2018/19 there were 267,682 total guest nights for the Wairarapa conference facilities etc. could also increase the number of visitors to
region, and length of stay was approximately 1.88 nights. This is the area.
nearly double our earliest available figure of 144,251 in 1996/97. Since Examples of parks and recreation areas currently identified as tourist
2000/2001, total guest nights in the Wairarapa have consistently hubs include:
exceeded 190,000 except for 2008/09 at 188,819. The peak number of
guest nights was 267,682 achieved in the 2018/19. (awaiting new • Castlepoint and Riversdale
number but 2020 will be affected by Covid) • Queen Elisabeth Park
The coastal areas including Riversdale and Castlepoint experience • Henley Lake
peak summer populations. A survey carried out by NRB in 2008 for
• Trails
Riversdale noted that only about 6% of the houses at the Beach were
the owners’ main residence and occupied during the year, and that User demands for improvement
most (21%) of the population who occupied Riversdale Beach did so in Demand is affected by the community’s changing expectations.
January. Changes in community expectations can result from:
Council owned Mawley Park’s occupancy also fluctuates seasonally. • Advances in technology
Wairarapa guest nights by year • Improving standards of living or transfer of standards from cities
• A greater understanding of customers’ perceptions and
Year 2014/15 2015/16 2016/17 2017/18 2018/19 2019/20 expectations
• Increased safety standard and environmental awareness
• Changing legislative requirements
Nights 203,386 220,723 240,898 197,220 267,682 TBA
• Increased service provision in other towns nearby
23These demand factors are often not easily quantifiable, and care Demand projections for Internments
needs to be taken to establish the need for a facility on a robust basis
As a consequence of the aging population there is likely to be slightly
– not just the latest or loudest voice citing short-term conditions or
increased numbers of annual interments. The cemetery reserves
trends. Once a sport or recreation facility is established it is usually a
currently held by Council have capacity for many years use.
costly and/or difficult exercise to remove or change it, and there will
be a long-term impact on Rates to operate and maintain the facility. An important change to interment asset management is the
upgrading of the cemeteries databases and their integration with
Implications for assets by provision. other information to enable easier public access to more
Active recreation provision comprehensive information. This change has been driven by
The projected decrease in youth population could cause us to expect customer expectations.
decreased overall demand for youth facilities. Also there has been a
national trend towards casual participation rather than club’s
membership. This can skew results when collecting membership data
as a basis for estimating demand. However, there is no evidence yet
of any decline in overall demand for youth facilities. Some sports,
including softball and netball, have in fact grown because of quality
administration and promotion.
Demand for sports facilities is further increased as Masterton often
serves a regional-wide population rather than just local users. Sports
codes will usually require a higher standard of facility for regional
competitions and there is an associated increase in capital and
operational costs.
The preferred solution is the development of centralised facilities
that service multiple codes so that the cost of administration and
infrastructure (car parking, changing rooms, storage etc.) can be
shared. Examples of this centralised approach are seen at the:
• Sports bowl - shared by athletics, cycling, football and multisport
clubs and
• Queen Elizabeth park - shared by bowls, petanque, croquet and
cricket
24Cost of responding to growth and demand changes
The key actions and issues identified in this section that may require attention and/or intervention, and the costs associated with the proposed
work, are outlined in the following table.
Parks and Open Space work required to meet Growth and Demand
Demand driver Work action Scheduled for Estimated cost Funding source
• Active • A strong
Partnerships Identity
POSS $100,000 (Healthy people)
• Healthy Parks • Protect, plan from 2021 Rates
outcomes Further project TBC
• Healthy and connect
People network
• Cemetery Management Plan
Cemetery $150,000 (Landscape)
• Riverside Cemetery Extension from 2021 Loan / Rates
expansion Extension TBA
• Appropriate diversity
• Five Towns Trails
Trails and
from 2021 $200,000 Loan
paths • Local extensions
Conclusion for the future demand on assets • Climate changes are expected (see Risk section) to have an effect
on Parks & Open Spaces services, from both supply and demand
1% per year population growth and an aging demographic will mean:
aspects. Council will develop strategies for the various possible
• There is restrained need to increase overall capacity of parks projections as to the likely risks of climate changes. Currently using
• Further funding is required to continue the work started on passive GWRC climate change strategy.
recreation opportunities
• The annual rate of interments may increase slightly but there is
sufficient capacity to meet demand for the foreseeable future
25• Enhance MDC’s ability to achieve business objectives
RISK MANAGEMENT
• Maintain the integrity of services
Introduction
• safeguard assets, people, finances, and property
Risk Management is the term applied to a logical and systematic
method of establishing the context, identifying, analysing, evaluating, • Create a culture where all employees accept responsibility for
treating, monitoring and communicating risks associated with any managing risk
activity, function or process in a way that will enable organizations to • Ensure that MDC can adequately and appropriately deal with risk
minimize losses and maximise opportunities. Risk Management is as and issues as they occur
much about identifying opportunities as avoiding or mitigating losses.
• Demonstrate transparent and responsible risk management
Risk Management in asset management planning is a requirement of processes which align with and demonstrate good governance
the Local Government Act 2002. It should be used when there are:
• Identify opportunities and promote innovation and integration
• Large potential damages/losses
• Record and maintain a risk management framework aligned with
• Changing economic conditions the AS/NZS ISO 31000:2018 standard
• Varying levels of demand for services • Utilise risk management process outputs as inputs into MDC
• Investments that lie outside the ability to fund decision-making processes.
• Important political, economic or financial aspects Following are the processes involved in the risk management:
• Environmental or safety issues Risk management process
• Threats or changes to service levels The process followed for this Plan was:
The risk management process is defined as ‘the systematic Strategic level risk assessment:
application of management policies, procedures and practices to the • Review of Masterton District Council Asset Management
tasks of identifying, evaluating, treating and monitoring those risks Processes Risk Management (Waugh Consultants, 2006) in
that could prevent a local authority from achieving its strategic or conjunction with asset managers and production of a revised
operational objectives, or plans, or from complying with its legal report: Masterton District Council Asset Management Processes
obligations’. Risk Management (Waugh Consultants, 2011)
In September 2019 MDC adopted a Corporate Risk Management • Risk Management Update (Waugh Consultants, 2014)
Policy. As per the policy the main policy objectives are to: • The impact of the Waugh Update (2011 & 2014) was reviewed at a
strategic level in conjunction with the risk assessments carried
26out by Council staff. The risk management analysis is Staff Workshops
now consistently incorporated into all respective asset
The 2020 risk review process and results presented in this report are
management plans
based on the opinions and perspectives of asset management on
• 2017 Council risk review undertaken following the Waugh Risk operational MDC staff. Risk assessments based on opinion are
management assessment. particularly useful in extracting perceived issues/problems relating to
an activity, and in provoking discussion as to why one issue has a
• Production of a report: Masterton District Council Asset
higher risk than another. Much of the value of this type of risk
Management Processes Risk Management (Waugh Consultants,
assessment exercise is gained when it is completed by groups of
2020).
staff, as it tends to lead to questioning of assumptions surrounding
Risk review 2020 the activity that may no longer be valid. The results presented should
The 2020 risk management review process included: be challenged and reviewed as necessary within the wider corporate
context and whenever additional asset information is obtained.
• A review of the MDC Risk Management Policy and Corporate Risk
framework Qualitative asset condition and performance information is an
important indicator of physical asset risk. Whilst specific asset
• Risk review workshops with Council’s Infrastructure managers condition has not been investigated in detail as part of work,
• Review of and alignment of risk register format with the Corporate asset condition and performance issues have been identified in the
Risk Register risk registers.
• Update of the risk registers. Risk Register Update
Risk review objectives Improvements
The objectives of the 2020 Risk Management Review process include: The updated risk registers have been further developed to include
likelihood and consequence scorning for the following three stages of
• Update the MDC risk assessments and mitigation measures
risk exposure:
reflecting latest MDC risk management policy and practice.
• Un-treated risk,
• Detailed risk registers that record latent (untreated) risk scores,
current practise risk scores and residual risk (when identified • Current or existing [E] risk rating, recognising existing processes
improvement s have been implemented). that manage or mitigate the risk,
• Support the 2021-31 LTP financial programme development where • Residual risk or proposed [P] risk rating, a proposed process that
risk is a driver for capital or operational funding if implemented will manage or mitigate the risk to its lowest level.
27Current risks with a score of 12 or higher, have been included in the
CONSEQUENCE TABLE AND SCORES
improvement plans. The residual risk actions help to define the
improvement actions. Likelihood Score
Risk Methodology & Scores Insignificant 1
− Risk Stages
Minor 2
As mentioned, the risk registers have 3 risk scores 1 for each stage
i.e., untreated, current practice and residual risk. Moderate 3
− Risk Scoring Process
Major 4
Step 1:
Every risk is scored by assessing and allocating a score for both the Catastrophic 5
likelihood and consequence of each score the scoring is based on the
following tables:
Step 2:
LIKELIHOOD TABLE AND SCORES
The risk score is calculated by multiplying the ‘likelihood’ score by the
Likelihood Score ‘consequence’ score.
Rare 1 Likelihood score x consequence score = Risk score
This scoring process is repeated for each of the 3 risk stages.
Unlikely 2
Moderate 3
Likely 4
Almost certain 5
28The table below details the Risk Rating categories and potential
implications for the following areas legislation, Community
expectation financial and environmental.
29Risk review outcomes
RISK RATING CATEGORIES
This section of the report provides an overview of the critical and high
Communit
risks per activity, with the detailed risk registers attached as
Risk Risk y Environme
Legislation Financial appendices.
Rating Scores Expectatio nt
n Assets and Operations Group Risks
Commission Expectation Detriment Widespread A number of Assets and Operations Group risks common to all the
Critical activities were identified. These risks have been grouped together as
> 19 ers s not al effects long-term
(4) common group risks in this section of the report. Doing this reduces
Appointed obtainable > $0.5m effect
duplication of these risks in each individual activity risk register,
Expectation streamlining the management and reporting of these risks.
Adverse
s not Detriment Some of these common Group risks have different responses and
Audit Long term
High (3) 12 to 19 obtainable al effects mitigations measures in the different activities. Where this is the
Opinion or effect
medium > $50k case the risks are included in the activity specific risk registers.
Disclaimer
term
Key Risks & Group improvement items
Qualified Expectation Detriment The tables below summary the Assets and Operations Group key risks,
Opinion; s not al effects Short term highlighting the raw risk , current risk and potential improved risk
Moderat
5 to 11 Warning obtainable between reversible scores if improvement actions are implemented:
e (2)
over non- in short $10k - effect
compliance. term $50k The table below also summarises the improvement actions that if
implemented reduces the individual risk scores: Note the earlier
Reversible spider chart has Park and Open Spaces as well as Community
Faults Detriment facilities included together the analysis below is for Park and Open
Minor non- and
Low (1) 3 to 4 within al effects Spaces alone.
compliance contained
agreed LoSYou can also read