No BS: Using High Impact Data for Educational Equity - IVORY A. TOLDSON
←
→
Page content transcription
If your browser does not render page correctly, please read the page content below
No BS: Using High Impact Data for
                          Educational Equity

IVORY A. TOLDSON
What can data tell us?
•   High School GPA – 2.7
•   ACT/SAT – 17
•   Reading Proficiency – Below Basic
•   Great school score – 1/10 high school
•   # Parents in household – 1
•   Zip code – Highest Crime Rate in City

Using the past to guide our
future
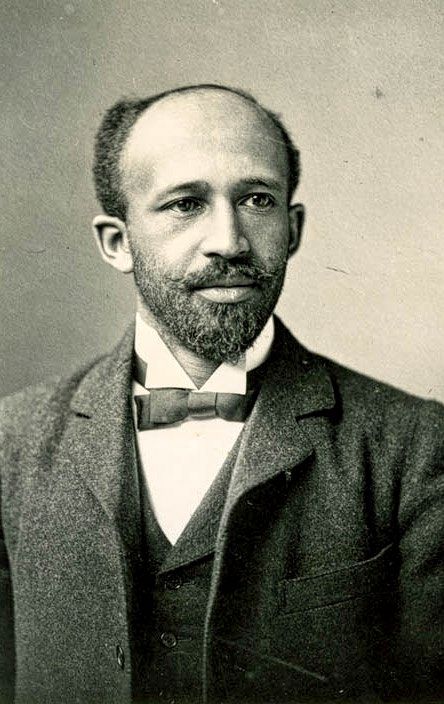
•In 1899, W.E.B. Du Bois revolutionized social science research by using
geocoding, immersive participatory research, archival research, non-
deficit research paradigms, and surveys, when he published The
Philadelphia Negro.
• Du Bois lived in the same neighborhood as his research participants
and coded a map of the area to demonstrate the in-group diversity of
Black Philadelphians, as well as the complexities and nuances of their
needs.
• Paved the way for modern, technology facilitated research strategies,
such as geographic information system (GIS) mapping and big
data analytics
Education in the
 Post-Reform Era
• More Diversity
• More Technology
• More Data
• Better use of Data
    • Data democratization
    • Data transparency
• No BS (Bad Stats)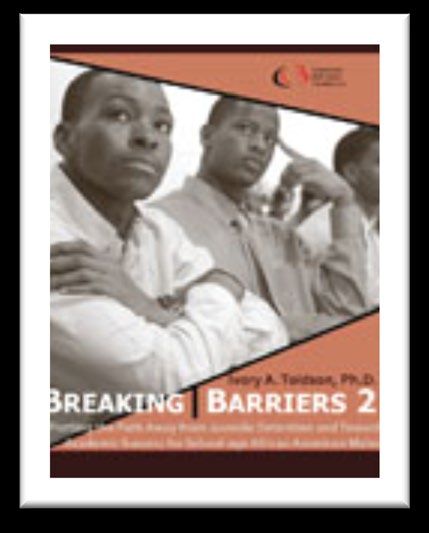
We can find good data…

•   The National Center for Education Statistics (NCES) collects and analyzes data related to education in the U.S. Data is publicly available
    to access and analyze (K-12 and Post-Secondary)
•   The Common Core of Data (CCD) is the Department of Education's a comprehensive, annual database on all public elementary and
    secondary schools and school districts. (K-12)
•   Civil Rights Data Collection (CRDC) collects and reports data on key education and civil rights issues in public schools. (K-12 and Post-
    Secondary Preparation)
•   American Community Survey (ACS) of the U.S. Census Bureau is an annual survey of ancestry, educational attainment, income, language
    proficiency, migration, disability, employment, and housing characteristics. (Post-Secondary data)
•   Current Population Survey School Enrollment Supplement is national survey on information about school enrollment for household
    members age 3 and older. It is a proxy response survey sponsored by the National Center for Education Statistics (NCES), Bureau of
    Labor Statistics (BLS) and the United States Census Bureau. (https://nces.ed.gov/surveys/cps/) (K-12 and Post-Secondary)
•   The National Assessment of Educational Progress (NAEP) is the largest nationally representative and continuing assessment of students'
    aptitude in specific subject areas. (K-12)

                                           But can we use good data for BS (Bad Stats)? next
                                                                                       slide
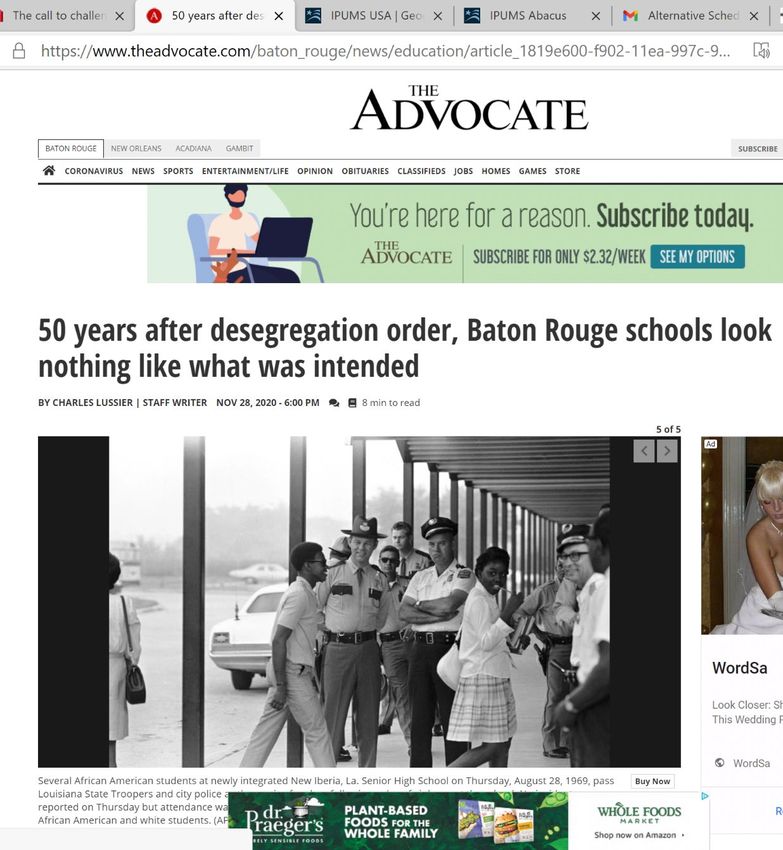
Black Male Multiple Choice: Unemployed, High School Dropout or
    Incarcerated by Russell Simmons, for the Huffington Post

 If a black boy is born in the US today, he will have a 33 percent
(FALSE) chance of going to prison in his lifetime. It has become
   a sad normality, almost a backwards rite of passage, for black
     young men to enter the penal system (MYTH). Black men
  represent 8 percent (FALSE) of the population of the United
States but comprise 3 percent (FALSE) of all college undergrads,
  48 percent of inmates in prison (TRUE)... 50 percent of black
boys do not finish high school (FALSE), 72 percent of black male
  dropouts in their 20s are unemployed and 60 percent of black
 male dropouts are eventually incarcerated (TRUE, but FALSE).
•   Answer: People say it because in 2003 a Bureau of Justice statistician named
                         Thomas P. Bonczar published a report that stated: “About 1 in 3 black males, 1
                         in 6 Hispanic males, and 1 in 17 white males are expected to go to prison
                         during their lifetime, if current incarceration rates remain unchanged.”
   Question: Dr.     •   In a table called a “double decrement life table,” Bonzar predicted the
Toldson, so many         likelihood that a person would be incarcerated based on their race, gender
                         and year of birth. The style of the study was very similar to John Diiulio's
people say, “1 in    •
                         discredited "super- predator" research.
                         The table header read “Percent ever going to prison during lifetime, born
 3 Black men will        in___.” According to Bonzar, if you were a Black man born in 1974 (closer to
                         my age) the likelihood was 13.4%, 1991 was 29.4% and 2001 was 32.2% (1 in
   serve time in         3).

    prison in his    •   IMPORTANT, the report was published in 2003, so the 1 in 3 was only
                         applicable to 2-year-olds. Black men generally at the time was 22%, but even

lifetime,” so why        that figure is a bit suspect (it was merely the cumulative prediction, not the
                         actual rate).

  do you call it a   •   So, about a decade and a half later, we still quote this 1 in 3 stat (usually
                         without citing). Notwithstanding, those 2-year-olds, now at the brink of
   lie or BS (bad        adulthood, can proudly proclaim to be the least violent generation of Black
                         people in modern history.
       stats)?       •   As a member of the generation that invented drive-bys, Jordan-jacking, crips
                         and bloods, gangsta rap, and discharging guns at the movies, I’d like to thank
                         today’s Black teenagers for being so much better than the 1980s-90s version
                         of my indignant-as-adult Black peers.
                     •   This is the original 1 in 3 study:
                         https://www.bjs.gov/content/pub/pdf/piusp01.pdf
Thoughtful Analysis - What does this mean?
• "Report: Only 13 Percent of 2011 Black Graduates Proficient in Reading.”
• Based on a Harvard study, which also found that less than half of white
graduates were proficient in reading (40 percent).
• “Proficiency of Black Students Is Found to Be Far Lower Than Expected”
• In 2010, the Council of the Great City Schools found that only 12 percent
(pdf) of black fourth-grade boys were proficient in reading, compared with 38
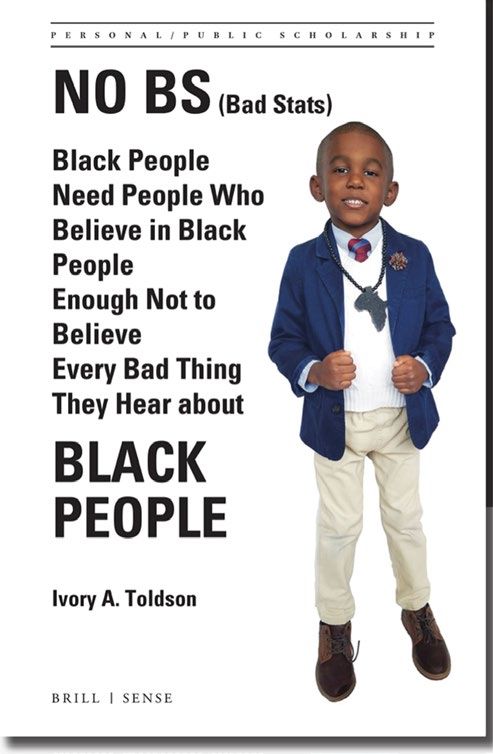
percent of white boysReading Proficiency - What it means technically: 1) On a national or state assessment of reading, the students achieved a score that was less than the scores achieved by the norm-reference group of students in the same grade. The calculated score is an estimate that reflects both actual reading ability and random error (e.g. motivation, fatigue, resentment, attentional deficits, etc.). And the unknown true score lies within a range of confidence, which varies based on the validity of the assessment and the testing circumstances. 2) Some of the students who are not reading on level, are missing basic level abilities to recognize and express words and understand the meaning of words. However, this is best assessed through oral reading, not silent examinations. These students will need extra care and attention to learn concepts they should have learned in previous grades. 3) Many students who are not reading on level, have scores that are marred with error (see definition above). They could care less about the tests (and honestly, why should they), or they didn’t sleep the night before, or they don’t like the educator, and see through the con (they know that you want them to do well because it helps the educator, not the students), or they have attentional deficits (which should be assessed independent to reading ability). These students need social support, inspiration to be re-engaged with the school, more agency over what they read and how they read it, and to know the educator actually cares about them. Source: Toldson, I. A. (2019). No BS (Bad Stats): Black People Need People Who Believe in Black People Enough Not to Believe Every Bad Thing They Hear About Black People. Brill-Sense: Boston, MA
Reading Proficiency - What it means practically:
When educators do not know the specific assessment being used, the circumstances by which the test
was administered, and do not understand the basic concepts of testing theory, they should not
prognosticate the fate of students generally who don’t read on grade level;

          When educators have not taken the time to identify the specific students who need to learn basic
          concepts and are generalizing the needs of all students based on a standardized test, they should
          not prognosticate the fate of students generally who don’t read on grade level; and

                    When educators have not taken the time to know, care for and inspire students, and are judging
                    them based on a test, they should not prognosticate the fate of students generally who don’t read
                    on grade level.

                                             Source: Toldson, I. A. (2019). No BS (Bad Stats): Black People Need People Who Believe in Black People
                                             Enough Not to Believe Every Bad Thing They Hear About Black People. Brill-Sense: Boston, MA
What is good
Data?
•From measurable inputs to
postsecondary success.
•© Ivory A. ToldsonHumanizing Data
The Case of Truancy in DC
‘Well, kids can miss 30 days and it’s
okay’” – DC Council Member
351 Comments
Interesting connection to postsecondary
success.• The survey “Health Behaviors In School-Age Children” found that
Who Wants 62% of Black males (N = 1,133) and 67% of Black females (N =
1,542) “plan” to go to a 4-year college after graduation.
to go to • The survey “Monitoring the Future: A Continuing Study of American
Youth” found that 45% of Black males (N = 556) and 51% of Black
females (N = 581) “expect” to go to a 4-year college after
College graduation.
• The survey “High School Longitudinal Survey of 2009” found that
more, Black 51% of Black males (N = 1,149) and 56% of Black females (N =
1,297) “plan” to go to a 4-year college after graduation.
students or • Notably, across all three surveys, the percentage of Black student’s
that aspired to attend college after high school was slightly higher
than White students. Therefore, any difference in college
White participation across races has nothing to do with Black students’
attitude or desire, and everything to do with systemic inequities.
Students? Why is this important?Why is this Important?
• Many programs aimed at promoting college to Black students operate from a deficit
perspective. Fundamentally, they use strategies aimed at teaching “why” college is
important, when they should be focused on “how” to get there.
• Looking deeper at the data, we find that the #1 reason that Black students do not
go to college is because they do not think they can afford it. Other factors that limit
Black students’ progress to college after graduation include:
• not feeling adequately prepared for college,
• not having enough information to make the best decision, and
• competing family obligations.
This should change just about EVERYTHING about how most high schools promote
college to black students.Cultivating Happiness vs.
Fetishizing Grit
In my Breaking Barriers reports:
• Health Behaviors in School-age Children (HBSC) - academically successful Black
males were almost twice as likely to report feeling "happy" about their life when
compared to those with failing grades.
• National Survey of America's Families (NSAF) - strongest parenting indicators of
academic success were: (1) Parents who often told children they were proud of
them; and (2) Parents who let students know when they did a good job.
Interestingly, corrective actions, including punishing bad behavior, was not
correlated with grades.
• NCVS: School Crime Supplement (NCVS-SCS) - Black male students who were
successful perceived their teachers to be respectful people who treated them like
they matter, and nurturing people who build up their strengths, instead of
making them “feel bad” about their weaknesses.Cultivating Happiness vs.
Fetishizing Grit
• There is a mountain of empirical evidence that happy learners are the best
learners. However, many schools, and some parents, have sadistic fantasies
about beating Black males into submission.
• They grab a bat and harness their inner Joe Clark, binge on memories of
"scared straight," and design programs that beat students down, rather
than lift them up.
• They cut programs, like sports and music, that bring students joy, and
double up on test prep. And if students fail, they blame it on their lack of
"grit" and not on their healthy intolerance for BS.
• Black students need educational leaders to cultivate happiness in schools;
not fetishize about them "gritting" through their oppressive programs.The Academic Achievement as a Social Construct
• "Academic achievement" is a social construct. Indicators of academic achievement are meaningless without their relationship to
positive life outcomes. Thus, in theory, indicators of academic achievement (like test scores and grades) should "predict" positive life
outcomes. However, in practice, indicators of academic achievement "determine" positive life outcomes. This is a problem.
• Because, we can never know if the academic "things" we measure have any real relationship to positive life outcomes. Also,
educators and parents become more fixated on "things," like test scores and grades, and we neglect fundamental social,
developmental, and educational needs that likely have a stronger association with positive life outcomes than the "things" that we are
fixated on.
• The academic achievement "gap" is also a social construct. In theory, indicators of the academic achievement gap should be able to
"predict" social inequities. However, in practice, indicators of the academic achievement gap are used to help oppressors "create"
social inequities.
• This is a problem.
Source: Toldson, I. A. (2019). No BS (Bad Stats): Black People Need People Who Believe in Black People
Enough Not to Believe Every Bad Thing They Hear About Black People. Brill-Sense: Boston, MAPlotting the Achievement Gap vs. Plotting Achievement
WE ARE CONDITIONED TO DO THIS: WHEN WE SHOULD BE DOING THIS:
We pervert the true character of achievement and marginalize Black learners when our primary objective is to close
the achievement gap rather than to ADVANCE ACHIEVEMENT.
– Written and Illustrated by Dr. Ivory A. ToldsonProximal school-related data to gather comprehensive and holistic information on student achievement and post- secondary success. Average attendance Postsecondary placement Collective GPA Percent of students advancing to 4-year colleges Participation in competitions (science fairs, spelling bees, math Number of home visits competition) Suspension rate Frequency of contact with parents Student satisfaction surveys Counselor to student ratio Curriculum reviews Teacher to student ratio Teachers’ total number of hours in professional development Administrative tenure Teacher’s credential and certification Number of enrichment programs Percent of students participating in extracurricular activities Age and quality of textbooks Percent of students in honors and AP classes Time using technology Dropout rate Time spent participating in laboratory experiences Graduation rate Student merit awards given
Numbers are People
• Many people use data to understand people. But we should
 use people to understand data.
• Every number is associated with human characteristics that
 researchers should not ignore. Behind every statistic, there is a
 person with dreams, aspirations, fears, and needs. Separating
 numbers from people allows people to oppress people without
 conscience or consequence.
References

Primary: Toldson, I. A. (2019). No BS (Bad Stats): Black people need people who believe in Black people enough not to believe every bad thing they hear about Black people. Brill-
Sense: Boston, MA

•          Chrisler, A. J. (2015). Humanizing research: Decolonizing qualitative inquiry with youth and communities. Journal of Family Theory & Review, 7(3),
           333-339. doi:10.1111/jftr.12090
•          Gibson, B. L., Rochat, P., Tone, E. B., & Baron, A. S. (2017). Sources of implicit and explicit intergroup race bias among African-American children
           and young adults. PLoS ONE, 12(9), 1-18. doi:10.1371/journal.pone.0183015
•          Hunter, M. (2015). W.E.B. Du Bois and Black heterogeneity: How the Philadelphia Negro shaped American sociology. American Sociologist, 46(2),
           219-233. doi:10.1007/s12108-014-9249-2
•          Knaus, C. B. (2009). Shut up and listen: Applied critical race theory in the classroom. Race, Ethnicity and Education, 12(2), 133-154.
•          Kohli, R. (2018). Behind school doors: The impact of hostile racial climates on urban teachers of color. Urban Education, 53(3), 307-333.
           doi:10.1177/0042085916636653
•          Ladson-Billings, G. (2007). Pushing past the achievement gap: An essay on the language of deficit. Journal of Negro Education, 76(3), 316-323.
You can also read