North Island Monthly Fire Danger Outlook (2021/2022 season)
←
→
Page content transcription
If your browser does not render page correctly, please read the page content below
North Island Monthly Fire Danger Outlook (2021/2022 season)
Issue: March 2022
Current fire danger situation
In general, February’s monthly fire danger and fire climate severity improved substantially compared to January, due
to heavy rainfall in the first half of February. However, very dry conditions have returned during the past 4-5 weeks.
Fire danger indices are currently highest in the upper North Island (Figures 8-11).
Current fuel and soil moisture status
The dry start to March and higher than normal
As of 17 March (Figure 4, left), soil moisture levels are temperatures have seen fire dangers quickly return to
below normal or well below normal across nearly all of normal or above normal levels in many areas, especially
the upper and central North Island, and above normal in in the upper North Island. Figure 2 shows the current BUI
parts of Wellington-Wairarapa. “Dry” and “Very Dry” trend for Athol Raws in the southern Waikato, where
conditions are found from Northland to northern values have fallen from near record high levels, but
Waikato on the New Zealand Drought Index map, with rapidly increased again to values well above average for
some “Extremely Dry” areas found in Auckland. this time of year.
The above normal rainfall in February saw significant
reductions in Fire Weather System Codes and indices
(BUI, DC and DMC – refer to appendix for definitions),
especially across the eastern and southern areas of the
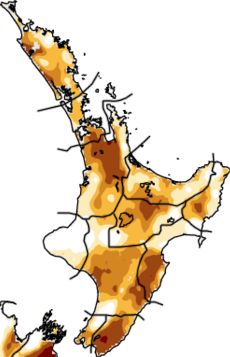
North Island. However, elevated BUI and DMC values
(Figure 1) remain across areas further north that missed
much of the rainfall and have experienced continued dry
conditions into March.
Figure 2: Trend in Buildup Index (BUI) code values for Athol Raws in
southern Waikato comparing current values (2021/22, red line) with
previous seasons (2020/21 (blue line), average (black line), and range
(grey shading)).
Forecast climate and weather
Late March and early April may bring a period of more
unsettled weather due to a return of the Madden-Julian
Oscillation (MJO) to the western Pacific. For April as a
whole, more easterly winds than normal are once again
expected. This could result in near average to above
average rainfall for much of the North Island, although
Figure 1: Map of Duff Moisture Code (an indicator of dryness in precipitation in central and western regions may be
shallow organic soil layers and medium-sized woody material) for intermittent.
the North Island as at 19 March.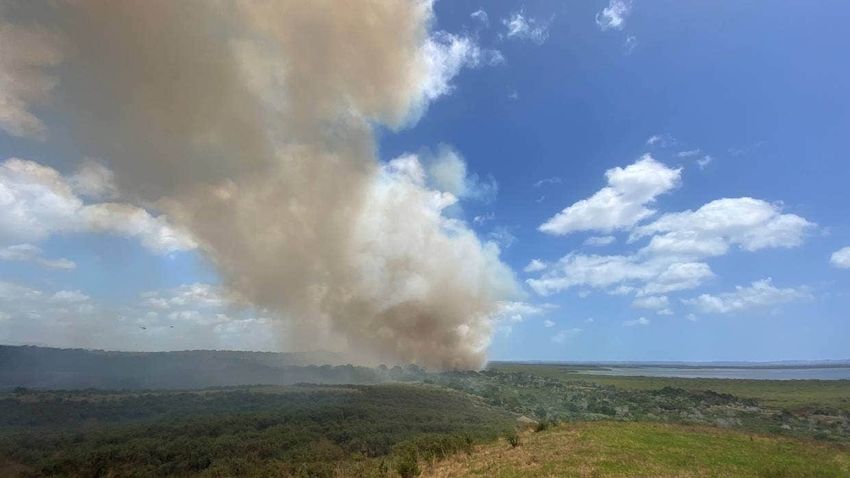
Mid-autumn through early winter (April-June) is forecast • Areas with high grass curing, although grasses will be
to have more easterly winds than normal as the effect of greening up in many regions.
La Niña continues, with near normal or above normal
rainfall favoured. Rainfall may be intermittent, although • Occasional periods of strong winds, with potential to
occasional heavy rain events could bring flooding to cause flare-ups or re-ignitions of going fires or burns.
northern and eastern areas. For more information, see
pages 3 and 4.
What to watch for
• In the short term, heavy rainfall, especially over the
top half of the North Island, reducing fire dangers
significantly and removing remaining soil dryness.
• Areas that miss the forecast rain, such as in the Far
North or possibly the Central North Island, where
underlying dry conditions already exist.
• Areas of the Far North (Aupori Peninsula), and
possibly south Waikato, are most likely to experience
slightly above normal fire danger over the coming
months as depicted in Figure 3.
• Dry spells, causing soil and fuel moistures to increase
from present low levels to more normal or above
normal levels. Figure 3: Locations identified as areas of interest that may develop
an increased risk of above normal fire potential over the next three
months.
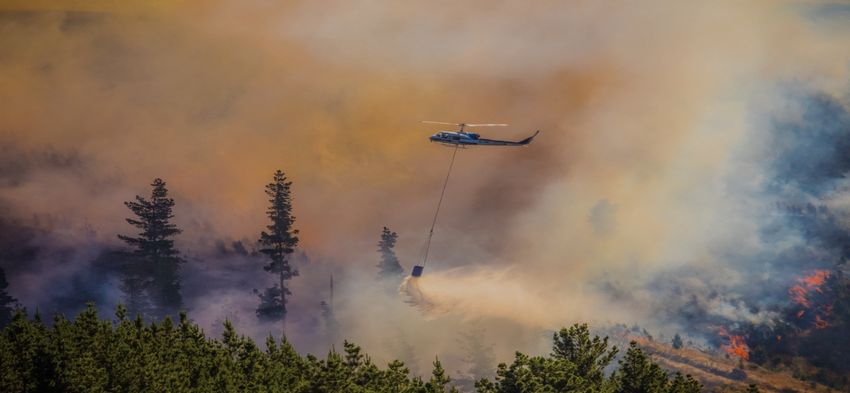
Fires such as this in light flashy fuels like cured grass, scrub and wetland vegetation do not require extended dry periods
and can dry out and spread rapidly under the influence of wind.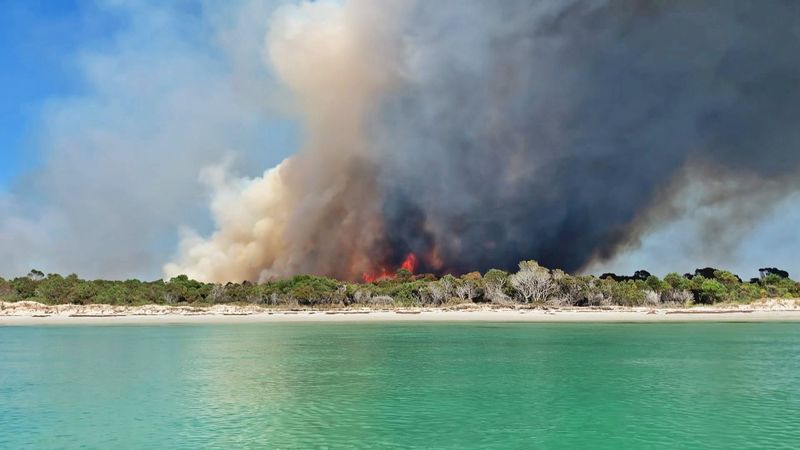
Current climate                                                          During February, upper-oceanic heat content increased
                                                                          in the western and central Pacific for the second
 February temperatures were above average (0.51-1.20°C                    consecutive month. For the first time since early last
 above average) or well above average (>1.20°C above                      winter, conditions in the upper 300 m of the equatorial
 average) across nearly all of the North Island. However,                 Pacific were generally warmer than average.
 near average (±0.50°C of average) temperatures were
 observed in parts of Wellington. This very warm trend has                During February, rainfall and convection favoured the
 generally continued into the first half of March (Figure 4,              eastern Indian Ocean, Maritime Continent, and western
 right).                                                                  Pacific. Convective forcing from the Madden-Julian
                                                                          Oscillation (MJO) was superimposed with the continued
 February rainfall was above normal (120-149% of normal)                  effect of La Niña. The South Pacific Convergence Zone
 or well above normal (>149% of normal) across most of                    was displaced southwest of its climatological position,
 the central and lower North Island. Below normal rainfall                consistent with the continuation of La Niña.
 (50-79% of normal) or well below normal rainfall (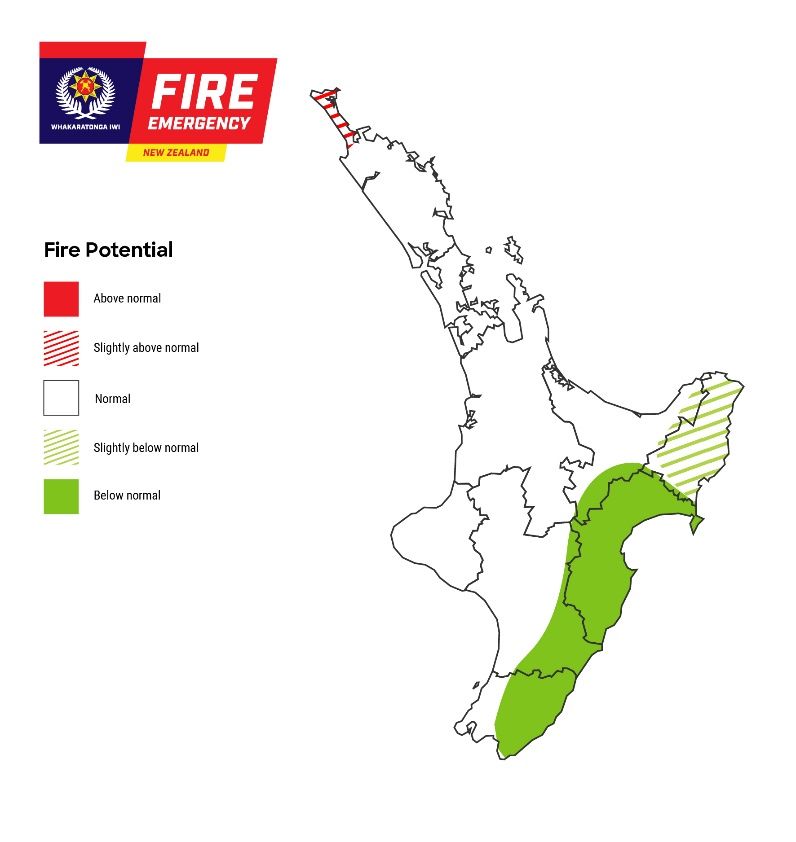
Fire season analogues

To help understand what fire weather conditions may be                      a computer analysis. Where the two methods agree,
like this summer, we can look at analogues. Analogues                       confidence tends to be higher.
are historical years with similar climatic conditions to the
current year.                                                               The current signal is for a mid-autumn to early winter
                                                                            season with higher fire weather indices relative to the
This season’s analogue years featured historical years                      long-term average across the western North Island, but
that had La Niña-like patterns in the ocean and/or                          perhaps lower than the long-term average along the east
atmosphere (Figure 5). The subjective analogue seasons                      coast. Overall, this indicates that some regions will need
are selected with expert interpretation from NIWA. The                      to be prepared for elevated fire weather conditions to
objective analogue seasons are automatically selected via                   continue.

                                                                                Forecaster-selected analogue season - Apr to Jun

                                                                                                             2021

                                                                                                             2017

                                                                                                             2010

                                                                                                             2006

                                                                                                             1999

                                                                                                             1988

                                                                                                             2011

                                                                                                             2008

                                                                                 Machine-selected analogue season - Apr to Jun

                                                                                                             2004

                                                                                                             2001

                                                                                                             1981

                                                                                                             2000

                                                                                                             2011

                                                                                                             2013

                                                                                                             1990

                                                                                                             1999

Figure 5: Analogue fire seasons as selected with expert interpretation from NIWA (top) and automated computer analysis (bottom). The Fire
Weather Index (FWI) is a combination of the Initial Spread Index and Buildup Index, and is a numerical rating of the potential frontal fire intensity.
In effect, it indicates fire intensity by combining the rate of fire spread with the amount of fuel being consumed. Here, the Fire Weather Index
anomaly is calculated by averaging historical analogue years together and comparing to the average FWI between 1991-2020 for the relevant
season.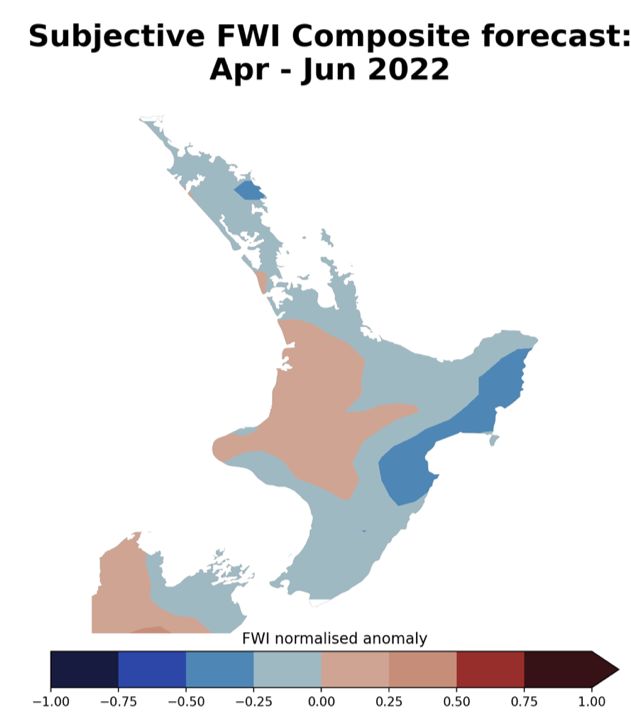
Climate outlook: April Climate outlook: April - June
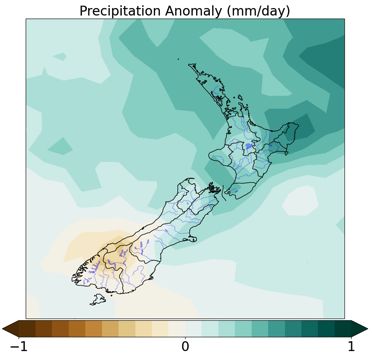
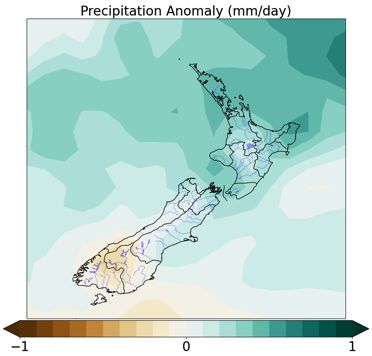
April’s air flows are generally expected to be easterly, Mid-autumn to early winter is still expected to have more
continuing the trend of recent months. The signal is for a easterly winds than normal. Temperatures overall look to
wetter than normal month in eastern areas, although be mild for the time of year (Figure 7). Rainfall may be
rainfall may be more intermittent in the central and near normal to above normal for much of the North
western North Island. Wind speeds are expected to be Island, although with stretches of dry weather in between
slightly below normal in the lower North Island, although rainier periods. Somewhat humid conditions may
slightly above normal winds may occur in Northland. continue in the east, although relative humidity is
Above average temperatures again appear very likely, forecast to be slightly below normal in western areas.
especially in the west. Relative humidity is forecast to be Wind speeds continue to look lighter than normal except
higher than normal in eastern areas and lower in western potentially in the Far North. These climate anomalies
areas (Figure 6). continue to be well-aligned with La Niña conditions.
The tropical cyclone season for the Southern Hemisphere
runs through to April, with the odd tropical cyclone
occurring outside this period. On average, at least one ex-
tropical cyclone passes within 550 km of New Zealand
each year. This season the risk is considered elevated
compared to normal.
Climate outlook: April
Figure 6: Climate outlook for March showing forecast temperature (left), rainfall (middle) and relative humidity (right) anomalies.
Climate outlook: April - June
Figure 7: Climate outlook for March-May showing forecast temperature (left), rainfall (middle) and relative humidity (right) anomalies.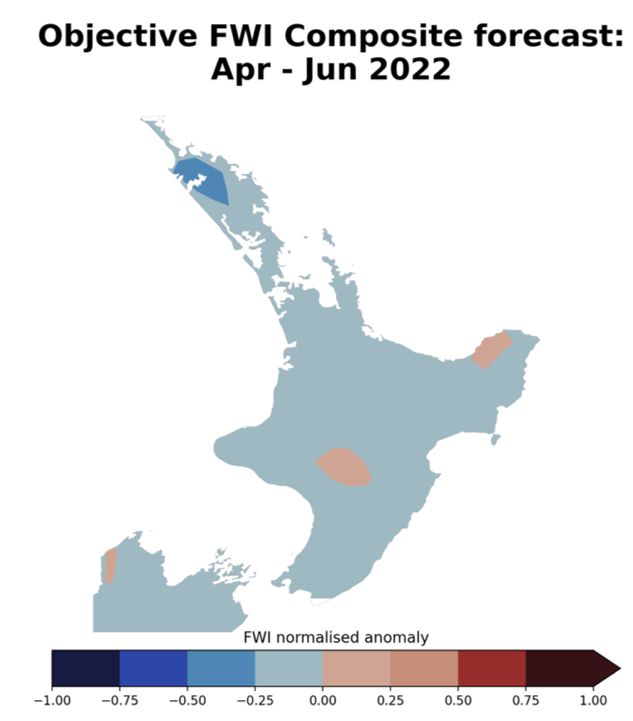
Expected impact on fuels and fire danger

Heavy rainfall over the top half of the North Island            The net effect of the climatic outlook is that northern
forecast for the next few days will see fire dangers reduce     parts of the North Island, and possibly central regions, are
in most areas. This includes in the Northland, Auckland,        likely to have normal to slightly above normal fire danger.
Waikato and Central North island regions, where                 Regions with currently elevated values that may miss
remaining areas with elevated DMC and BUI will return to        most of the forecast heavy rainfall, such as the Far North
more normal levels. Possible exceptions to this are in the      and south Waikato, will quickly return to normal or
Far North (Aupori Peninsula) and southern Waikato areas         slightly above normal levels in the absence of further
which may miss the heaviest falls.                              rainfall. Remaining areas across the southern half of the
                                                                North Island are likely to see more normal or below
In areas where underlying dryness remains, or following         normal fire danger levels, especially in the east (Hawkes
dry periods between rain events, fire dangers will              Bay and Wairarapa). However, even these areas will still
increase again to more normal or even slightly above            experience periods of elevated fire danger, associated
normal levels. Drying will be exacerbated by warmer than        with stronger winds or dry periods between rainfall
normal temperatures, lower humidity and wind. Elevated          events, when wildfire ignition and spread potential could
DMC and BUI levels mean that fires can still involve            be high.
medium and subsurface fuels. While having less impact
on fire spread rates, these fuels increase fire intensity and
make suppression more difficult.                                Grass growth & curing

Fine fuels are also critically important to fire behaviour,     Most fires start in fine fuels such as grass, which ignite
with lower fine fuel moistures resulting in easier ignitions    easily and rapidly spread to other fuels. Grass fuel loads
and faster spread rates. Fine fuels are affected by             and curing rates should therefore be closely monitored as
temperature, wind, humidity and precipitation. Based on         a critical factor in assessing fire danger.
the outlook above, it is anticipated that drying rates will
continue to be high due to the warmer temperatures in           Most of the North Island has continued to experience
most parts of the North Island. This may be exacerbated         good growing conditions as a result of the above average
in the west by lower humidity values, but offset in the         temperatures, and higher than normal summer rainfall.
east by higher humidity associated with more onshore            This has resulted in increased grass fuel loads in many
easterly winds. In the absence of rain, fine fuels will         areas, especially where grazing has not kept up with the
quickly dry out again, increasing the risk of ignition and      grass growth. As summer has progressed, these grass
fire spread.                                                    fuels have died off and dried out in many areas.

Scrub fuels in particular respond very quickly and can          But as we move into autumn with its generally cooler and
produce extreme fire behaviour within relatively short          damper conditions, these grass fuels will begin to green
periods since recent rain. Grass fuels may also still have      up again. This will be encouraged by the occurrence of
high amounts of dead material present, although will            rain and may already be underway in some areas.
begin to green up in many areas if they haven’t already.        However, in drier parts of the island, a significant
Vigilance therefore needs to be maintained around               proportion of dead grass material may remain, including
communities and high value sites where the prevailing           as dead thatch beneath new green growth, so that curing
surrounding fuel are scrub or grasses with higher than          levels remain high.
normal fuel loads.
                                                                Subject to weather and topography influences, grass fire
                                                                ease of ignition, intensity and spread rates increase
                                                                steadily as the curing percentage increases. Whereas a
                                                                fire in 60% cured grass is able to
                                                                spread faster and produce higher flame lengths and fire
                                                                intensities.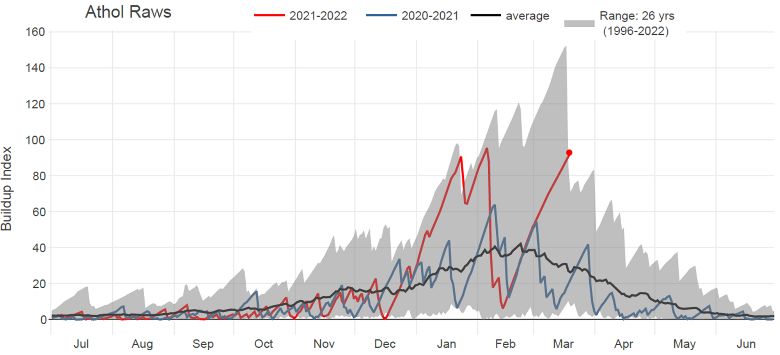
August            September               October             November              December               January              February                March                 April
   2021-2022
   2020-2021
   2016-2017
   2009-2010

Figure 8: Monthly average severity rating for 2021-2022 up to and including February and the comparative years of 2020/2021, 2016/2017 and 2009/2010. These are analogue years for the current season and
give us an insight into what the upcoming season may be like.
February 2022                           March 2021                                  March 2017
  Fire Weather Index
  Buildup Index
  Initial Spread Index

Figure 9: The most recent observed month (left column) and analogue months for March (middle and right columns); monthly average for the
Fire Weather Index (top), Buildup Index (middle) and Initial Spread Index (bottom).
February 2022                        March 2021                                  March 2017
  Drought Code
  Duff Mositure Code
  Fine Fuel Mositure Code

Figure 10: The most recent observed month (left column) and analogue months for March (middle and right columns); monthly average for the
Drought Code (top), Duff Moisture Code (middle) and Fine Fuel Moisture Code (bottom).
February 2022                              March 2021                                  March 2017
 Forest Fire Danger
 Grass Fire Danger
 Scrub Fire Danger

Figure 11: The most recent observed month (left column) and analogue months for February (middle and right columns); monthly average for
the Forest Fire Danger (top), Grass Fire Danger (middle) and Scrub Fire Danger (bottom).
Background information on fire weather indices and codes

                                                               Initial Spread Index:
Fine Fuel Moisture Code:         0-74      Difficult                                         0-3       Slow rate of spread
                                                               Combines the effect of
An indicator of the relevant     75-84     Moderately easy     wind speed and the            4-7       Moderate fast
ease of ignition and             85-88     Easy                                              8-12      Fast
                                                               FFMC,    providing   a
flammability of fine fuels.      89-91     Very Easy           numerical rating of           13-15     Very fast
                                 92+       Extreme Easy        potential fire spread         16+       Extremely fast
                                                               rate.

Duff Moisture Code: A    rating of the average moisture
content of loosely       0-10          Little mop-up needs     Fire Weather Index:
compacted organic                                                                             0-5       Low fire intensity
                         11-20         Moderate                Combines the ISI and BUI
soil          layers                                           to indicate the potential      6-12      Moderate
                         21-30         Difficult
(duff/humus)      of                                           head fire intensity of a       13-20     High
                         31-40         Difficult & extended
moderate depth, and                                            spreading fire (on level       21-29     Very high
                         41+           Extreme & extensive
medium-sized woody                                             terrain).
                                                                                              30+       Extreme
material.

                                                               Daily Severity Rating: A numerical rating of the daily fire
Drought Code: A 0-100              Little mop-up needs         weather severity at a particular station, based on the FWI.
rating of the average 101-175 Moderate                         It indicates the increasing amount of work and difficulty
moisture content of 176-250 Difficult                          of controlling a fire as fire intensity increases. The DSR can
deep,          compact, 251-300 Difficult & extended           be averaged over any period to provide monthly or
organic soil layers, and 301+      Extreme & extensive         seasonal severity ratings.
a useful indicator of
seasonal drought effects on forest fuels and amount of         Monthly Severity Rating: is the average of the DSR values
smouldering in deep duff layers and large logs.                over the month. DSR and MSR captures the effects of
                                                               both wind and fuel dryness on potential fire intensity, and
                                                               therefore control difficulty and the amount of work
Buildup Index: Combines        0-15      Easy control          required         to
the DMC and DC, and            16-30     Not difficult         suppress a fire. It 0-1 Low fire behaviour potential
represents the total           31-45     Difficult             allows          for 1-3 Moderate fire potential
amount of fuel available       46-59     Very difficult        comparison of the 3-7 High to very high fire potential
for combustion.                60+       Extremely difficult   severity of fire            Extreme fire behaviour
                                                               weather from one 7+ potential
                                                               year to another.

            This document was prepared by NIWA in collaboration with Fire and Emergency NZ
You can also read