National Drought Early Warning Bulletin July 2021 - NATIONAL DROUGHT MANAGEMENT AUTHORITY
←
→
Page content transcription
If your browser does not render page correctly, please read the page content below

NATIONAL DROUGHT MANAGEMENT AUTHORITY

National Drought Early Warning Bulletin

               July 2021

                     1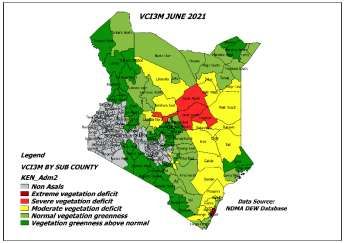
Drought indicators
Rainfall Performance
The month of June 2021 marked the beginning of the cold
season with several parts of ASAL counties remaining dry.
According to metrological department, most of ASAL
counties received less than 50 percent of average rainfall
with most parts of Marsabit, Wajir, Garissa, Isiolo,
Kajiado, Tana River and Turkana receiving less than 25
percent of average amounts of rainfall during the month
of June as shown in Figure 1a.The coastal strip received
over 75 percent of average amounts. Spatio-temporal
rainfall distribution was generally uneven and poor across
the ASAL counties. Figure 1a indicates rainfall
                                                           Figure 1 a.June Rainfall Performance
performance during the month of May as percentage of
long term mean (LTM).

Rainfall Forecast
                                        According to Kenya Meteorological Department (KMD),
                                        several parts of the country will be generally dry and
                                        sunny during the month of July 2021.Counties in
                                        Northwestern Region including Turkana, West Pokot and
                                        Samburu are likely to receive occasional rainfall during
                                        the beginning of the month and near average rainfall
                                        towards the end of the month. The expected total rainfall
                                        is likely to be near to above the long term average for
                                        July. Counties in the Coastal strip including Tana River,
                                        Kilifi, Lamu and Kwale will likely receive occasional
                                        rainfall. The expected total rainfall is likely to be near the
                                        long-term average amounts for July. The Highlands East
                                        of the Rift Valley counties including Nyeri, Meru, Embu
 Figure 1b.Rainfall forecast
                                        and Tharaka Nithi are expected to experience occasional
                                      cool and cloudy (overcast skies) conditions with occasional
 rains/drizzles while the Northeastern Kenya counties including Mandera, Marsabit, Wajir,
 Garissa and Isiolo and Southeastern lowlands counties including Machakos, Makueni, Kitui,
 Taita Taveta and parts of Kajiado are likely to remain generally sunny and dry. Occasional cool
 and cloudy conditions are however likely to occur over some counties in southeastern Kenya
 especially those bordering the highlands east of the rift valley.

                                                  2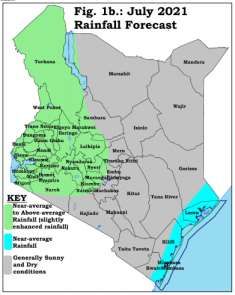
Vegetation condition
 Figure 2 matches the vegetation condition index (VCI) in June 2020 with that in June 2021.When
 compared to similar period last year and the long-term average, the current condition of
 vegetation is considerably below that of June 2020.

 Figure 2: Comparison of Vegetation Condition Index (VCI), June 2020 and June 2021
Vegetation Condition Index (3 Month) June           Vegetation Condition Index (3 Month) June
2020                                                2021

 As at the end of June 2021, counties experiencing vegetation deficit as per vegetation condition
 index (VCI) included Marsabit, Garissa, Isiolo, Tana River, Wajir and Kilifi.The six counties
 experienced moderate vegetation deficit except Isiolo that is in severe vegetation deficit band
 implying that the VCI values recorded in June 2021 were below normal indicating that the rains
 received so far were inadequate and had not brought about vegetation regeneration to the usual
 ranges for the period in the six counties.

 Vegetation Condition Index (VCI) status as at the end of June 2021 is summarized in Table 1. At
 sub county level; Kilifi South, Rabai (Kilifi), Isiolo North and Isiolo South (Isiolo County) and
 Lagdera (Garissa) recorded the lowest VCI values with Kilifi two sub counties in extreme
 vegetation deficit band. Lagdera (Garissa) and Isiolo (Isiolo North and South) are in severe
 vegetation deficit band which is attributed to the poor rains received in June 2021 in those
 particular areas. Generally, the negative VCI trends point to poor regeneration of pasture and
 browse during the month of June 2021.The vegetation condition has deteriorated as compared
 to the previous month of May 2021.

                                                3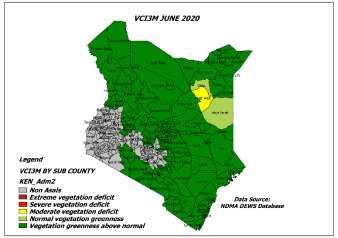
Table 1: Vegetation Condition Index (VCI), June 2021
 Category             County                          Sub Counties (No)

 Extreme                                                                                           (2)
                                                      Rabai and Kilifi South (Kilifi)
 Severe vegetation                 (1)                                                              (3)
 deficit              Isiolo                          Lagdera (Garissa), Isiolo (Isiolo North, Isiolo South)

 Moderate                          (5)                                                            (21)
 vegetation deficit   Marsabit                        Garissa (Balambala, Fafi, Dadaab, Township) Kilifi (Ganze, Kaloleni, Magarini, Malindi)
                      Wajir                           Kitui (Kitui Rural) Kwale (Kinango) Laikipia (Laikipia North) Marsabit (Laisaimis) Samburu
                      Garissa                         (Samburu east) Tana River (Bura, Galole, Garsen) Wajir (Wajir East, Eldas, Wajir south)
                      Tana river
                      Kilifi
 Normal vegetation                  (6)                                                          (35)
 greenness            Kitui, Taita Taveta, Samburu,   Wajir (Tarbaj Wajir-West Wajir-North Turkana (Turkana North, Turkana East) Meru
                      Lamu, Kwale, Laikipia           (Tigania East, Igembe North) Taita taveta (Taveta, Voi)
                                                      Marsabit (Moyale North Horr Saku) Mandera (Mandera South Mandera West, Lafey
                                                      Mandera East)
                                                      Makueni (Makueni, Kibwezi East, Kibwezi West) Lamu (Lamu West)
                                                      Laikipia (Laikipia East, Laikipia-West) Kwale (Lungalunga Matuga, Msambweni) Kitui
                                                      (Kitui South, Kitui West, Kitui East, Mwingi Central, Mwingi North, Mwingi West) Kilifi
                                                      (Kilifi-North) Embu (Manyatta) Baringo (Mogotio)
 Vegetation                      (11)                                                            (54)
 greenness above      Baringo, Embu, Turkana,         Baringo (Baringo Central, Eldama Ravine, Baringo North, Baringo South, Tiaty) Embu
 normal               Kajiado, Makueni, Meru,         (Mbeere North, Mbeere South, Runyenjes) Garissa (Ijara) Kajiado (Kajiado-Central,
                      Narok, Nyeri, Tharaka Nithi,    Kajiado-East, Kajiado-North, Kajiado-South), Kajiado-West Kitui (Kitui-Central)
                      West Pokot, Mandera             Lamu (Lamu East, Lamu West,) Makueni (Kilome, Mbooni) Mandera (Banissa, Mandera
                                                      North)
                                                      Meru (Buuri, Central Imenti, Igembe Central, Igembe South, North Imenti, South Imenti,
                                                      South Imenti South Imenti, Tigania West) Narok (Narok-East, Emurua Dikirr, Kilgoris,
                                                      Narok-North, Narok-South, Narok-West) Nyeri (Kieni, Mathira, Mukurweini, Othaya,
                                                      Tetu, Township) Taita Taveta (Mwatate, Wundanyi)
                                                      Tharaka Nithi (Chuka, Maara, Tharaka) Turkana (Turkana Central, Loima, Turkana South,
                                                      Turkana West) Makueni (Kaiti) West Pokot (Kacheliba, Kapenguria, West-Pokot South,
                                                      Sigor)

Livestock production
In nearly all the counties, livestock production related indicators are currently fair and on
declining trend as compared to normal period. The condition is as result of decline in pasture
availability, both in terms of quantity and quality and increase in distances covered by livestock
in search of pasture and water due to drying open water sources.

Pasture and browse condition
The state of pasture and browse in most of the arid and semi-arid counties was generally fair to
poor condition with Isiolo, Garissa, Wajir, Tana river, Laikipia and Kitui reporting poor pasture
condition as shown in Table 2.The current pasture and browse condition is on worsening trend
as compared to the previous month due to the poor performance of the 2021 long rains season.

                                                                     4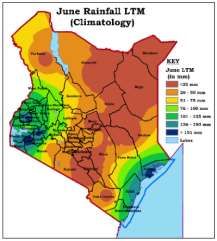
Table 2.0: Pasture and browse condition, June 2021
                       Pasture condition                                  Browse condition
 Poor           Fair                       Good                Poor      Fair                Good
 Baringo        Embu Marsabit              Lamu                Garissa   Baringo             Kajiado kwale
 Garissa        Kajiado                    Taita Taveta        Isiolo    Embu                Laikipia
 Isiolo         Kilifi                     Tharaka Nithi       Wajir     Kilifi              Lamu
 Kitui          Makueni                                                  Kitui               Narok
 Laikipia       Mandera                                                  Makueni             Taita Taveta
 Tana River     Meru Kwale                                               Mandera             Tharaka Nithi
 Wajir          Narok                                                    Meru
                Nyeri                                                    Nyeri
                Samburu                                                  Samburu
                Turkana                                                  Tana River
                West Pokot                                               Turkana
                                                                         West Pokot

Livestock body condition
The current livestock body condition is on worsening trend as compared to previous month due
to deterioration in pasture and browse quantity and quality. Overall, the current body condition
of most livestock is below normal in comparison to similar periods during a normal year.
Consequently, most counties except Lamu and Wajir reported livestock body condition as fair to
good as shown in Table 3.

Table 3.0: Livestock body condition, June 2021
                       Cattle                                                   Goats
 Poor         Fair                         Good                Poor      Fair                Good
 Lamu         Baringo Kwale                Kajiado             Lamu      Baringo Marsabit    Kajiado
              Embu Marsabit                Makueni             Wajir     Embu                Makueni
              Garissa                      Meru                          Garissa             Meru
              Isiolo                       Taita Taveta                  Isiolo              Taita Taveta
              Kilifi                       Tharaka Nithi                 Kilifi              Tharaka Nithi
              Kitui                                                      Kitui               Kwale
              Laikipia                                                   Laikipia
              Mandera                                                    Mandera
              Narok                                                      Narok
              Nyeri                                                      Nyeri
              Samburu                                                    Samburu
              Tana River                                                 Tana River
              Wajir                                                      West Pokot
              West Pokot                                                 Turkana
              Turkana

Milk production
Milk production is on worsening trend as compared to the previous month as 11 counties
including Embu, Garissa, Kajiado, Kilifi, Kitui, Marsabit, Meru, Nyeri, Samburu, Taita Taveta, and
Tana river are on worsening trend while twelve (12) counties namely; Baringo, Garissa, Isiolo
Kajiado, Kilifi, Kitui, Laikipia, Marsabit, Meru, Tharaka Nithi, Turkana and Kwale have milk
production below LTA. The following seven (7) counties including Embu, Makueni, Narok, Nyeri
Taita Taveta, Tana River and West Pokot recorded milk production above LTA. The below normal
                                                           5
milk production is attributed to poor rainfall performance for the 2021 long rains season. The
current milk production status is below average as compared to normal year. Milk production
trends in the 23 ASAL counties is presented in table 4.0.
Table 4.0: Milk production, June 2021
Indicator Current status Trend
Above LTA At LTA Below LTA Improving Stable Worsening
Milk Embu Lamu Baringo Narok Baringo Embu
Production Makueni Mandera Garissa Tharaka Nithi Isiolo Garissa
Narok Samburu Isiolo Turkana Laikipia Kajiado
Nyeri Wajir Kajiado West Pokot Lamu Kilifi
Taita Taveta Kilifi Makueni Kitui
Tana River Kitui Mandera Marsabit
West Pokot Laikipia Wajir Meru
Marsabit Kwale Nyeri
Meru Samburu
Tharaka Nithi Taita Taveta
Turkana Tana River
Kwale
Cattle prices
In majority of the county’s cattle prices are stable as compared to the previous month and above
LTA owing mainly to the fact that the state of cattle body condition is still fair as illustrated in
Table 5. The cattle prices in Mandera, Nyeri, Turkana and Marsabit are below due to deteriorating
body condition in those particular counties. The prevailing price is higher than the three-year
average price of cattle for the month of June in about 65 percent of the ASAL counties as shown
in Table 4.
Table 5.0: Cattle prices, June 2021
Indicator Current status Trend
Above LTA At LTA Below LTA Improving Stable Worsening
Cattle Baringo Embu Laikipia Mandera Lamu Baringo Embu Kilifi
Prices Garissa Isiolo Taita Taveta Nyeri Narok Garissa Isiolo Kitui
Kajiado Kilifi Wajir Turkana Tana River Kajiado Turkana
Kitui Lamu Marsabit Laikipia
Meru Narok Makueni Meru
Samburu Mandera Nyeri
Makueni Samburu
Tana River Taita Taveta
Tharaka Nithi Tharaka Nithi
West Pokot Wajir
West Pokot
Marsabit
Goat prices
Table 6 summarizes the trends in goat prices in ASAL counties. During the month of May , goat
prices in majority of the ASAL counties were mostly above average or close to LTA except in
6Marsabit,Makueni and Nyeri counties.The goat prices have remained stable as compared to the
previous month due to fair state of livestock body condition however they remain low as
compared to normal season.
Table 6.0: Goat prices, June 2021
Indicator Current status Trend
Above LTA At LTA Below LTA Improving Stable Worsening
Goat Prices Baringo Garissa Makueni Tana River Baringo Embu Kitui
Embu Isiolo Nyeri Garissa Isiolo Makueni
Kajiado Kitui Marsabit Kajiado Kilifi Marsabit
Kilifi Lamu Laikipia Lamu
Laikipia Mandera Mandera Meru
Narok Meru Narok Nyeri
Samburu Tharaka Nithi Samburu Wajir
Taita Taveta Wajir Taita Taveta
Tana River Turkana Tharaka Nithi
West Pokot Kwale West Pokot
Turkana Kwale
Crop production
March to May (MAM) long rains season ended across the marginal agricultural areas and
thus Kilifi,Makueni,Nyeri(Kieni),Taita taveta and Kwale reported fair crop condition as
compared to good in normal season however Kitui reported that most of the crops withered
due to moisture stress as result of depressed rains. Crops in marginal agricultural counties
were at grain filling and harvesting stage. Farmers are expecting below average crop
production due to depressed rains received.
Maize prices
In most counties, the price of maize remained stable in June as compared to the previous month.
As demonstrated in Table 7, the current maize prices are largely favourable with 12 counties
recording prices that are below LTA however the prices of maize are increasing and thus require
close monitoring.Garissa,Mandera,Marsabit ,Taita taveta,Wajir have maize prices above LTA.
Table 7.0: Maize prices, June 2021
7Indicator Current status Trend
Above LTA At/close to LTA Below LTA Improving Stable Worsening
Maize Prices Garissa Isiolo Baringo Kajiado Baringo Embu
Mandera Kajiado Embu Meru Garissa Isiolo
Taita Taveta Lamu Kilifi Wajir Kilifi Kitui
Wajir Makueni Kitui West Pokot Laikipia Lamu
Marsabit Narok Laikipia Makueni Narok
Nyeri Meru Mandera Nyeri
Turkana Samburu Samburu
Tana River Taita Taveta
Tharaka Nithi Tana river
West Pokot Tharaka Nithi
Kwale Turkana Kwale
Marsabit
Access to water for households
In comparison to the long term average, 20 counties distances to water for households is
currently above the LTA. In comparison with the previous month, there is increase in distance to
household water source as result of the drying water sources.The late onset of the MAM rains
coupled with poor performance is the reason behind the above LTA trekking distances. The trend
in distances walked by households to access water is provided in Table 8.
Table 8.0: Distance from households to main water sources, June 2021.
Indicator Current status Trend
Above LTA At LTA Below LTA Improving Stable Worsening
Distance from Baringo Embu Kitui Baringo Garissa Embu Isiolo
households to main Garissa Isiolo Tharaka Nithi Lamu Narok Kajiado Kilifi
water sources Kajiado Kilifi Marsabit Tana River Taita Taveta Kitui Laikipia
Laikipia Lamu West Pokot Makueni Meru
Makueni Meru Turkana Mandera Nyeri
Mandera Narok Kwale Samburu
Nyeri Wajir Tharaka Nithi
Samburu Wajir
Taita Taveta Marsabit
Tana River
West Pokot
Turkana
Kwale
Access to water for livestock
The trend in the distance walked by livestock in search of water is presented in Table 9. Compared
with the previous month, the current trekking distance to water source from grazing areas is on
worsening trend across the counties. In addition, access to water for livestock in 17 counties was
above long- term average attributed to the poor performance of the March April May (MAM)
long rains season as shown in Table 9.0.
Table 9.0: Distance from livestock grazing area to main water sources, June 2021
Indicator Current status Trend
8Above LTA At LTA Below LTA Improving Stable Worsening
Distance from Baringo Embu Mandera Kitui Narok Baringo Embu Isiolo
livestock grazing Garissa Isiolo Tana River Meru Garissa Kajiado Kitui
area to main water Kajiado Kilifi Tharaka Nithi Kilifi Laikipia Meru
sources Laikipia Lamu Marsabit Lamu Makueni Nyeri
Makueni Narok Mandera Samburu
Samburu Nyeri West Pokot Taita Taveta
Taita Taveta Turkana Tana River
Wajir Tharaka Nithi
West Pokot Wajir
Turkana Marsabit
Kwale Kwale
Terms of trade
Table 10 shows the trends in terms of trade (ToT) between the relative price of goats and maize
in ASAL counties. In all counties except Mandera and Nyeri(kieni),ToT values are above the long-
term average (LTA). The TOT is however on worsening trend as compared to the previous month
with ten(10) counties reporting worsening trend. The worsening trend is as result of increasing
maize prices in relation to stable goat prices.
Table 10.0: Terms of trade, June 2021
Indicator Current status Trend
Above LTA At LTA Below LTA Improving Stable Worsening
Terms of Baringo Embu Garissa Mandera Baringo Embu Kajiado
trade Isiolo Kajiado Meru Nyeri Garissa Kilifi
(ToT) Kilifi Kitui Taita Taveta Isiolo Kitui
Laikipia Tharaka Nithi Lamu Laikipia
Lamu Wajir Narok Makueni
Makueni Marsabit Nyeri Mandera
Narok Taita Taveta Meru
Samburu Tana River Samburu
Tana River Tharaka Nithi West Pokot
West Pokot Wajir Marsabit
Turkana Turkana
Health and nutrition
Table 11 shows the trend in the proportion of children at risk of malnutrition (MUAC) across the
ASAL counties. As compared to the previous month,the MUAC is on worsening trend with
eight(8) counties including kajiado,Laikipia,Lamu,Makueni,Nyeri,Samburu,Tana River and Wajir
recording worsening trend.The negative trend in malnutrition of the eight(8)counties was
attributed to reduced milk consumption owing to decrease in milk production and fewer number
of integrated health outreaches delivering essential nutrition services.
Table 11.0: Children at risk of malnutrition (MUAC), June 2021
Indicator Current status Trend
9Above LTA At LTA Below LTA Improving Stable Worsening
Embu Kilifi Baringo Baringo Embu Kajiado
Isiolo Kwale Garissa Garissa Isiolo Laikipia
MUAC Lamu Laikipia Kajiado Kilifi Kitui Lamu
Mandera Makueni Kitui Kwale Marsabit Makueni
Marsabit Meru Narok Mandera Meru Nyeri
Tana River Samburu Nyeri Narok Taita Taveta Samburu
Wajir Taita Taveta Tharaka Nithi West Pokot Tharaka Nithi Tana River
Turkana West Pokot Turkana Wajir
Drought phase classification
Table 12 sums up the trends in drought phase classification as at end of June 2021.On the basis
of the range of indicators monitored above, Twelve (12) counties namely Marsabit, Mandera,
Garissa, Wajir, Kilifi, Tana River, Lamu, Samburu, Kitui, Lamu, Isiolo and Laikipia are in the alert
drought phase while Eleven (11) counties reported Normal drought phase as at July. During the
month under review, Fourteen (14) counties reported worsening trend, eight (8) counties
recorded stable trend while one county reported an improvement .The worsening trend across
most of ASAL counties is as result of the poor rains received during the March April May (MAM)
2021 long rains season.
Table 12.0: Drought phase classification, June 2021
Drought Trend
status Improving Stable Worsening
Normal Baringo Kajiado
Embu Meru
Narok Nyeri
Taita Taveta Kwale
Tharaka Nithi
West Pokot
Turkana
Alert Lamu Kitui Garissa Isiolo
Kilifi Laikipia
Makueni Mandera
Samburu
Tana River
Wajir
Marsabit
Alarm
Recovery
Recommendations
10Food and safety nets
Provision of food assistance and scaling up of cash transfers targeting households which are
currently food insecure as a result of the prevailing drought stress.
Livestock sector
Provision of livestock feeds and supplements.
Treatment and vaccination against emerging livestock diseases.
Activation of satellite livestock markets and commercial destocking to salvage pastoralists
against imminent losses with expected progression of the long dry spell.
Water sector
Support water trucking interventions.
Rehabilitation and maintenance of water facilities.
Provision of fuel subsidies to motorized boreholes
Procurement and distribution of water storage tanks.
Health and nutrition sector
Support on hygiene and sanitation promotions
Provisions for severe acute malnutrition - Ready to Use Therapeutic Food (RUTF).
Supplies for moderate acute malnutrition - Ready to Use Supplementary Food (RUSF).
Education sector
Enhance hygiene promotion in learning institutions.
Provision of food to subsidize school fees in boarding secondary schools.
Peace and security sector
Facilitating intra/inter communities peace dialogues and resource use agreements.
Coordination of peace and security activities in conflict prone counties.
Coordination
Support County Steering Groups (CSGs) to effectively coordinate drought response activities.
11Table 13: Vegetation Condition Index (VCI-3 month) as at 27th June 2021
ADMINISTRATIVE UNIT DROUGHT CATEGORIES/REMARKS
COUNTY Sub County VCI-3 VCI-3 Color VCI values Drought Category
month as month as (3-month)
at 30th at 27th ≥50 Vegetation greenness above normal
May 2021 June >=35 - =20 - =10 -W.Tarbaj 45.5 40
W West
29.86 26.24
SAMBURU County 33.83 38.72 The county improved from moderate vegetation deficit to Normal vegetation
S East 27.57 28.66 greenness in the month under review when compared to the previous month of
May. Samburu East remained in Moderate vegetation deficit band.
S. North 38.93 48.33
S. West 41.81 46.59
ADMINISTRATIVE UNIT DROUGHT CATEGORIES/REMARKS
COUNTY Sub County VCI-3 month VCI-3 Color VCI values Drought Category
as at 30th month (3-month)
May 2021 as at 27th ≥50 Vegetation greenness above normal
June >=35 - =20 - =10 -L. West 40.16 44.57
THARAKA County 57.05 62.68 The county is in Above normal vegetation greenness in the month under review. The
NITHI Chulga 66.97 65.65 situation is stable when compared to the previous month of May. Tharaka sub-
county improved from normal to above normal vegetation greenness.
Maara 69.81 64
Tharaka 49.31 61.13
WEST County 50.93 56.87 The vegetation greenness was above normal for the county and all the sub-counties
POKOT Kacheliba 44.2 53.22 with Kacheliba and Sigor improving from normal to above normal vegetation
greenness.
Kapenguria 58.28 59.5
Pokot South 64.22 70.36
Sigor 49.11 53.32
EMBU County 64.33 57.06 The county and its sub-counties remained stable during the month of June across
Manyatta 64.57 48.55 most of the sub-counties with vegetation greenness above normal. Manyatta sub-
county deteriorated from above normal to normal vegetation greenness.
Mbeere North 65.56 64.02
Mbeere South 61.9 55.41
Runyenjes 70.42 57.16
ADMINISTRATIVE UNIT
COUNTY Sub County VCI-3 VCI-3 Color VCI values Drought Category
month as month as (3-month)
at 30th at 27th ≥50 Vegetation greenness above normal
May 2021 June >=35 - =20 - =10 -County 56.62 55.81 The vegetation greenness is above normal across the county and its Sub-counties
MERU Buuri 57.08 56.9 except for Igembe North and Tigania East which recorded normal vegetation
greenness.
Central Imenti 65.95 56.37
Igembe Central 57.91 66.04
Igembe North 37.73 40.98
Igembe South 66.37 70.47
North Imenti 70.22 57.12
South Imenti 72.3 68.27
Tigania East 46.76 39.28
Tigania West 57.84 53.22
County 68.99 65.65 The county and its sub counties remained stable recording above normal vegetation
Kieni 63.64 63.9 greenness just like the previous month of May.
Mathira 68.72 59.21
Mukurweini 75.43 51.72
NYERI
Town 78.56 77.51
Othaya 81.71 79.14
Tetu 74.77 63.77
KILIFI County 27.2 24.93 Constancy in vegetation condition noted across the county and most of its sub
Ganze 21.49 22.94 counties recording moderate vegetation deficit. Kilifi North remained stable at
normal vegetation greenness. However, Rabai and Kilifi south sub-counties
Kaloleni 21.55 21.6
worsened from severe to extreme vegetation deficit.
Magarini 29.89 25.84
Malindi 28.85 24.94
Kilifi-North 40.11 42.32
Rabai 17.21 9.14
Kilifi-South 10.86 4.53
KWALE County 42.55 38.57 Normal vegetation greenness noted across the entire county which is stable when
Kinango 37.17 34.22 the month under review is compared to the previous month of May except Kinango
which worsened from normal to moderate vegetation deficit.
Lungalunga 53.4 48.88
Matuga 43.63 36.06
Msambweni 51.81 47.42
County 45.31 43.66 The entire county remained in normal vegetation greenness. Lamu east is in above
LAMU
Lamu East 51.19 51.66 normal vegetation greenness.
Lamu West 41.91 39.04
ADMINISTRATIVE UNIT DROUGHT CATEGORIES/REMARKS
COUNTY Sub County VCI-3 VCI-3 Color VCI values Drought Category
month as month as (3-month)
at 30th at 27th ≥50 Vegetation greenness above normal
May 2021 June >=35 - =20 - =10 -TAITA County 50.42 46.28 Decrease in the vegetation greenness condition from above normal to normal
TAVETA Mwatate 61.12 57.24 vegetation greenness. Voi sub-county remains in normal vegetation greenness while
the county worsened from above normal to normal greenness.
Taveta 58.76 52.83
Voi 42.31 38.93
Wundanyi 67.91 62.86
County 67.3 65.09
NAROK
Narok-East 64.52 65.23
Emurua Dikirr 70.98 66.12 The county and its sub-counties remained stable in above normal vegetation
Kilgoris 64.15 56.73 greenness band. The attributing factor is good MAM seasonal rainfall performance
Narok-North 61.21 63.82 in this region.
Narok-South 71.71 71
Narok-West 68.68 64.18
Annex 2.0 Summary of the drought early warning system
Each month, field monitors collect data in a number of sentinel sites across 23 arid and semi-arid
counties. This is then complemented by information from other sources, particularly satellite
data. For all indicators, the current value is compared with the long-term average for the time of
year in order to establish whether it falls within seasonal norms.
Four types of indicator are monitored, capturing different kinds of impact (Table 12). The
combined analysis from all four indicator groups then determines the particular drought phase:
normal, alert, alarm, emergency or recovery (Figure 5). Identifying the correct drought phase
helps to guide the most appropriate response for that stage in the drought cycle.
Table 11.0: Indicators monitored by the drought early warning system
Type of indicator Examples of indicators monitored Types of impact
Biophysical Rainfall data Environmental
Vegetation condition
State of water sources
Production Livestock body condition Livestock production
Milk production Crop production
Livestock migration
Livestock mortality
Crop production
Access Terms of trade (meat/maize) Markets
Milk consumption Access to food and water
Distances to water
Utilization MUAC (Mid-Upper Arm Circumference) Nutrition
Coping strategies Coping strategies
16Figure 3.0: Drought Phase Classification
1. NORMAL
Environmental
indicators show no
unusual fluctuations
5. RECOVERY 2. ALERT
Environmental Environmental
indicators return to indicators fluctuate
seasonal norms outside expected
seasonal ranges
3. ALARM
4. EMERGENCY Environmental and
All indicators are production indicators
outside normal ranges fluctuate outside
seasonal ranges
17You can also read