Northeast Council of Governments Comprehensive Economic Development Strategy 2019-2023
←
→
Page content transcription
If your browser does not render page correctly, please read the page content below

Northeast Council of Governments
          Comprehensive Economic
           Development Strategy
                 2019-2023

Prepared by: Northeast Council of Governments

416 Production Street N., Suite 1
Aberdeen, SD 57401
Phone: 605-626-2595
Fax: 605-626-2975
www.necog.org

Northeast Council of Governments: 2019-2023 CEDS   Page 1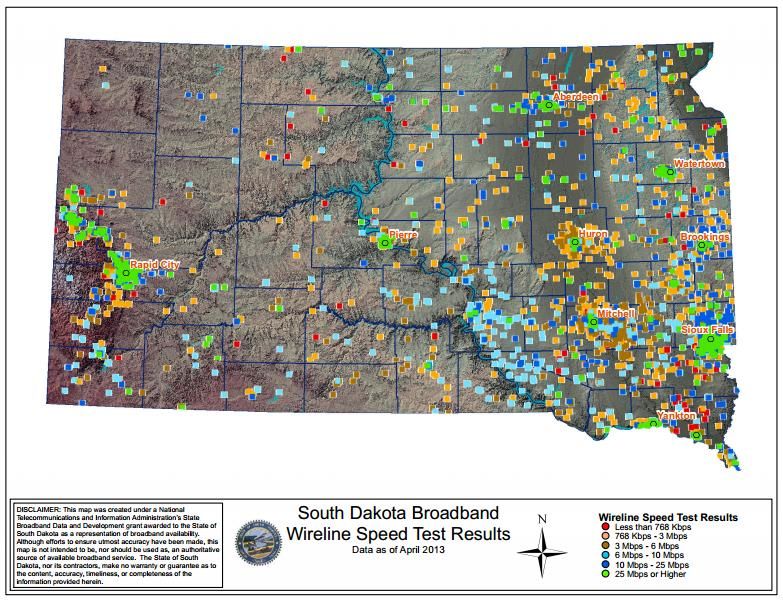
TABLE OF CONTENTS
EXECUTIVE SUMMARY ....................................................................................................................................................................... 3
INTRODUCTION ................................................................................................................................................................................. 4
Purpose ........................................................................................................................................................................................4
CEDS Committee ..........................................................................................................................................................................5
Process .........................................................................................................................................................................................6
SUMMARY BACKGROUND – ECONOMIC CONDITIONS ........................................................................................................................ 7
Population ....................................................................................................................................................................................7
Income..........................................................................................................................................................................................9
Labor Force .................................................................................................................................................................................11
Regional Economic Clusters ........................................................................................................................................................13
Business and Economic Development ........................................................................................................................................15
Housing.......................................................................................................................................................................................18
SWOT ANALYSIS................................................................................................................................................................................21
Regional Survey ..........................................................................................................................................................................21
CEDS Committee ........................................................................................................................................................................22
SWOT Chart ................................................................................................................................................................................23
STRATEGIC DIRECTION AND ACTION PLAN ........................................................................................................................................24
Strategy Context .........................................................................................................................................................................24
Goals, Objectives and Strategies ................................................................................................................................................24
LOCAL, REGIONAL AND PRIVATE SECTOR INVOLVEMENT ..................................................................................................................29
Local Level ..................................................................................................................................................................................29
Formal Planning ..........................................................................................................................................................................29
Project Strategies .......................................................................................................................................................................30
Special Purpose Research ...........................................................................................................................................................30
Regional Level.............................................................................................................................................................................31
Statewide Level ..........................................................................................................................................................................31
National Level .............................................................................................................................................................................32
Private Sector .............................................................................................................................................................................32
Summary ....................................................................................................................................................................................32
STRATEGIC PARTNERS .......................................................................................................................................................................33
Roles…. .......................................................................................................................................................................................33
Specific Relationships .................................................................................................................................................................34
PERFORMANCE MEASURES ...............................................................................................................................................................37
Methodology ..............................................................................................................................................................................37
Benchmarks ................................................................................................................................................................................37
Adjustments ...............................................................................................................................................................................38
ECONOMIC RESILIENCE .....................................................................................................................................................................39
Pre-disaster Preparedness ..........................................................................................................................................................39
Economic Resilience ...................................................................................................................................................................39
APPENDIX A: CEDS COMMITTEE/GOVERNING BODY MEMBERSHIP ROSTER ......................................................................................40
APPENDIX B: ADDITIONAL REGIONAL INFORMATION ........................................................................................................................42
APPENDIX C: CEDS RESOLUTION APPROVAL ......................................................................................................................................65
APPENDIX D: LIST OF TABLES.............................................................................................................................................................66
APPENDIX E: LIST OF FIGURES ...........................................................................................................................................................67
Northeast Council of Governments: 2019-2023 CEDS Page 2
EXECUTIVE SUMMARY
This Comprehensive Economic Development Strategy (CEDS) serves as an update of the 2013 Northeast
Council of Government (NECOG) CEDS. This update will cover the next five years. It will serve as the
basis for monitoring and evaluating the region's long term economic goals and strategies and coordinate
the economic development activities in the region. The CEDS process and document should be used as a
tool for developing goals and strategies that will guide the economic growth of the region.
The CEDS fulfills the requirements of the Economic Development Administration (EDA) as NECOG is
designated as an Economic Development District (EDD). A CEDS must be approved by the EDA for
counties and communities to be eligible for EDA funding programs. The NECOG staff and NECOG CEDS
committee worked with their member local units of government, economic development partners,
businesses, and area leaders along with input from community surveys to identify strengths and
weaknesses and update the goals, tasks, performance measures, schedule and evaluation indicators for
the region. The CEDS will assist in creating new partnerships in the region and strengthen existing ones
while promoting change and quality of life improvements for residents.
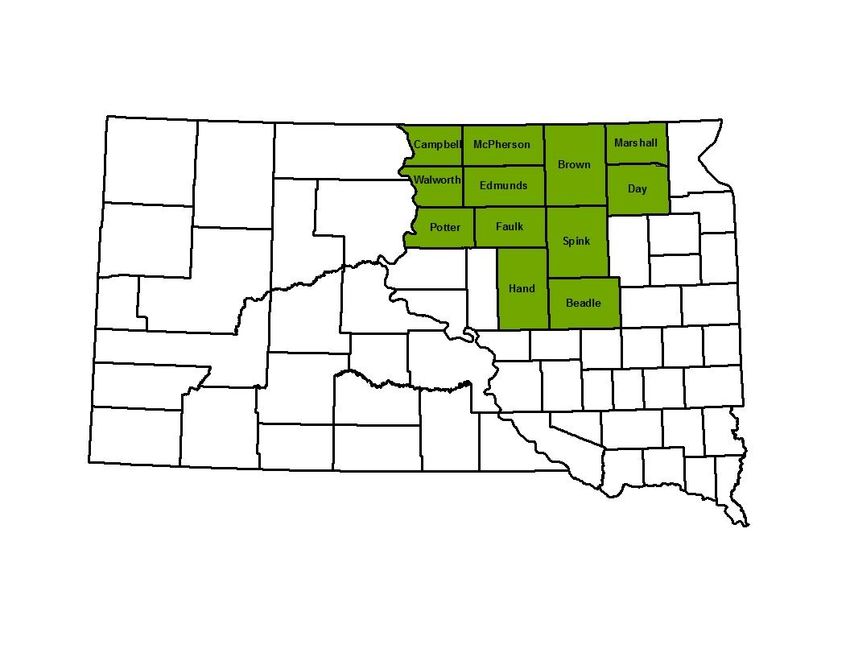
NECOG is composed of twelve counties located in Northeast South Dakota: Beadle, Brown, Campbell,
Day, Edmunds, Faulk, Hand, Marshall, McPherson, Potter, Spink and Walworth.
Key demographic/economic facts include:
Population growth in only 4 of the 12 counties from 2010-2017
All Counties have a median age higher than the state and national numbers
Over 60% of the municipalities in the region are under 200 in population
4 of 12 Counties exceed the per capita personal income of the state
9 of 12 counties have a poverty rate below the national rate
Unemployment rates for the region are below the national unemployment rate
Housing values and new housing construction below state and national numbers
Ag income dramatically affected by fluctuating commodity prices and weather conditions
The goals, objectives and strategies set forth in this document will help guide the region towards
furthered community and economic development. These goals which were developed through input
with local stakeholders and the CEDS committee are:
To Improve, Develop, and Expand Community and County infrastructure, programs and
facilities.
To Improve Public and Private Economic opportunities throughout the region.
Provide technical assistance to support public and private entities through professional staff.
The objectives, strategies and action plan for these goals are outlined further in this plan, as well as the
actions necessary to accomplish these goals. The action plan also provides performance measures to
check the region's progress.
This document strives to provide a strategy to address the weaknesses and build on the region's
strengths to improve the overall regional economy and quality of life. The document is dynamic in
nature and may change in the coming years based on the economic climate and feedback from
stakeholder.
Northeast Council of Governments: 2019-2023 CEDS Page 3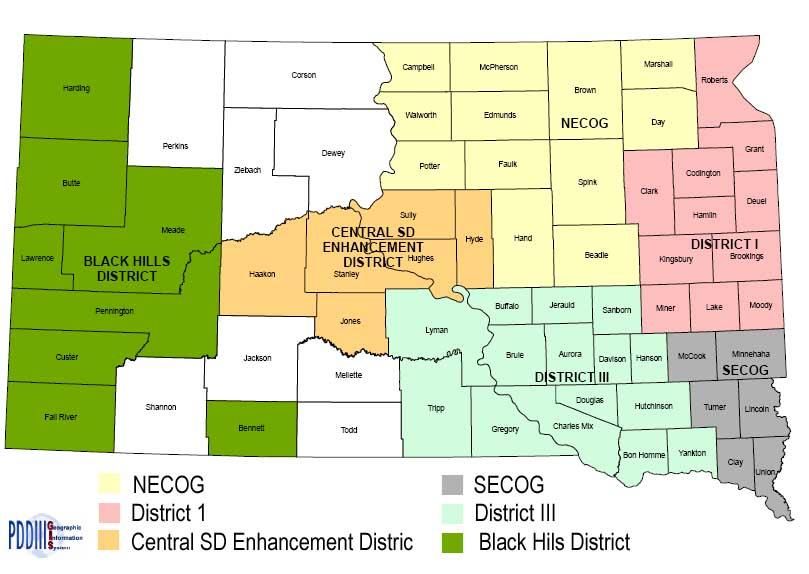
INTRODUCTION
Purpose

The Northeast Council of Governments (NECOG) is a Planning and Development District. Planning and
Development Districts were authorized in South Dakota in 1970 by executive order of Governor Frank
Farrar to promote regional cooperation and economical service delivery. Six Planning and Development
Districts currently operate in South Dakota. Each individual district is a voluntary association of
governments and operates under its own separate “Joint Exercises of Governmental Power” authorized
by South Dakota codified law 1-24. The NECOG region is comprised of the following 12 counties: Beadle,
Brown, Campbell, Day, Edmunds, Faulk, Hand, McPherson, Marshall, Potter, Spink and Walworth.

                  Figure 1: NECOG Region and South Dakota Planning District Map

NECOG has prepared this “Comprehensive Economic Development Strategy” (CEDS) to analyze the
economic and community development needs of NECOG’s twelve county region in northeast and north
central South Dakota and develop a guide for future community and economic efforts.

The CEDS document is mandated by the Economic Development Administration (EDA) and is used to
define Economic Development Districts throughout the nation. Goals and objectives are revised annually,
while the entire CEDS document must be updated to reflect regional growth and change every five years.

Northeast Council of Governments: 2019-2023 CEDS                                                Page 4
The CEDS continuous planning process involves public (government) and private for-profit and non-profit
sectors tasked with identifying short-term and long-term regional development issues/needs and
developing goals, objectives, and strategies to address economic development priorities.
The CEDS summarizes various development priorities; however its overall effectiveness as a planning tool
depends on individual local governments, organizations, and businesses. Other than the control NECOG
exercises of its own staff and operations, this CEDS is strictly advisory. NECOG continues to actively pursue
partnership oriented strategies as it works to fulfill its mission for the region, and NECOG will utilize and
promote the CEDS as a guide for regional community and economic development initiatives. The value
of the CEDS to the NECOG region is its ability:
To accurately describe the NECOG region in terms of political, geographic, economic, and social
relationships;
To promote a regional view of economic and community development;
To identify regional economic and community development issues and priorities;
To identify technical and financial resources available for community and economic development;
To be a relevant planning guide that evolves over time as needs change.
This CEDS is based upon a five-year planning period from 2019-2023. The success of the region and this
CEDS depends upon having strong leadership at both the regional and local levels. The region’s progress
can be measured both quantitatively, by reviewing relevant data trends, jobs created, investment, etc.,
or qualitatively, such as changes in attitudes, perceptions about the region, etc.
The CEDS is a valuable tool for identifying common challenges and opportunities. Projects can be
developed over the five-year planning period at the regional and local levels to address the identified
challenges and opportunities. It is hoped that the CEDS will become a mechanism through which more
collaboration among communities will occur to help overcome common challenges in a way that
reduces duplication of efforts and more efficiently addresses community concerns. As a tool for area
leaders, the CEDS offers both insights and information that will improve the odds of success.
CEDS Committee
NECOG’s Governing Body serves as the CEDS Committee. It has the membership characteristics to meet
EDA’s requirements including representation from the private and public sector. A membership roster is
submitted to EDA for its review on an annual basis. In addition to the committee, the CEDS relies upon
input from a variety of sources including individuals with expertise in the following areas:
Agriculture Governmental Affairs Public/Private
Economic Healthcare Infrastructure
Development Housing Tourism
Education Planning & Zoning
Finance Private Business
The CEDS Strategy Committee is a key component in the development of the CEDS, but it is only one of
several “players” involved in economic development. The CEDS draws upon a wide ranging expertise
and works to complement existing planning efforts occurring at the state, regional and local levels.
Various communities and economic development groups within the NECOG region have undertaken
Northeast Council of Governments: 2019-2023 CEDS Page 5
their own strategic planning efforts. Where applicable, this CEDS has drawn upon these efforts as an additional resource for identifying challenges, strengths, and potential projects. The CEDS committee will also work closely with local development groups and other regional organizations to broaden strategy participation and effectiveness. Process NECOG will incorporate several basic elements to complete a multi-faceted planning process. Each part has a relationship to the whole regional “picture.” This document includes: A summary background that includes a look at the region and its economy; A SWOT analysis of the region; A set of development goals and objectives; A strategic direction and action plan; An evaluation framework for identifying performance measures; Economic Resiliency; This CEDS also provides references to various resources available to assist in the implementation of the identified objectives and proposed projects. Upon completion, the CEDS will be available to various interested constituencies throughout the region. NECOG will work to inform interested parties on the availability of the CEDS and its use as a planning tool. NECOG will provide access to the CEDS through the NECOG website at www.necog.org, which will make it freely available on an on-going basis. Each year, as the region’s needs change, NECOG’s annual Scope of Work will also evolve in order to reflect these changes. Northeast Council of Governments: 2019-2023 CEDS Page 6
SUMMARY BACKGROUND – ECONOMIC CONDITIONS
        Information on the region’s economic development characteristics and conditions is presented in the
        following tables. The data sets summarize changes, trends, and circumstances that directly affect the
        region’s economic development potential. Whenever possible, regional data will be compared to state
        and national numbers. This information is not intended to fully document or prove any particular points
        of view. Rather, data sets will provide a sense of how the region’s economy functions.

        Population

        The NECOG region has experienced an estimated net increase of 3.1% in population between 2010 and
        2017. Four counties experienced population growth, and two of these counties saw increases due to
        each having a large community that serves as a regional hub. The counties with the largest population
        losses are typically heavily dependent upon agriculture and isolated from larger population centers.
        Table 1 shows the changes in population of the counties within NECOG. Between 2010 and 2017, 8 of
        the 12 NECOG counties and an estimated 80% of all of NECOG communities lost population.
                                               Table 1: Population History
                                                                                                                                                %     %
                                                                                                                                             Change   Change
                                                                                                                                              2010-   1930-
County           1930        1940        1950        1960        1970        1980        1990        2000         2010          2017          2017    2017

Beadle         22,917      19,648      21,082      21,682      20,877       19,195      18,253      17,023      17,398        18,157           4.4%   -20.8%

Brown          31,458      29,676      32,617      34,106      36,920       36,962      35,580      35,460      36,531        39,178           7.2%    24.5%

Campbell       5,629       5,033       4,046       3,531       2,866        2,243       1,965       1,782       1,466         1,379           -5.9%   -75.5%

Day            14,606      13,565      12,294      10,516      8,713        8,133       6,978       6,267       5,710         5,521           -3.3%   -62.2%

Edmunds        8,712       7,814       7,275       6,079       5,548        5,159       4,356       4,367       4,071         3,919           -3.7%   -55.0%

Faulk          6,895       5,168       4,752       4,397       3,893        3,327       2,744       2,640       2,364         2,329           -1.5%   -66.2%

Hand           9,485       7,166       7,149       6,712       5,883        4,948       4,272       3,741       3,431         3,277           -4.5%   -65.5%

McPherson      8,774       8,353       7,071       5,821       5,022        4,027       3,228       2,904       2,459         2,426           -1.3%   -72.4%

Marshall       9,540       8,880       7,835       6,663       5,965        5,404       4,844       4,576       4,656         4,804            3.2%   -49.6%

Potter         5,762       4,614       4,688       4,926       4,449        3,674       3,190       2,693       2,329         2,231           -4.2%   -61.3%

Spink          15,304      12,527      12,204      11,706      10,595       9,201       7,981       7,454       6,415         6,410           -0.1%   -58.1%

Walworth       8,791       7,274       7,648       8,097       7,842        7,011       6,087       5,974       5,438         5,543            1.9%   -36.9%

NECOG         147,873 129,718 128,661 124,236 118,573 109,284 99,478                              94,881        92,268        95,174           3.1%   -35.6%
South
Dakota        692,849 642,961 652,740 680,514 665,507 690,768 696,004 754,844                                   814,180       869,666          6.8%    25.5%
United
States        123,202,624 132,164,569 151,325,798 179,323,175 203,211,926 226,545,805 248,709,873 281,421,906   308,745,538   325,719,178      5.5%   164.4%
      Sources: US Census Bureau Decennial Census 1930-2010 and 2017 Population Estimates

        Northeast Council of Governments: 2019-2023 CEDS                                                                                    Page 7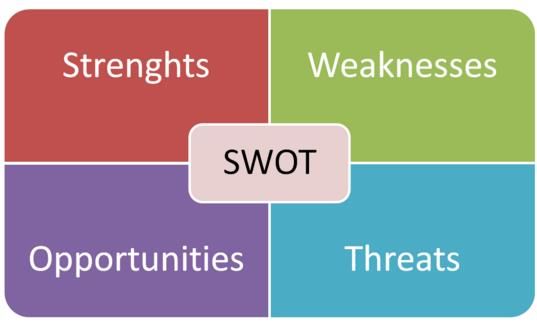
A significant issue for the NECOG rural areas is an increasingly aged population as youth out-migration
continues. In 2016, no County had a lower median age than the statewide or national median age
(Table 2). The percentage of the population over age 65 also is higher than the state and national
percentage (Table 3).

Table 2: Median Age (Years) by County                    Table 3: Population (%) over 65 by County

 County                2000        2010         2016      County                2000       2010        2016
 Beadle                40.1         41.2        38.3      Beadle               19.4%      17.3%      16.3%
 Brown                 37.2         38.6        37.7      Brown                16.2%      16.1%      15.9%
 Campbell              41.9         50.1        49.8      Campbell             22.1%      25.2%      24.3%
 Day                   42.9         47.9        48.5      Day                  23.5%      22.9%      24.9%
 Edmunds                41.6        45.7        44.5      Edmunds              22.2%      21.7%      20.1%
 Faulk                  41.5        46.9        50.0      Faulk                22.9%      23.7%      25.5%
 Hand                   43.6        48.2        48.2      Hand                 24.2%      25.3%      25.8%
 McPherson              47.6        50.8        52.3      McPherson            29.6%      29.8%      29.5%
 Marshall               41.6        43.2        41.8      Marshall             21.3%      19.1%      19.5%
 Potter                 45.8        50.6        53.5      Potter               25.0%      26.9%      28.2%
 Spink                  39.9        44.4        44.2      Spink                18.9%      20.1%      20.1%
 Walworth               42.8        47.2        44.6      Walworth             21.9%      24.0%      23.7%
 South Dakota           35.6        36.9        36.8      NECOG                19.6%      19.2%      18.9%
 United States          35.9        37.2        37.7      South Dakota         14.3%      14.7%      15.2%
Sources: US Census Bureau Decennial Census 2000-2010      United States        12.4%      13.0%      14.5%
and 2016 ACS                                             Sources: US Census Bureau Decennial Census 2000-2010
                                                         and 2016 ACS

The regional population appears to be stabilizing and possible increasing over the next ten years for the
first time since the 1930’s. The increase and stabilization of population is not seen evenly throughout the
region, but rather focused in two urban areas and a few other pocketed areas that will likely continue to
show growth. Significant population losses may still be experienced in communities with small
populations as was the case over the past ten years. It is expected that as the population of smaller
communities decline, there may be a shift into the larger communities of the county and region. These
shifts may be accelerated by the loss of a major employer or local school. Those communities under 200
in population are in the most danger of declining and they represent the largest percentage of
communities in the region as displayed in Figure 2.

                        Figure 2: Percent of NECOG Communities by Municipal Class

Northeast Council of Governments: 2019-2023 CEDS                                                     Page 8
Many of these communities once contained several competing businesses and are now fortunate to have
one viable establishment. Local schools have been consolidated and most of the school children in these
towns ride buses to the next town and many of the parents commute for work.

Another demonstration of the age demographics of the region can also be demonstrated with a
population pyramid of the NECOG region in Figure 3. A great deal of information can be determined about
the population breakdown by age and sex of an area by viewing a population pyramid. A rapidly growing
region would have a true pyramid shape. With far more young then old be represented on the pyramid.
In the NECOG region the population challenge is clear with the largest age groups falling between 45-59
years of age which would demonstrate negative population growth.

                                                   Figure 3: Population Pyramid
                                                     NECOG Region 2010

                                    85+
                                  80--84
                                  75--79
                                  70--74
                                  65--69
                                  60--64
                                  55--59
                    age cohorts

                                  50--54
                                  45--49   males                                  females
                                  40--44
                                  35--39
                                  30--34
                                  25--29
                                  20--24
                                  15--19
                                  10--14
                                    5--9
                                    0--4
                                           8   6      4     2     0       2   4      6      8
                                                                percent

Income

When looking at the percentage of people below the poverty rate, nine of the twelve counties in
NECOG’s region have poverty rates below the statewide average of 14.0%. Beadle, Day and Marshall
Counties have the highest percentages at are over 18% and three Counties are under 10%.

Northeast Council of Governments: 2019-2023 CEDS                                                Page 9
Table 4: Median Family, Per Capita Income and
Percent of Persons Below Poverty
Median % of People
Family Per Capita Below
County Income Income Poverty
Beadle $ 62,053 $ 24,532 21.4%
Brown $ 69,646 $ 29,463 11.0%
Campbell $ 61,071 $ 32,814 7.6%
Day $ 54,214 $ 28,811 18.5%
Edmunds $ 75,625 $ 30,123 9.8%
Faulk $ 73,973 $ 28,975 12.6%
Hand $ 73,155 $ 33,496 6.1%
McPherson $ 63,500 $ 25,302 18.8%
Marshall $ 67,668 $ 27,441 10.5%
Potter $ 59,674 $ 30,294 10.6%
Spink $ 63,393 $ 29,158 11.1%
Walworth $ 65,793 $ 29,199 10.8%
South Dakota $ 66,825 $ 27,516 14.0%
United States $ 67,871 $ 29,829 15.1%
Sources: US Census Bureau ACS 2012-2016
Median Family Income in the NECOG region ranges from $54,214 in Day County to $75,625 in Edmunds
County. Five counties have Median Family Incomes exceeding the State average and four counties exceed
the national average.
Table 5: Median Family Income (2016 Estimate)
Median Income Median Income
compared to Compared to
County Income State National
Beadle $ 62,053 92.9% 91.4%
Brown $ 69,646 104.2% 102.6%
Campbell $ 61,071 91.4% 90.0%
Day $ 54,214 81.1% 79.9%
Edmunds $ 75,625 113.2% 111.4%
Faulk $ 73,973 110.7% 109.0%
Hand $ 73,155 109.5% 107.8%
McPherson $ 63,500 95.0% 93.6%
Marshall $ 67,668 101.3% 99.7%
Potter $ 59,674 89.3% 87.9%
Spink $ 63,393 94.9% 93.4%
Walworth $ 65,793 98.5% 96.9%
NECOG $ 65,814 98.5% 97.0%
South Dakota $ 66,825 N/A 98.5%
United States $ 67,871 101.6% N/A
Sources: US Census Bureau ACS 2012-2016
Northeast Council of Governments: 2019-2023 CEDS Page 10The regions per capita personal income has decreased in 8 of 12 counties from 2015-2016. Per capita
personal income rates generally decreased at the highest rate in Counties with a lower population and
primarily reliant on the agriculture sector.
Table 6: Per Capita Personal Income
%
Change
2015-
County 2000 2005 2010 2015 2016 2016
Beadle $ 28,357 $ 33,285 $ 39,279 $ 48,488 $ 51,081 5.3%
Brown $ 28,608 $ 37,029 $ 41,832 $ 49,116 $ 48,978 -0.3%
Campbell $ 26,970 $ 28,569 $ 36,614 $ 44,676 $ 42,612 -4.6%
Day $ 22,961 $ 27,024 $ 37,212 $ 43,051 $ 43,296 0.6%
Edmunds $ 27,112 $ 35,280 $ 39,286 $ 44,289 $ 43,136 -2.6%
Faulk $ 27,257 $ 30,077 $ 41,090 $ 42,133 $ 41,008 -2.7%
Hand $ 30,073 $ 38,958 $ 38,888 $ 47,784 $ 46,997 -1.6%
McPherson $ 24,207 $ 33,216 $ 36,297 $ 38,314 $ 32,800 -14.4%
Marshall $ 23,470 $ 27,966 $ 41,639 $ 47,085 $ 43,286 -8.1%
Potter $ 34,608 $ 45,132 $ 88,664 $ 87,411 $ 76,181 -12.8%
Spink $ 30,834 $ 37,091 $ 47,558 $ 47,703 $ 48,318 1.3%
Walworth $ 24,959 $ 29,789 $ 38,673 $ 42,011 $ 42,522 1.2%
South Dakota $ 26,808 $ 33,772 $ 41,063 $ 47,665 $ 47,834 0.4%
Source: http://bea.gov/index.htm
Labor Force
Table 7 shows the labor force statistics for the twelve-county region over the past five years. The overall
unemployment rates have remained low in the NECOG region and the State in general. Day and
Walworth Counties were the only two counties to have unemployment rates over 4% during this time.
Presently 8 of the 12 Counties in the region have an unemployment rate higher than the statewide
average of 2.9%. Even though unemployment rates remain low, these percentages do not consider
“under-employment” factors which may include people having more than one job or someone working
below their skill level.
Labor force in the NECOG region has dropped from 51,230 in 2014 to 50,289 in 2018, a nearly 2% decrease
during this five-year period.
Table 7: Labor Force Statistics (June - 2014 to 2018)
Unemployment
County Year Labor Force Employed Unemployed Rate
2014 9,651 9,373 278 2.9%
2015 9,764 9,515 249 2.6%
Beadle 2016 9,701 9,462 239 2.5%
2017 9,631 9,373 258 2.7%
2018 9,735 9,498 237 2.4%
Brown 2014 21,166 20,589 577 2.7%
Northeast Council of Governments: 2019-2023 CEDS Page 112015 21,180 20,644 536 2.5%
2016 21,219 20,668 551 2.6%
2017 21,171 20,554 617 2.9%
2018 21,136 20,554 582 2.8%
2014 893 868 25 2.8%
2015 925 900 25 2.7%
Campbell
2016 922 899 23 2.5%
2017 877 850 27 3.1%
2018 866 837 29 3.3%
2014 2,979 2,851 128 4.3%
2015 3,028 2,894 134 4.4%
Day 2016 3,030 2,915 115 3.8%
2017 2,995 2,890 105 3.5%
2018 2,903 2,798 105 3.6%
2014 2,294 2,237 57 2.5%
2015 2,332 2,280 52 2.2%
Edmunds 2016 2,267 2,220 47 2.1%
2017 2,218 2,160 58 2.6%
2018 2,156 2,103 53 2.5%
2014 1,231 1,179 34 2.8%
2015 1,242 1,212 30 2.4%
Faulk 2016 1,234 1,206 28 2.3%
2017 1,203 1,169 34 2.8%
2018 1,154 1,116 38 3.3%
2014 1,901 1,854 47 2.5%
2015 1,981 1,936 45 2.3%
Hand 2016 1,971 1,929 42 2.1%
2017 1,920 1,872 48 2.5%
2018 1,901 1,858 43 2.3%
2014 1,190 1,149 41 3.4%
2015 1,223 1,188 35 2.9%
McPherson 2016 1,184 1,150 34 2.9%
2017 1,119 1,085 34 3.0%
2018 1,096 1,059 37 3.4%
2014 2,672 2,582 90 3.4%
2015 2,669 2,580 89 3.3%
Marshall 2016 2,652 2,569 83 3.1%
2017 2,551 2,454 97 3.8%
2018 2,471 2,387 84 3.4%
2014 1,280 1,246 34 2.7%
2015 1,316 1,279 37 2.8%
Potter 2016 1,287 1,257 30 2.3%
2017 1,237 1,206 31 2.5%
2018 1,205 1,168 37 3.1%
Northeast Council of Governments: 2019-2023 CEDS Page 122014 3,518 3,412 106 3.0%
2015 3,534 3,439 95 2.7%
Spink 2016 3,510 3,410 100 2.8%
2017 3,403 3,297 106 3.1%
2018 3,334 3,230 104 3.1%
2014 2,455 2,345 110 4.5%
2015 2,375 2,265 110 4.6%
Walworth 2016 2,339 2,227 112 4.8%
2017 2,359 2,248 111 4.7%
2018 2,332 2,224 108 4.6%
2014 51,230 49,685 1,527 3.0%
2015 51,569 50,132 1,437 2.8%
NECOG 2016 51,316 49,912 1,404 2.7%
2017 50,684 49,158 1,526 3.0%
2018 50,289 48,832 1,457 2.9%
2014 453872 439019 14853 3.3%
2015 457579 443492 14087 3.1%
South Dakota 2016 459762 446248 13514 2.9%
2017 462908 447972 14936 3.2%
2018 466374 452671 13703 2.9%
Source: http://dlr.sd.gov/lmic
Regional Economic Clusters
Regional Economic Clusters (RECs) are geographic concentrations of firms and industries that do business
with each other and have common needs for talent, technology, and infrastructure. RECs are a
geographically-bounded, active network of similar, synergistic or complementary organizations which
leverage their region’s unique competitive strengths to create jobs and broader prosperity. They create
a transition path from unemployment or underemployment to high-skill jobs. On average, jobs within
clusters pay higher wages. Regional industries based on inherent place-based advantages are less
susceptible to off-shoring, and create many new job opportunities for American workers. They connect
disenfranchised communities to new career and educational opportunities. They stabilize communities
by re-purposing idle manufacturing assets, engaging underutilized human capital, and contributing to
improvements in the quality of life.
Industry cluster analysis undertakes a sequence of steps to identify and locate the clusters present in a
region’s economy, as well as providing a way to gauge the clusters’ strengths and weaknesses compared
to the national economy. Such insights can assist in maintaining or increasing cluster strengths by strategic
resource targeting. Industry cluster analysis may also help identify new and emerging clusters to replace
old and fading ones.
NECOG staff utilized the analytical tools provided by the Economic Development Administration and the
universities of Indiana and Purdue via its Innovation in American Regions page on the STATS America
website. Research was conducted to gather data on industry and occupational clusters within the NECOG
Region.
Northeast Council of Governments: 2019-2023 CEDS Page 13Table 8 shows the industry clusters in the NECOG region. Location quotients measure the concentration
of employment in a particular cluster compared to the cluster’s employment at the national level.
A location quotient in an industry cluster greater than 1.00 shows a higher concentration of employment
within that cluster than in the same cluster at the national level. A LQ greater than 1.20 can be regarded
as an industry cluster which is meeting the demands and needs of the region and exporting goods and
services beyond the region. A LQ score between 0.75 and 1.20 shows that the industry cluster is probably
meeting the needs of the region in terms of employment. LQs less than 0.75 show a significantly lower
concentration of jobs in the industry cluster than the national level.
The cluster analysis confirms that NECOG is an agricultural region. The Agribusiness, Food Processing &
Technology cluster has an employment of over 4,300 and has grown nearly 36% since 2007. The
Agribusiness cluster LQ is 4.46. Other clusters of importance revealed by the numbers are in the area of
Biomedical/Biotechnical, Energy and Manufacturer Supercluster.
Table 8: Industry Clusters NECOG (2007-2012)
QCEW Cluster Change % Change Industry Cluster % Change % Change
Description Employment Cluster Cluster Employment LQ Cluster Cluster
2012 Emp. Emp. 2012 Emp. LQ Emp. LQ
Total All Industries 42,158 1,445 3.5% 1 0 0.0%
Advance Materials 1,841 521 39.5% 1.41 0.55 64.0%
Agribusiness, Food Processing &
Technology 4,309 1,141 36.0% 4.46 1.06 31.2%
Apparel & Textiles 22 (84) -79.2% 0.15 -0.2 -57.1%
Arts, Entertainment, Recreation &
Visitor Industries 1,824 (10) -0.5% 1.09 -0.06 -5.2%
Biomedical/Biotechnical (Life Sciences) 5,227 (500) -8.7% 1.13 -0.29 -20.4%
Business & Financial Services 1,909 86 4.7% 0.51 0 0.0%
Chemicals & Chemical Based Products 812 281 52.9% 1.37 0.62 82.7%
Defense & Security 1,287 288 28.8% 0.55 0.07 14.6%
Education & Knowledge Creation 818 115 16.4% 0.51 0.02 4.1%
Energy (Fossil & Renewable) 2,756 367 15.4% 1.45 0.11 8.2%
Forrest & Wood Products 230 35 17.9% 0.98 0.41 71.9%
Glass & Ceramics 41 (51) -55.4% 2.25 -1.67 -42.6%
Information Technology &
Telecommunications 927 139 17.6% 0.59 0.05 9.3%
Transportation & Logistics 783 (26) -3.2% 0.64 -0.02 -3.0%
Manufacturer Supercluster 2,281 (164) -6.7% 1.53 0.25 19.5%
Mining 109 41 60.3% 2.14 0.68 46.6%
Printing & Publishing 443 (222) -33.4% 0.67 -0.23 -25.6%
Source: www.statsamerica.org
Northeast Council of Governments: 2019-2023 CEDS Page 14Business and Economic Development
Table 9 shows the taxable sales by county between 2015 and 2017, which provides a good measure of the
size of the economic output of each of the counties in the region. Brown County has by far the largest
taxable sales at nearly three times that of the next county and 51% of the total taxable sales in the NECOG
region. Nine of the twelve counties have shown a decrease in taxable sales over the past three years,
while the State of South Dakota remained relatively flat. The NECOG region represents 8% of the State’s
total taxable sales.
Table 9: Taxable Sales by County (2015 - 2017)
Percentage
Change
County 2015 2016 2017 2015-2017
Beadle $ 319,406,478 $ 314,981,181 $ 304,574,047 -4.6%
Brown $ 890,353,345 $ 864,466,633 $ 846,674,580 -4.9%
Campbell $ 18,327,410 $ 17,992,914 $ 16,404,815 -10.5%
Day $ 81,133,075 $ 77,846,648 $ 86,673,233 6.8%
Edmunds $ 53,135,564 $ 52,903,593 $ 54,877,589 3.3%
Faulk $ 24,221,438 $ 22,604,195 $ 23,022,137 -5.0%
Hand $ 44,100,940 $ 40,599,385 $ 38,808,922 -12.0%
McPherson $ 24,556,557 $ 23,296,083 $ 22,777,515 -7.2%
Marshall $ 65,258,578 $ 51,391,539 $ 49,033,952 -24.9%
Potter $ 36,112,602 $ 34,247,730 $ 32,609,091 -9.7%
Spink $ 72,282,457 $ 72,244,397 $ 73,074,885 1.1%
Walworth $ 114,598,672 $ 105,505,487 $ 102,449,169 -10.6%
NECOG $ 1,743,487,116 $ 1,678,079,785 $ 1,650,979,935 -5.3%
South
Dakota $ 21,019,713,154 $ 20,901,003,014 $ 21,120,502,661 0.5%
Source: http://www.state.sd.us/drr2/businesstax/statistics/statistics.htm
The Pull Factor measures the relative strength of a community’s retail sector and is computed by:
Pull Factor = City retail sales per capita
State retail sales per capita
A Pull Factor higher than 1 suggests that the community is generating per capita sales with a drawing
power greater than leakages. A Pull Factor less than 1 suggests that the community’s drawing power is
less than the leakages.
There were twenty-one communities in the NECOG region with a Pull Factor higher than 1 and forty-
three communities with a Pull Factor below 1. Table 10 shows the Pull Factor for all communities within
the NECOG region for which data was available. Each county is also listed with their individual Pull
Factor.
Northeast Council of Governments: 2019-2023 CEDS Page 15Table 10: Retail Pull Factors (2017)
Per Capita
Population Retail Sales Pull
City County 2010 Retail Sales 2017 2017 Factor
Cavour Beadle 114 $ 701,015 $ 6,149.25 0.46
Hitchcock Beadle 91 $ 405,201 $ 4,452.76 0.33
Huron Beadle 12592 $ 182,724,939 $ 14,511.19 1.08
Wessington Beadle 170 $ 1,975,479 $ 11,620.46 0.86
Wolsey Beadle 376 $ 2,695,254 $ 7,168.23 0.53
Yale Beadle 108 $ 641,525 $ 5,940.04 0.44
Beadle 17398 $ 189,717,894 $ 10,904.58 0.81
Aberdeen Brown 26091 $ 519,382,393 $ 19,906.57 1.48
Claremont Brown 127 $ 395,422 $ 3,113.56 0.23
Columbia Brown 136 $ 413,953 $ 3,043.78 0.23
Frederick Brown 199 $ 914,081 $ 4,593.37 0.34
Groton Brown 1458 $ 11,921,212 $ 8,176.41 0.61
Hecla Brown 227 $ 2,866,685 $ 12,628.57 0.94
Stratford Brown 72 $ 381,009 $ 5,291.79 0.39
Warner Brown 457 $ 500,605 $ 1,095.42 0.08
Westport Brown 133 $ 681,320 $ 5,122.71 0.38
Brown 36531 $ 546,246,905 $ 14,952.97 1.11
Herreid Campbell 438 $ 4,968,039 $ 11,342.56 0.84
Mound City Campbell 71 $ 315,922 $ 4,449.60 0.33
Pollock Campbell 241 $ 1,624,507 $ 6,740.69 0.50
Campbell 1466 $ 6,932,295 $ 4,728.71 0.35
Andover Day 91 $ 91,305 $ 1,003.35 0.07
Bristol Day 341 $ 1,702,536 $ 4,992.77 0.37
Grenville Day 54 $ 1,003,373 $ 18,580.97 1.38
Pierpont Day 135 $ 476,941 $ 3,532.90 0.26
Roslyn Day 183 $ 819,761 $ 4,479.57 0.33
Waubay Day 576 $ 2,704,967 $ 4,696.12 0.35
Webster Day 1886 $ 41,493,669 $ 22,000.89 1.64
Day 5710 $ 48,297,533 $ 8,458.41 0.63
Bowdle Edmunds 502 $ 5,655,130 $ 11,265.20 0.84
Hosmer Edmunds 208 $ 814,815 $ 3,917.38 0.29
Ipswich Edmunds 954 $ 11,041,678 $ 11,574.09 0.86
Roscoe Edmunds 329 $ 5,190,656 $ 15,777.07 1.17
Edmunds 4071 $ 22,831,814 $ 5,608.40 0.42
Cresbard Faulk 104 $ 162,286 $ 1,560.44 0.12
Faulkton Faulk 736 $ 8,674,320 $ 11,785.76 0.88
Onaka Faulk 15 $ 39,244 $ 2,616.24 0.19
Orient Faulk 63 $ 1,207,605 $ 19,168.33 1.42
Seneca Faulk 38 $ 869,337 $ 22,877.28 1.70
Faulk 2364 $ 11,807,739 $ 4,994.81 0.37
Northeast Council of Governments: 2019-2023 CEDS Page 16Miller Hand 1489 $ 19,193,811 $ 12,890.40 0.96
Ree Heights Hand 62 $ 87,533 $ 1,411.83 0.10
St. Lawrence Hand 198 $ 505,596 $ 2,553.51 0.19
Hand 3431 $ 19,988,679 $ 5,825.90 0.43
Britton Marshall 1241 $ 17,444,857 $ 14,057.10 1.04
Eden Marshall 89 $ 924,994 $ 10,393.20 0.77
Lake City Marshall 51 $ 1,049,462 $ 20,577.68 1.53
Langford Marshall 313 $ 2,840,024 $ 9,073.56 0.67
Veblen Marshall 531 $ 1,306,225 $ 2,459.93 0.18
Marshall 4656 $ 24,233,007 $ 5,204.68 0.39
Eureka McPherson 868 $ 10,110,770 $ 11,648.35 0.87
Leola McPherson 457 $ 3,405,089 $ 7,450.96 0.55
Long Lake McPherson 31 $ 107,995 $ 3,483.69 0.26
McPherson 2459 $ 13,682,684 $ 5,564.33 0.41
Gettysburg Potter 1162 $ 13,168,595 $ 11,332.70 0.84
Hoven Potter 406 $ 3,675,818 $ 9,053.74 0.67
Lebanon Potter 47 $ 102,291 $ 2,176.41 0.16
Tolstoy Potter 36 $ 69,143 $ 1,920.63 0.14
Potter 2329 $ 17,016,288 $ 7,306.26 0.54
Ashton Spink 122 $ 224,731 $ 1,842.06 0.14
Conde Spink 140 $ 311,922 $ 2,228.02 0.17
Doland Spink 180 $ 1,361,080 $ 7,561.56 0.56
Frankfort Spink 149 $ 1,675,504 $ 11,244.99 0.84
Mellette Spink 210 $ 2,001,366 $ 9,530.31 0.71
Northville Spink 143 $ 223,882 $ 1,565.61 0.12
Redfield Spink 2333 $ 34,389,187 $ 14,740.33 1.10
Tulare Spink 207 $ 2,309,796 $ 11,158.44 0.83
Turton Spink 48 $ 241,190 $ 5,024.80 0.37
Spink 6415 $ 44,252,137 $ 6,898.23 0.51
Akaska Walworth 42 $ 481,825 $ 11,472.03 0.85
Glenham Walworth 105 $ 365,733 $ 3,483.17 0.26
Java Walworth 129 $ 192,516 $ 1,492.37 0.11
Mobridge Walworth 3465 $ 55,242,531 $ 15,943.01 1.18
Selby Walworth 642 $ 4,219,026 $ 6,571.69 0.49
Walworth 5438 $ 60,920,401 $ 11,202.72 0.83
NECOG 92268 $ 1,005,927,376 $ 10,902.23 0.81
South Dakota 814180 $ 10,955,243,583 $ 13,455.55 1.00
Source: http://www.state.sd.us/drr2/businesstax/statistics/statistics.htm
Northeast Council of Governments: 2019-2023 CEDS Page 17Housing
The importance of housing to a region’s development potential is often understated, but cannot be
overlooked. Housing conditions influence both the quality of life and economic vitality. The following
data provides a limited snapshot of housing factors.
Table 11 shows the distribution of housing units in NECOG’s region as of the 2016 American Community
Survey. The vast majority of housing units within the region are single family homes. Beadle and Brown
County have a large number of multiple family homes at 21% and 27% and this is typical for larger areas
with larger populations. Mobile home or trailer units in Potter County make up 27% of the total housing
units and are nearly twice that of any other county. Potter County has several housing areas along the
Missouri river where the predominant housing unit is a mobile home or trailer. These areas are
primarily seasonal and take advantage of the recreational opportunities that the river provides.
Remaining counties have high percentages of single family homes and in many cases lack the option of
multiple family units.
Table 11: Housing Units (2016)
Percentage Percentage Percentage
Total of Total of Total Mobile of Total
Housing Single Housing Multiple Housing Home or Housing
County Units Family Units Family Units Other Units
Beadle 8,376 6,298 75% 1,733 21% 345 4%
Brown 17,471 11,492 66% 4,723 27% 1,256 7%
Campbell 994 798 80% 46 5% 150 15%
Day 3,672 3,067 84% 355 10% 250 7%
Edmunds 1,954 1,670 85% 155 8% 129 7%
Faulk 1,199 957 80% 126 11% 116 10%
Hand 1,817 1,499 82% 183 10% 135 7%
McPherson 1,405 1,209 86% 110 8% 86 6%
Marshall 2,564 2,080 81% 228 9% 256 10%
Potter 1,553 1,020 66% 106 7% 427 27%
Spink 3,172 2,540 80% 397 13% 235 7%
Walworth 3,003 2,191 73% 385 13% 427 14%
NECOG 47,180 34,821 74% 8,547 18% 3,812 8%
South Dakota 375,866 259,240 69% 83,405 22% 33,221 9%
United States 134,054,899 82,631,864 62% 42,859,657 32% 8,563,378 6%
Source: http://factfinder2.census.gov ACS 2012-2016
Aging housing infrastructure is a major challenge, particularly in rural areas of NECOG. Table 12 shows
the age of the existing housing stock for each county within the NECOG region based on 2016 American
Community Survey data. Regarding housing stock that dates back to 1969 or earlier, 41% of South
Dakota’s housing stock was built before 1969. All of the NECOG counties combined have 56% of housing
stock built before 1969. Brown County and Edmunds County are the lowest at 51% and 52%. Beadle,
Campbell, Faulk and McPherson all exceed 60%. In Campbell, McPherson, Potter and Walworth
Counties, each county has had 10% or less of their housing stock built between 2000 and 2016. The
State average is 19% and no county in the NECOG region meets the State’s average.
Northeast Council of Governments: 2019-2023 CEDS Page 18Beadle Brown Campbell Day Edmunds Faulk Hand
Total Housing Units 8,376 17,471 994 3,672 1,954 1,199 1,817
Built 2014 or later 9 81 - 15 - 5 -
% of Total Housing Units 0% 0% 0% 0% 0% 0% 0%
Built 2010-2013 87 755 19 50 42 18 60
% of Total Housing Units 1% 4% 2% 1% 2% 2% 3%
Built 2000-2009 727 1,905 62 438 204 135 167
% of Total Housing Units 9% 11% 6% 12% 10% 11% 9%
Built 1990-1999 729 1,822 69 192 211 137 100
% of Total Housing Units 9% 10% 7% 5% 11% 11% 6%
Built 1980-1989 525 1,219 97 310 181 61 101
% of Total Housing Units 6% 7% 10% 8% 9% 5% 6%
Built 1970-1979 1,311 2,947 143 545 290 69 314
% of Total Housing Units 16% 17% 14% 15% 15% 6% 17%
Built 1960-1969 1,076 2,251 76 316 203 118 196
% of Total Housing Units 13% 13% 8% 9% 10% 10% 11%
Built 1950-1959 1,022 1,517 116 324 177 167 185
% of Total Housing Units 12% 9% 12% 9% 9% 14% 10%
Built 1940-1949 662 1,017 86 284 165 38 132
% of Total Housing Units 8% 6% 9% 8% 8% 3% 7%
Built 1939 or earlier 2,228 3,957 326 1,198 481 451 562
% of Total Housing Units 27% 23% 33% 33% 25% 38% 31%
McPherson Marshall Potter Spink Walworth NECOG South Dakota
Total Housing Units 1,405 2,564 1,553 3,172 3,003 47,180 375,866
Built 2014 or later 5 5 5 24 24 173 2,211
% of Total Housing Units 0% 0% 0% 1% 1% 0% 1%
Built 2010-2013 11 37 43 65 13 1,200 11,598
% of Total Housing Units 1% 1% 3% 2% 0% 3% 3%
Built 2000-2009 70 258 93 300 187 4,546 58,184
% of Total Housing Units 5% 10% 6% 9% 6% 10% 15%
Built 1990-1999 58 116 161 228 249 4,072 48,480
% of Total Housing Units 4% 5% 10% 7% 8% 9% 13%
Built 1980-1989 70 258 103 198 181 3,304 38,021
% of Total Housing Units 5% 10% 7% 6% 6% 7% 10%
Built 1970-1979 219 371 322 476 579 7,586 63,161
% of Total Housing Units 16% 14% 21% 15% 19% 16% 17%
Built 1960-1969 132 336 153 200 386 5,443 32,512
% of Total Housing Units 9% 13% 10% 6% 13% 12% 9%
Built 1950-1959 155 304 182 312 383 4,844 34,065
% of Total Housing Units 11% 12% 12% 10% 13% 10% 9%
Built 1940-1949 118 190 78 118 237 3,125 18,739
% of Total Housing Units 8% 7% 5% 4% 8% 7% 5%
Built 1939 or earlier 567 689 413 1,251 764 12,887 68,895
% of Total Housing Units 40% 27% 27% 39% 25% 27% 18%
Northeast Council of Governments: 2019-2023 CEDS Page 19Table 13 shows the distribution of the existing housing stock based on home values. Approximately 32%
of the State’s housing stock had a value of $100,000 or less. In comparison nine of the twelve NECOG
counties have between 52% and 73% of the value of their housing stock below $100,000. Brown County
(29%) is the only county below the State average. This is due in large part to the age of the housing
stock as noted in the previous table.
Table 13: Housing Values (2016)
Total Owner $50,000 $100,000 $150,000 $200,000 $300,000
Occupied Less to to to to to $500,000
County Units $50,000 $99,999 $149,999 $199,999 $299,999 $499,000 or more
Beadle 4909 16.3% 30.1% 20.8% 13.9% 12.6% 5.2% 1.1%
Brown 10,844 11.5% 17.4% 21.5% 19.4% 16.0% 11.8% 2.4%
Campbell 556 37.1% 30.9% 14.4% 6.3% 6.1% 4.0% 1.3%
Day 1,863 28.8% 32.8% 10.9% 8.4% 11.0% 3.4% 4.8%
Edmunds 1,327 26.8% 20.9% 8.7% 15.7% 16.3% 8.9% 2.7%
Faulk 747 29.7% 27.2% 20.3% 6.3% 5.2% 9.1% 2.1%
Hand 1,040 22.5% 29.3% 14.2% 14.5% 9.1% 7.3% 3.0%
McPherson 757 42.8% 30.0% 11.0% 6.9% 4.6% 2.9% 1.8%
Marshall 1,229 23.9% 29.9% 13.3% 12.0% 12.1% 5.9% 2.8%
Potter 834 29.7% 33.1% 11.5% 10.1% 7.8% 5.8% 2.0%
Spink 1,919 30.7% 32.6% 11.9% 8.0% 9.5% 4.0% 3.3%
Walworth 1,599 24.6% 36.9% 16.6% 6.5% 7.3% 6.8% 1.4%
NECOG 27,624 19.7% 25.4% 17.7% 14.2% 12.6% 8.0% 2.3%
South Dakota 226,145 14.6% 17.0% 19.6% 18.4% 17.3% 9.7% 3.4%
United States 74,881,068 8.8% 14.8% 15.3% 14.9% 18.4% 16.4% 11.4%
Source: http://factfinder2.census.gov ACS 2012-2016
Northeast Council of Governments: 2019-2023 CEDS Page 20SWOT ANALYSIS
A SWOT analysis assesses the region for trends, characteristics and situations that might contribute to
the region’s economic growth or lead to its economic decline. Strengths and opportunities are items
that bolster the economic viability of the NECOG region, with strengths being internal positive forces
and opportunities being external elements that can lead to future economic benefit. Weaknesses and
threats are actual and perceived items that harm the region’s economy. Weaknesses are internal issues
that are damaging to the economy while threats are external
influences that could negatively impact the region’s ability to
grow.
Central to the outcome of the NECOG CEDS is identifying the
strengths, weaknesses, opportunities and threats (SWOT) of
the region and determining ways to capitalize on the regions’
strengths and opportunities while overcoming its weaknesses
and threats. The following SWOT analysis was compiled by
using a variety of inputs, including a brainstorming session of the CEDS Committee, one-on-one
discussions with the NECOG membership, the 2017 Community and Regional Economic Development
Survey instrument, and a review of relevant documents including the NECOG 2014-2018 CEDS.
Regional Survey
NECOG conducted a region-wide survey to identify local and area priorities. The survey instrument was
provided to all member organizations, economic development officials, and various community groups
and businesses throughout the region. Entities that received the survey could have an individual
complete the survey or they could complete the survey as a group. A link to the survey was also located
on the NECOG webpage and was advertised through the NECOG newsletter. The survey was conducted
in the spring of 2018, with a meeting presenting the results held June 27, 2018. During this meeting
discussion of Goals, SWOT analysis and comments were also received. Although it was not conducted to
scientific standards, the survey provides a good gauge of some of the primary issues and concerns facing
individuals, businesses and communities throughout the region. The survey focused on local and
regional economic issues and asked respondents to grade various issues that communities commonly
face and assess which of these issues require more attention or needed the most improvement.
Respondents were asked to assess the assets and challenges of the region related to attracting and
encouraging economic development.
Most Important Local/Regional Economic Development Resources/Strength
Quality of Life
Recreational Attractions
Agriculture Industry
Available Infrastructure
Good Schools
Lower Cost of Living
Northeast Council of Governments: 2019-2023 CEDS Page 21The most important resource/strength identified was that this area is a good place to live “quality of life”.
Respondents noted directly “quality of life” or items related to it such as friendly community, safe, and
outdoor opportunities. In addition, other major strengths identified were good local schools, a strong
agriculture economy, and good infrastructure.
Major Challenges/Liabilities to Attracting and Encouraging Economic Development
Available housing
Population base (aging and inability to attract young workers)
Available workforce
Lack of funding for infrastructure
Available retail opportunities
Distance and isolation from markets (rural setting)
The biggest challenge/liability that was identified around the issue of housing. Comments on housing
dealt with affordable housing, lack of housing, lack of rental properties, age of properties, and lack of
available developable lots housing. Another significant issue identified was the population of the region,
which received comments for the aging population, decline in population and the difficulty in attracting
young workers back to the region.
To help address their economic and community concerns the regional survey asked respondents to
identify the top priorities to improving the local and regional economy
Top Priorities/Opportunities to Improve Local and Regional Economy
Strong state business climate
Attracting new companies and/or skilled workers
Improving access and availability to housing opportunities
Energy Development
Promote quality of life/low cost of living
Maintain/enhance existing public infrastructure and facilities
The “priorities/opportunities” to success identified by respondents tend to reflect the top issues
previously identified. Improving housing opportunities and dealing with workforce were common
responses as well as promoting the region on quality of life issues and the states friendly business climate.
CEDS Committee
The CEDS Committee met and discussed the findings of the regional survey. The input and discussions of
the committee were very similar to the survey answers received. Through group discussion the
committee was involved in developing the SWOT analysis by expanding on the comments received
through the survey.
Northeast Council of Governments: 2019-2023 CEDS Page 22Helpful Harmful
STRENGTHS WEAKNESSES
Quality of Life Population Base
o Small Town Friendliness/Low Crime o Declining Overall Regional Population
o Recreational Attractions o Inability to attract and retain young workers
Work Ethic/Productive Workforce o Aging population
Agriculture Industry, jobs, resources Available affordable housing
Lower Cost of Living o Lack of Rural Rental Options
Educational Facilities (Local, Post-Secondary) o Age of Housing Stock
Available Infrastructure Available retail opportunities
Internal
Proximity and access to good transportation
Distance and Isolation from markets (rural setting)
network
Available Land to Develop Parochialism (Geographic/Generational)
Low unemployment rate No Post-Secondary Technical School in the Region
Local governments and regional organizations Aging Infrastructure
Available Broadband Lack of Funding for Infrastructure
Available Healthcare Access to Interstate/4 Lane Highways
Lack of employment opportunities that pay a competitive
wage
Availability of affordable, child care & early education
services
OPPORTUNITIES THREATS
Challenge to attract and retain young professionals and
Strong State Business Climate
families
Promote Mid-Level Job Training & Vocational
Lack of business succession planning
Training
Promotion of low cost of living/quality of life Lack of understanding of manufacturing career opportunities
Expand on Technical Education Lack of Available Workforce
Attracting new companies and/or skilled workers Government Budgets/Political Environment
Downtown Revitalization Increased competition from outside of the region
External
Energy Development/Expansion Low Agriculture Commodity Prices
o Ethanol, Wind, Solar, Natural Gas Increased cost of maintaining essential infrastructure
Expand Public Transportation Worker retention
Retain/grow existing industry & attract new industry Lack of development opportunities due to aging rural water
to diversify economy systems
Maintain/enhance existing public infrastructure and Difficulty in attracting new participants in local government
facilities leadership roles
Improve access & availability to affordable housing
Value Added Agriculture
o CAFO's
Northeast Council of Governments: 2019-2023 CEDS Page 23STRATEGIC DIRECTION AND ACTION PLAN
Strategy Context
A strategic review of the findings of the SWOT analysis was undertaken to identify the major factors that
impact economic and community development in the region, and how strategies may be implemented to
leverage these advantages and mitigate the disadvantages.
The CEDS Action Plan will outline the goals, objectives, and strategies that represent the tangible
outcomes of the CEDS. The CEDS Action Plan focuses on those goals, objectives, and strategies that are
based upon the best analysis of current regional conditions and derived from information gathered
through the SWOT analysis, a regional survey, community assessments, communication with member
municipalities, counties and related third parties, and feedback from the CEDS Committee.
The goals, objectives, and strategies were developed through a series of processes. Initially NECOG staff
reviewed the existing goals identified in the previous CEDS document. The previous goals were discussed
by considering present information and the results of the regional survey that was conducted. Through
this process staff refined the goals into three sections Community Development, Economic Development
and Technical Assistance.
With the preliminary development of goals and objectives the staff presented the information to the CEDS
committee for further input and approval. After review of the goals and objectives by the CEDS committee
the final goals and objectives were completed.
The following goals, objectives and strategies have been identified by the CEDS Committee to promote
and support NECOG’s involvement in expanding economic opportunity throughout the region. The goals
and objectives were not prioritized and each are viewed as important to the regions development. The
goals, objectives and strategies are set within a five-year timeframe, although annual performance
assessments and adjustments may be made.
Community Development Goal: To Improve, Develop, and Expand Community and County
infrastructure, programs and facilities
Community Development Objective 1: Provide assistance to communities, counties and other
entities for the development and maintenance of public facilities and infrastructure systems.
Community Development Objective 2: Provide assistance to local governments in developing
strategic community/economic development plans, ordinances, and regulations.
Community Development Objective 3: Provide assistance to communities, counties and other
entities to improve access and availability of affordable housing within the region.
Economic Development Goal: To Improve Public and Private Economic opportunities
throughout the region.
Economic Development Objective 1: Provide assistance to retain and expand existing businesses
and industries.
Economic Development Objective 2: Expand opportunities for Alternative Energy production
and Value-Added agriculture.
Northeast Council of Governments: 2019-2023 CEDS Page 24You can also read