SOCIO ECONOMIC IMPACT ASSESSMENT FOR THE OLIFANTSFONTEIN LANDFILL SITE, EKURHULENI METROPOLITAN MUNICIPALITY, GAUTENG APRIL 2021 - AND - Submitted to
←
→
Page content transcription
If your browser does not render page correctly, please read the page content below
SOCIO ECONOMIC IMPACT ASSESSMENT FOR
      THE OLIFANTSFONTEIN LANDFILL SITE,
EKURHULENI METROPOLITAN MUNICIPALITY, GAUTENG

                  APRIL 2021

                 Submitted to:

                 Submitted by:

                     AND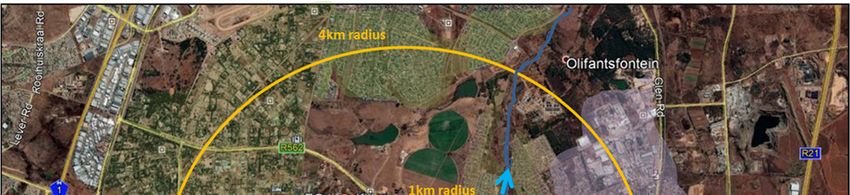
EXECUTIVE SUMMARY
Summer Symphony Properties 264 CC. is the landowner of Portions 41 and 179 of the farm
Olifantsfontein 410 JR, in the Olifantsfontein area. The landowner has an existing Waste
Management Licence for a category G:L:B- landfill facility, referred to as the Olifantsfontein Landfill.
The site is situated in Ward 1 of the City of Ekurhuleni Metropolitan Municipality and located to the
east of Midrand and east of the Glen Austin Agricultural Holdings, west of the K111 (Republic Road)
and approximately 1.5 km south of the R562 (Olifantsfontein Road). Tembisa is located to the
east and south-east of the site. The Clayville/Olifantsfontein industrial area is to the north east and
the Randjiesfontein Agricultural Holdings to the north west.
The Olifantsfontein Landfill site can be viewed as a Brownfields site disturbed by sand quarrying
and is approximately 45 ha in extent. The site is zoned as “agricultural”. Access to the site would
be from the K111.
The site is authorized to receive inert waste, garden waste and building rubble. Construction of the
site has commenced. The License Holder intends to apply for an amendment of the Olifantsfontein
Waste Management Licence to allow the acceptance of general wastes comprising general-
domestic, commercial, garden, builder’s rubble and general dry industrial waste for disposal. The
landfill site would require a class B lining system for the disposal of general waste as prescribed by
Regulation 636 promulgated under the National Environmental Management: Waste Act (Act 59 of
2008).
On average it is expected that the landfill could receive around 15 000 tons of waste per month or
500 tons/day. The project, however, will have a design capacity in excess of 1000 tons/day. The
landfill has around 3.5 million cubes of airspace which indicates to a lifespan of between 15 to 30
years.
The site development plan consists of the following:
Infrastructure and facilities
Access road, perimeter service road and on-site roads
Perimeter fencing and entrance gate and control
Storm water drainage measures
Office, ablutions and stores building
Weighbridges
Recycling yard and building
Composting yard
Landfill cells, and
Contaminated storm water run-off/leachate evaporation dam.
A Materials Recovery Facility (MRF) will form part of the facility. The main access roads on site
would be paved. Dust suppression on the gravel roads would be by means of wetting. The landfill
area will be subdivided into seven (7) cells and the development of each of these cells will be
phased.
Ekurhuleni Ward 102 lies east of the landfill, City of Johannesburg (CoJ) Ward 92 is situated west
of the landfill and CoJ Wards 77 and 133 is situated south of the landfill. Generally, socio-economic
i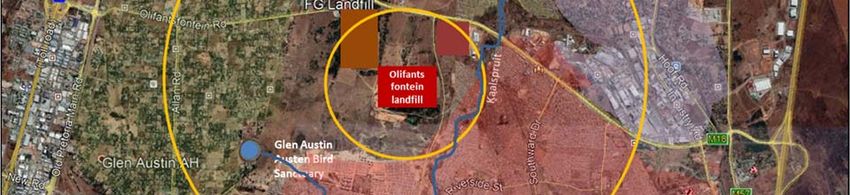
impacts of landfills occur within a 1km to 4km radius from landfill sites. Within the 4km radius the
following receptors should be noted:
High density residential areas to the south (towards Tembisa)
Low density plots of Glen Austin and Randjiesfontein to the west
Parts of Olifantsfontein industrial area and Tembisa’s Clayville are located within the 4km
boundary east from the landfill
A retail complex (Cashbuild) still under construction at the time of this study, lying within the
1km boundary of the site (north east) in Tswelopele (Tembisa)
Parts of Kaalspruit (flowing in a northerly direction towards Centurion in CoT) within 1km from
the site
Olifantsfontein road (R562) passing some 1km north of the proposed site
Glen Austin Bird Sanctuary to the south west of the landfill within the 4km radius.
During the construction phase, the landfill created around 38 direct job opportunities and 25 flow-
on jobs for two and a half years, as the construction of the cells occur in a phased manner. This is
the full time equivalent (FTE) of 95 direct jobs and 63 flow-on jobs for one year. During the
operational phase it is anticipated that the landfill will create in the region of 7 direct jobs during the
operational lifetime of the facility. About 5 of these positions could be filled by unskilled workers; 1
semi-skilled site operator and 1 skilled supervisor. The landfill site will thus have direct positive
impacts on income and employment created and will result in further indirect positive economic
impacts to local suppliers and as a result of the overall increase in income levels and increased
spending.
One can expect the operations to lead to some inflow of jobseekers (which have likely already been
caused by the construction of the recently completed Mall of Tembisa) and more so to some
informal reclaimers (waste pickers) to the site, as the landfill site can be easily accessed from the
K111 and the Olifantsfontein road (R562). Negative impacts in this regard can be mitigated.
Dust created during the construction phase, mainly by vehicles travelling on gravel roads, as well
as the actual operations such as wind erosion from exposed surfaces, the compacting of waste and
handling of material can have impacts on the air quality with subsequent negative impacts on
human health. The Air Quality Impact Assessment (AQIA) however found that the predicted
impacts would be low over the areas surrounding the proposed landfill site and fall well within the
residential and non-residential area standards (for dust-fall), and the daily and annual SNAAQS.
Hazardous air pollutants (HAP) are associated with malodour impacts. In the case of the
Olifantsfontein landfill, the AQIA stated that residents located in near proximity south, south-east
and east of the proposed landfill could potentially experience odour impacts, but that the possible
impacts can be mitigated through the implementation of proper waste control management systems
and the implementation of different leachate treatment options.
The potential increase in crime rates and other security issues in the local area mainly relate to the
movement of vehicles, the influx of an outside workforce and potential jobseekers, as well as the
presence of reclaimers on site. Proper landfill management can address and mitigate these
possible impacts.
ii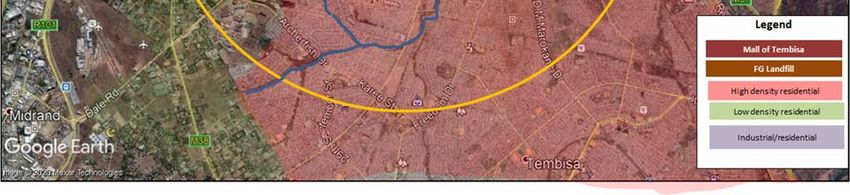
Ground and surface water pollution is a concern usually associated with landfill sites. With regards
to the Olifantsfontein landfill, this risk is anticipated to be low due to the low percentage of
downstream borehole users and the lower population densities downstream from the landfill. The
underlying groundwater aquifer is located more than 20m beneath the landfill floor level and is
considered to be a Minor Aquifer. Proper design of a storm water and groundwater control system
will limit the risks in this regard.
Various ‘nuisance’ factors (noise, dust, litter and odour) could also imply costs for households or
activities located close to the landfill. The negative disamenity impact and the economic costs
usually translate in lower property prices adjacent to the landfill. Only a fraction of a high density,
low-income residential area to the south east is within 1km from the Olifantsfontein landfill. The
impact on Glen Austin’s low density higher value properties is also not expected to be of concern.
The disamenity impact could also be significantly reduced with proper management of the site.
Possible noise impacts relate to construction and operational activities such as the operation of
vehicles and machinery which are anticipated on the dwellings located to the south east of the site
that fall within the 1km zone.
The area is disturbed from its original characteristics due to considerable soil erosion which is a
result of historical excavations, quarrying and illegal sand mining. The disturbed character of the
site and the presence of alien invasive species impact on the local sense of place. The height of
landfill will be the original ground level, due to the significant excavations from the sand mining
activities that have been taking place on the site. Further mitigation of the visual impacts and thus
the sense of place would only come into effect once the landfill has been rehabilitated to an end-
use which is also visually pleasing. Once a suitable end-use is in place, the impact on the sense
of place would thus be low.
A Materials Recovery Facility (MRF) will further reduce the amount of waste, open up much needed
waste air space in Ekurhuleni and environs and extend the lifetime of the project.
The anticipated socio-economic impacts associated with the landfill are of a medium rating.
Through good site management (largely required by law) the landfill’s negative socio-economic
impacts could be managed to low/medium impacts. The environmental authorisation of the
Olifantsfontein landfill is recommended based on the:
Relatively low risks of the landfill;
Potential for a proper management plan to decrease social risks, as well as
Dire need for landfill space for Gauteng’s metros.
iii
TABLE OF CONTENTS
1.     INTRODUCTION ................................................................................................................... 3
     1.1      Project Background ....................................................................................................... 3
     1.2      Technical details ........................................................................................................... 3
     1.3      Locality .......................................................................................................................... 4
     1.4      The Legal Framework for Socio Economic Impact Assessments ................................. 5
     1.5      Checklist: Requirements for Specialist Reports, as Contained in the 2014 EIA
              Regulations................................................................................................................... 6
     1.6      Scope of Work .............................................................................................................. 7
     1.7      Purpose of the Report ................................................................................................... 7
     1.8      Site Visit ........................................................................................................................ 8
     1.9      Consultation .................................................................................................................. 8
     1.10     Literature Review, Analysis and Desktop Studies......................................................... 8
     1.11     Impact Methodology ...................................................................................................... 8
     1.12     Gaps, Limitations and Assumptions ............................................................................ 10
2.     DESCRIPTION OF THE SOCIO-ECONOMIC BASELINE ENVIRONMENT ...................... 12
     2.1      Defining the Local Area ............................................................................................... 12
     2.2      Socio-Economic Sensitive Areas Close to the Landfill................................................ 13
     2.3      Basic Demographic Profile .......................................................................................... 14
     2.4      Basic Services ............................................................................................................ 16
     2.5      Current Status of Landfill Air Space in Gauteng ......................................................... 18
     2.6      Health Status and Facilities ........................................................................................ 19
     2.7      Transport Services and Road Infrastructure ............................................................... 19
     2.8      Safety and Security ..................................................................................................... 20
     2.9      Education and Skills Levels ........................................................................................ 20
     2.10     Employment ................................................................................................................ 21
     2.11     Household Income ...................................................................................................... 22
     2.12     Local Economic Activities ........................................................................................... 22
     2.13     Identification of Local Community Priorities ................................................................ 23

                                                                                                                                                  i
3. POTENTIAL SOCIO-ECONOMIC IMPACTS OF THE LANDFILL DURING
CONSTRUCTION AND OPERATIONS........................................................................................ 25
3.1 Introduction ................................................................................................................. 25
3.2 Employment Opportunities .......................................................................................... 25
3.3 Increase landfill airspace through the resource recovery activities ............................. 27
3.4 Inflow of Jobseekers and Informal Reclaimers on Site ............................................... 27
3.5 Potential Impacts on Human Health............................................................................ 28
3.6 Potential Increase in Crime Rates and other Security issues in the Local Area ......... 31
3.7 Potential Economic Costs related to Ground and Surface Water Pollution ................ 32
3.8 Potential Economic Impact Related to Changes in Property Prices ........................... 34
3.9 Noise Related Impacts ................................................................................................ 35
3.10 Visual Intrusion and Impact on Sense of Place........................................................... 36
4. DECOMMISSIONING AND CLOSURE .............................................................................. 39
4.1 Nuisance Factors (Noise and Dust) during Decommissioning .................................... 39
4.2 Loss of land ................................................................................................................. 39
5. CONCLUSIONS AND RECOMMENDATIONS ................................................................... 41
6. REFERENCES .................................................................................................................... 42
6.1 Documents .................................................................................................................. 42
7. CURRICULUM VITAE OF SPECIALISTS .......................................................................... 45
7.1 Detailed Curriculum Vitae of Social Specialist ............................................................ 45
7.2 Detailed Curriculum Vitae of Economic Specialist ...................................................... 48
iiTABLE OF FIGURES
Figure 1: Location of affected ward and adjacent wards............................................................... 12
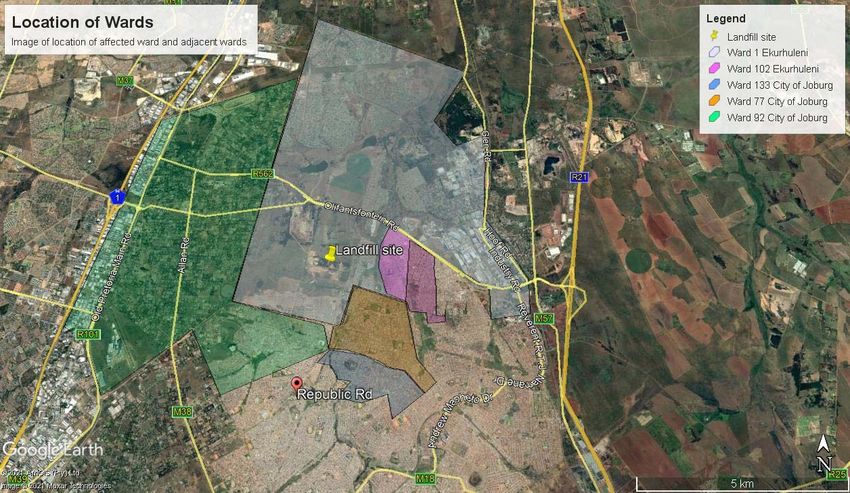
Figure 2: Socio- Economic Sensitive areas close to Olifantsfontein Landfill................................. 13
Figure 3: Population and Household Growth in Gauteng, 2011-2016 .......................................... 15
TABLE OF TABLES
Table 1: Acronyms .......................................................................................................................... 1
Table 2: Requirements for specialist reports, as contained in the 2014 EIA Regulations............... 6
Table 3: Severity ............................................................................................................................. 9
Table 4: Spatial Scale ..................................................................................................................... 9
Table 5: Duration ............................................................................................................................ 9
Table 6: Occurrence of the activity ................................................................................................. 9
Table 7: Certainty of the impact .................................................................................................... 10
Table 8: Impact Ratings ................................................................................................................ 10
Table 9: Basic Demographics of the Project Area, 2011 .............................................................. 14
Table 10: City of Ekurhuleni: Population by Age ........................................................................... 15
Table 11: Gender Profile ............................................................................................................... 16
Table 12: Basic Cultural Characteristics of the Local Area, 2011 ................................................. 16
Table 13: Service Delivery Backlogs in Main Gauteng Metros, 2016 ........................................... 17
Table 14: Service Delivery Backlogs in the Local Area Close to the Landfill, 2011 ...................... 17
Table 15: Reported Crimes in the Local Area Close to the Landfill, 2011 and 2019 .................... 20
Table 16: Highest Level of Education of the Adult Population, 20 years +, 2016 ......................... 20
Table 17: The Labour Force Composition, 2011 .......................................................................... 21
Table 18: The Official Unemployment Rate, 2011 – 2019 ............................................................ 22
Table 19: The percentage of households in different annual income categories, 2011 ................ 22
Table 20: Expected employment impacts of Olifantsfontein Landfill ............................................. 25
Table 20: Rating of positive employment impacts during construction ......................................... 25
Table 21: Rating of positive employment impacts during operations ............................................ 26
Table 22: Rating of increase of landfill airspace impacts during operations ................................. 27
Table 23: Rating of impact of jobseekers and informal reclaimers ............................................... 28
iTable 24: Rating of impact on human health ................................................................................ 30
Table 25: Rating of impact on safety and security ........................................................................ 31
Table 26: Rating of negative external costs related to surface and groundwater contamination .. 33
Table 27: Rating of the impact of disamenities on property values............................................... 34
Table 28: Rating of impact of noise .............................................................................................. 35
Table 29: Rating of visual intrusion and impact on sense of place ............................................... 37
Table 30: Nuisance factors ........................................................................................................... 39
Table 31: Loss of Value of Land ................................................................................................... 39
Table 32: Summary of Impacts ..................................................................................................... 41
iiGLOSSARY OF ACRONYMS
Table 1: Acronyms
Abbreviation Description
AQIA Air Quality Impact Assessment
CoJ City of Johannesburg Metropolitan Municipality
CoT City of Tshwane Metropolitan Municipality
CPF Crime Prevention Forum
DEA Department of Environmental Affairs
DWA(F) Department of Water Affairs (and Forestry)
DWS Department of Water and Sanitation
EIA Environmental Impact Assessment
EMM Ekurhuleni Metropolitan Municipality
EMP Environmental Management Plan
GARA Glen Austin Residents’ Association
Ha Hectare
IDP Integrated Development Plan
Km Kilometre
LED Local Economic Development
n.a. Not Available
NEMA National Environmental Management Act
SAPS South African Police Service
SEIA Socio-Economic Impact Assessment
1DETAILS OF SPECIALISTS
Ingrid Snyman (BA Honours degree in Anthropology) has 20 years’ experience in the social field.
Ingrid has been involved in various Social Impact Assessments during her career as social scientist.
These project themes consist of infrastructure development, waste management, road development,
water and sanitation programmes, township and other residential type developments. She has also
been involved in the design and management of numerous public participation programmes and
communication strategies, particularly on complex development projects that require various levels
and approaches.
An Kritzinger (Masters Economics) has been working as consultant in the economic development
field for the past 18 years. She has extensive experience in the economic profiling and economic
development plans for local authorities and districts in South Africa and has designed and
implemented a training project for sustainable local economic development monitoring for district
municipalities throughout South Africa in collaboration with the Development Bank of Southern
Africa. Her work has also concentrated on applied economic modelling in South Africa, Namibia,
Botswana and Mozambique including economic impact analysis, economic cost benefit analysis,
social incidence studies and macroeconomic forecast modelling.
DECLARATION OF INDEPENDENCE
This report has been prepared as per the requirements of Section 32 of Government Notice No.
R542 dated 18 June 2010 (Environmental Impact Assessment Regulations) under sections 24(5),
24M and 44 of the National Environmental Management Act, 1998 (Act 107 of 1998). We, Anna
Sophia Kritzinger and Ingrid Snyman declare that this report has been prepared independently of
any influence or prejudice as may be specified by the Department of Environmental Affairs (DEA).
Anna Sophia Kritzinger Ingrid Snyman
Signature of the specialists
Southern Economic Development Batho Earth
Name of group (trading name):
7 April 2021
Date:
21. INTRODUCTION
1.1 Project Background
Summer Symphony Properties 264 CC. (hereafter referred to as the applicant/license
holder/landowner) is the landowner of Portions 41 and 179 of the farm Olifantsfontein 410 JR, in the
Olifantsfontein area. The landowner has an existing Waste Management Licence for a category
G:L:B- landfill facility.
The site is situated to the east of Midrand and east of the Glen Austin Agricultural Holdings, west of
the K111 (Republic Road) and approximately 1.5 km south of the R562 (Olifantsfontein Road).
Tembisa is located to the east and south-east of the site. The farms fall under the jurisdiction of the
Ekurhuleni Metropolitan Municipality (EMM).
At present, the site is busy with construction. The License Holder intends to apply for an amendment
of the Olifantsfontein Waste Management Licence. The site is authorized to receive inert waste, but
the applicant would like to amend the licence to allow the acceptance of general wastes comprising
general- domestic, commercial, garden, builder’s rubble and general dry industrial waste for
disposal. On average it is expected that the landfill could receive around 15 000 tons of waste per
month. The landfill has around 3.5 million cubes of airspace which indicates to a lifespan of between
15 to 30 years (depending on the tons of waste it receives per month).
The landfill site would require a class B lining system for the disposal of general waste as prescribed
by Regulation 636 promulgated under the National Environmental Management: Waste Act (Act 59
of 2008).
1.2 Technical details
The site is intended to be a commercial waste disposal facility and as such it is intended that more
than 500 tons/day of waste will be received. The project, however, will have a design capacity in
excess of 1000 tons/day.
In view of the wastes to be accepted on site, the landfill will be designed to receive “Low Risk”
wastes. The landfill therefore requires a “Class B” containment barrier system.
The site development plan consists of the following:
Infrastructure and facilities
Access road, perimeter service road and on-site roads
Perimeter fencing and entrance gate and control
Storm water drainage measures
Office, ablutions and stores building
Weighbridges
Recycling yard and building
Composting yard
Landfill cells, and
Contaminated storm water run-off/leachate evaporation dam.
3A Materials Recovery Facility (MRF) will form part of the facility. The various waste components will
be extracted and separated on site through the use of manual and mechanical techniques. Such
waste would typically include metals, mixed plastics, paper, glass, card and textiles.
The main access roads on site would be paved. Dust suppression on the gravel roads would be by
means of wetting.
No definite end-use has been finalised. In terms of the infrastructure, and depending on the financial
viability at the time, these could either be refurbished for ongoing use or they could be demolished
and the area be rehabilitated to be incorporated within the surrounding environment. Ongoing
rehabilitation will be undertaken for the eventual closure of the landfill.
The landfill area will be subdivided into seven (7) cells and the development of each of these cells
will be phased. Cell No.1 will be completed, in terms of landfilling, as close as possible to the natural
ground level in order to allow time for the excavation and preparation of Cell No.2 to be completed
before commencing with the landfilling in Cell No.2. Therefore, all the landfill cells will be developed
sequentially and landfilled up to the original ground level. Thereafter the landfill will be raised, as a
terrace to final elevations.
The incoming waste tonnage and number of vehicles accommodated during the operating day will
determine the practical size of the day to day operating cell. The volumes of wastes being landfilled
and operational slopes will be monitored by the design engineer on a regular basis to ensure
compliance with design parameters. An excavator and at least two tipper trucks will be used to
excavate and place the cover material in a working cell.
Waste deposition will include spreading, compacting and daily covering of waste. Operational cells
will be as narrow as conditions permit to expose as little waste as possible to rainfall.
To minimise the inflow of water into the waste and to minimise odours, cover material will be
deposited and spread on the top of the cell on a daily basis. Putrescible waste (such as food waste
or dead animals) will be deposited and covered immediately.
Monitoring at the site would include environmental, health and overall operational monitoring
(Envitech, 2012).
1.3 Locality
The Olifantsfontein Landfill site can be viewed as a Brownfields site disturbed by sand quarrying and
is approximately 45 ha in extent. The site is zoned as “agricultural”. Access to the site would be
from the K111.
The site is situated to the east of Midrand and east of the Glen Austin Agricultural Holdings, west of
the K111 (Republic Road) and approximately 1.5 km south of the R562 (Olifantsfontein Road).
Tembisa is located to the east and south-east of the site. The Clayville/Olifantsfontein industrial area
is to the north east and the Randjiesfontein Agricultural Holdings to the north west. The site falls
within Ward 1 of the Ekurhuleni Metropolitan Municipality (EMM).
Illegal dumping of waste is taking place on site and on open land to the eastern side of the K111.
The area is also characterised by illegal sand mining, although recently authorised existing sand
quarry excavations are taking place on site. Construction of a trading store for a large retailer of
4building materials and associated products is underway on the south eastern section of the R562
and K111 intersection. Upgrading of this intersection is also undertaken.
The Clayville Industrial area includes manufacturing companies focused on the production of
pharmaceutical products, food and beverages, packaging products, plastic fabrication, steel and
metal manufacturers, and industrial equipment manufacturers, as well as construction related
businesses. The industrial area also hosts a company that specializes in the treatment of hazardous
waste.
The Interwaste FG landfill located to the north west of the Olifantsfontein Landfill site has been closed
and activities relating to closure of the site are being done.
1.4 The Legal Framework for Socio Economic Impact Assessments
Section 4 of the Minimum Requirements for Waste Disposal by Landfill, Second Edition
(DWAF, 1998) stipulates the need to identify the necessity for a landfill and to select the most
acceptable landfill site based on economic criteria and the willingness of the public to accept the
site. This means that preference should be given to the landfill that minimizes costs where costs
includes both financial costs (site development and transportation costs) and the social and
environmental costs to the community related to the site:
The need criteria refer to the high possibility of illegal/unregulated dumping and the associated
high public health costs to the community in case of the no-project option.
Economic criteria in the context of the document refer to the costs of obtaining, developing and
operating a landfill, including an evaluation of transportation costs. Factors such as economies
of scale, the distance of the landfill to waste generation areas, access to the landfill, soil quality
and acquisition costs play a role.
The public acceptance criteria involve issues such as the impacts on public health, local land,
property values and negative economic impacts on land-uses adjacent to the landfill.
The National Environmental Management: Waste Act (2008) stipulates that the effect of pollution
on the environment by a waste disposal activity should be taken into account when considering an
application for a waste management licence. This includes impact on economic conditions. The Act
furthermore requires that best practicable environmental options available and alternatives should
be taken to protect the environment, including economic conditions from harm as a result of the
undertaking of the waste management activity.
The National Environmental Management Act, Environmental Impact Assessment Regulations, GN
R543 (“NEMA EIA Regulations”) were published on 18 June 2010 and came into operation on 2
August 2010. These Regulations has been superseded with the 2014 EIA Regulations, GNR 982
published on 4 December 2014 and came into operation on 8 December 2014. These regulations
provide a suite of principles and tools to guide South Africa on a path to sustainable development.
“Environment’ is defined in holistic terms and includes biophysical, social and economic
components, as well as the connections within and between these components. While the act does
not prescribe a specific methodology in terms of socio-economic impact assessment the following
stipulations highlights the necessity to include socio economic issues in environmental impact
assessments.
The following general principles apply to all identified impacts:
5 Responsibility for the impact should apply throughout its life cycle.
The participation of all interested and affected parties in environmental governance must be
promoted.
Decisions must take into account the interests, needs and values of all interested parties.
The costs of remedying pollution, environmental degradation, consequent adverse health effects
and of preventing, controlling or mitigating further pollution, environmental damage or adverse
health effects must be paid for by those responsible for harming the environment, i.e. the so-
called polluter-pay principle.
The regulations also make provision for cumulative effects assessment identifying and evaluating
the significance of effects from multiple actions representing potential causes of impacts.
1.5 Checklist: Requirements for Specialist Reports, as Contained in the 2014 EIA
Regulations
Table 2: Requirements for specialist reports, as contained in the 2014 EIA Regulations
EIA REGULATIONS 2014 GNR 982 Appendix 6 Required at Required Cross-
Scoping/Desk- at BA/EIA reference in
CONTENT OF THE SPECIALIST REPORTS top Phase Phase this Report
a) details of the specialist who prepared the Detail of
report; and the expertise of that specialist to specialists: p. 2
X X
compile a specialist report including a
Section 7
curriculum vitae;
b) a declaration that the specialist is independent Declaration of
in a form as may be specified by the Independence:
competent authority; X X p. 2
c) an indication of the scope of, and the purpose Sections 1.6
X X
for which, the report was prepared and 1.7
d) the date and season of the site investigation Section 1.8.1
and the relevance of the season to the X X
outcome of the assessment;
e) a description of the methodology adopted in Section 1.8
preparing the report or carrying out the X X
specialised process;
f) the specific identified sensitivity of the site Section 2.2
related to the activity and its associated X X
structures and infrastructure;
g) an identification of any areas to be avoided, Section 2.2
X X
including buffers;
h) a map superimposing the activity including the Section 2.2
associated structures and infrastructure on
the environmental sensitivities of the site X X
including areas to be avoided, including
buffers
6EIA REGULATIONS 2014 GNR 982 Appendix 6 Required at Required Cross-
Scoping/Desk- at BA/EIA reference in
CONTENT OF THE SPECIALIST REPORTS top Phase Phase this Report
i) a description of any assumptions made and Section 1.9
X X
any uncertainties or gaps in knowledge;
j) a description of the findings and potential Section 3
implications of such findings on the impact of
X X
the proposed activity, including identified
alternatives on the environment;
k) any mitigation measures for inclusion in the Section 3
X
EMPr
l) any conditions for inclusion in the N/A
X
environmental Authorization;
m) any monitoring requirements for inclusion in Section 3
X
the EMPr or environmental Authorization;
n) a reasoned opinion— Section 5
as to whether the proposed activity or portions
thereof should be authorised; and
if the opinion is that the proposed activity or X
portions thereof should be authorised, any
avoidance, management and mitigation
measures that should be included in the
EMPr, and where applicable, the closure plan;
o) a summary and copies of any comments outstanding
received during any consultation process and X X
where applicable all responses thereto; and
p) any other information requested by the N/A
X X
competent authority
1.6 Scope of Work
The scope of the report includes an identification and description of the study area and the
identification of anticipated social impacts.
1.7 Purpose of the Report
The aim of the SEIA Report is to:
Determine the current socio-economic status of the area and the social characteristics of the
receiving environment;
Indicate the anticipated core impact categories and impact areas (possible hot spots);
Identify anticipated positive socio-economic impacts of the proposed project, and provide
enhancement measures for these impacts;
Identify and highlight negative socio-economic impacts (social hot spots) of the proposed project
and indicate mitigation measures to deal with these impacts;
7 Present the findings, recommendations, and conclusions of the Socio-Economic Impact
Assessment.
1.8 Site Visit
On 4 September 2020 a site visit was undertaken. The aim for the consultants was to familiarise
themselves with the site and possibly affected areas, as well as to obtain an overview of the social
characteristics of the study area and the socio-economic setting of the proposed landfill project.
1.9 Consultation
Consultation would rely on the public participation process to be undertaken by the Environmental
Assessment Practitioners (EAP) namely EcoPartners. If required, additional telephonic interviews
can be conducted with affected parties that are likely to be affected by the development.
1.10 Literature Review, Analysis and Desktop Studies
Secondary sources include:
Public documents including the Integrated Development Plans of the relevant municipalities
Statistics South Africa data including Census 2011 on ward level and Community Survey
2016 data on municipal level
Recent media articles related to the local area
Academic literature related to the local area
Specialists reports responsible for different EIA work streams including soil and wetland
assessment, groundwater, air quality, vegetation, geohydrological studies, greenhouse gas
emissions, biodiversity and so forth
Review of specialist reports
International and national literature related to external costs of landfills.
1.11 Impact Methodology
The following methodology was used to rank the anticipated impacts. Clearly defined rating and
rankings scales were used to assess the impacts associated with the proposed activities (Refer to
the tables below).
Each impact identified was rated according the expected severity, spatial scale, duration, occurrence
of the activity and certainty of the impact. Each impact identified was assessed in terms of the
consequence and likelihood. Consequence was determined as follows:
Consequence = Severity x Spatial Scale x Duration
The Risk of the activity was calculated based on occurrence of the activity and impact and the
certainty of the impact actually occurring. Thus:
Likelihood = Occurrence of activity x Certainty of impact
The impact risk is then based on the consequence and likelihood.
Impact Risk = Consequence x likelihood
In order to assess each of these factors for each impact, the ranking scales in Table 3: Severity to
Table 7 were used.
8Table 3: Severity
This refers to how severe the activity impacts on the Environment.
Parameter Receiving Environment Ranking
Disturbance of degraded areas, which have little conservation
No Conservation Value 1
value. Minor change in species occurrence or variety. (Low)
Historically disturbed area or brownfields area. Deep water
Brownfields / Previously Disturbed 2
tables (>30m). Plentiful and available renewable resources.
Disturbance of areas that have potential conservation value
Conservation Value (ESA) or are of use as resources. Complete change in species 3
occurrence or variety. (Medium)
Sensitive. Threatened, protected and or endangered areas
not in immediate proximity, but not far away. Close proximity
Sensitive Ecological Area (CBA) of large water courses (within 1: 50 year flood line), very 4
shallow water tables (Parameter Receiving Environment Ranking
Occasionally Occasionally. 10%-30% 2
Medium Likelihood Medium Likelihood. 30% - 50% 3
High Likelihood High Likelihood Greater than 50% - 75% 4
Definite >75% - 100% chance of occurring 5
Table 7: Certainty of the impact
This refers to how of often the activity would impact on the environment.
Parameter Receiving Environment Ranking
Unsure. Less than 10% sure of a particular fact or the likelihood of an impact
Uncertain 1
occurring. Rare (could happen but unlikely)
Possible. 10-30% sure of a particular fact or of the likelihood of an impact
Possible 2
occurring. Unlikely (has occurred somewhere
Probable. Over 30%-50% sure of a particular fact of the likelihood of that
Probable 3
impact occurring. Likely (known to occur)
High Likelihood Greater than 50% - 75% sure of a particular fact of the
Certain 4
likelihood of that impact occurring
Definite. 75%-100% sure of a particular fact. Substantial supportive data exist
Definite 5
to verify the assessment. Inevitable (Expected to happen often)
Environmental effects will be rated as either of high, medium or low significance on the basis
provided above.
Table 8: Impact Ratings
How acceptable is the impact? Impact Significance Rating
Low (Acceptable). Low risk to public health; environment. Individuals view possible social impacts differently due to their association with the anticipated
impact. Impacts could therefore be perceived and rated differently than those contained in the
Report.
The potential external costs associated with the project was based on information supplied by
sub-specialists for the Environmental Impact Assessment of the project
112. DESCRIPTION OF THE SOCIO-ECONOMIC BASELINE ENVIRONMENT
Each community is unique as it is shaped by its social networks, cultural influences, values and
norms, politics and the infrastructure in the area. The report therefore provides an overview of the
social characteristics of the area in order to determine its current capacity and its ability to manage
change.
2.1 Defining the Local Area
The Olifantsfontein landfill site is situated in the northern sections of the City of Ekurhuleni
Metropolitan Municipality in the East Rand region of Gauteng, South Africa. Germiston is the seat of
the Ekurhuleni Metropolitan Municipality. North eastern wards of the City of Johannesburg
Metropolitan Municipality (CoJ) border the landfill to the west while the City of Tshwane (CoT)
borders Ekurhuleni Ward 1 (where the landfill is situated in the north east).
For purposes of the socio-economic baseline profile of the local community, the focus will be on local
communities adjacent to the site:
The landfill is situated in Ekurhuleni Ward 1. The ward is situated in the northern section of
Ekurhuleni and includes the residential lifestyle estate of Midstream adjacent to the CoT in the
northern sections and Olifantsfontein industrial area to the east. The ward also includes
Clayville, an outlying northern section of Tembisa north of Olifantsfontein road.
Ekurhuleni Ward 102 lies east of the landfill and includes the western extensions of Tembisa,
including the western sections of Tswelopele south of Olifantsfontein road.
CoJ Ward 92 is situated west of the landfill and includes the low density agricultural holdings of
Glen Austen and Randjiesfontein that forms part of the larger Midrand area.
CoJ Wards 77 and 133 is situated south of the landfill and includes Ivory Park on the south
eastern edges of Midrand but also sometimes claimed as suburb of Kempton Park and Tembisa.
Figure 1: Location of affected ward and adjacent wards
12In terms of waste management, the waste management jurisdictions of the CoJ, CoT and Ekurhuleni
could be relevant.
2.2 Socio-Economic Sensitive Areas Close to the Landfill
As will be discussed in more detail in Section 3 below, research suggests that the highest socio-
economic impacts of landfills occur within a 1km to 4km radius from landfill sites. Within the 4km
radius Figure 2 below shows:
High density residential areas to the south (towards Tembisa)
Low density plots of Glen Austin and Randjiesfontein to the west
Parts of Olifantsfontein industrial area and Tembisa’s Clayville are located within the 4km
boundary east from the landfill
A retail complex (Mall of Tembisa / Cashbuild) opened its doors on 20 November 2020, lying
within the 1km boundary of the site (north east) in Tswelopele (Tembisa)
Parts of Kaalspruit (flowing in a northerly direction towards Centurion in CoT) within 1km from
the site
Olifantsfontein road (R562) passing some 1km north of the proposed site
Glen Austin Bird Sanctuary to the south west of the landfill within the 4km radius.
Figure 2: Socio- Economic Sensitive areas close to Olifantsfontein Landfill
132.3 Basic Demographic Profile
The City of Ekurhuleni has experienced a significant population growth in the last 20 years. Since
2000 the City’s population increased from an estimated 2.3 million individuals to approximately 3.3
million in 2016. The City’s population growth rate is steady at 2.47% per annum, coming down from
a high of 4% per annum in the period between 1996 and 2001. The current population represents
over 6% of the total population of South Africa (StatsSA: 2017). An important contributor to the
growth in the Ekurhuleni population is the in-migration into the City (City of Ekurhuleni: 2018).
As indicated in Table 9 below, the population densities to the east and south of the landfill is
considerably higher than to the west or north of the landfill. The relatively smaller household sizes in
Ekurhuleni Ward 102 and the CoJ wards south and east of the landfill together with the high ratio of
males and people in their economically active years suggests relatively high levels of in-migration in
the wards surrounding the landfill.
Table 9: Basic Demographics of the Project Area, 2011
Average
Total % Working Household Pop Density
AREA1 Population % Males Age (18‐64) Households Size /Km2
Ekurhuleni Ward 1 (landfill 27 896 49.5% 64.7% 8 943 3.1 675
ward)
Ekurhuleni Ward 102 48 656 57.9% 74.8% 22 719 2.1 15 819
(Tswelopele) – east
CoJ Ward 92 (Glen Austin& 36 978 52.4% 69.3% 13 998 2.6 33
Randjiesfontein) ‐west
CoJ Wards 77 and 133 (Ivory 84 350 54.3% 70.8% 32 412 2.6 12 512
Park) ‐south
Ekurhuleni 3 178 471 51.2% 67.4% 1 080 646 2.9 1 606
CoJ 4 434 827 50.2% 68.8% 1 550 241 2.9 2 691
Gauteng 12 272 263 50.4% 67.8% 4 164 641 2.9 675
South Africa 51 770 560 48.7% 59.8% 15 065 018 3.4 42
Source: Stats SA (2011)
As indicated in Figure 3 below, since 2011 the population growth in Gauteng and in particular the
City of Johannesburg is much higher than the average population growth for South Africa indicating
to continued population influx into the province as well as the Johannesburg metro. While the City
of Ekurhuleni does not seem to experience the same levels of in-migration after 2011, household
growth in the area was much higher than population growth, even outstripping household growth
levels of the CoJ. This trend could suggest a higher level of splitting off into households into smaller
units than in the country as level. This trend poses challenges for Ekurhuleni metropolitan authority
in terms of the availability of affordable housing and associated municipal household services (e.g.
waste collection, electricity and water).
1
Refer to Figure 1 for a basic layout of the affected ward and adjacent wards
14population growth 2011‐2016 household growth 2011‐2016
4% 3,8%
3,6%
3,5%
4%
3%
3% 2,4%
2,2%
2% 1,8%
1,5%
2% 1,2%
1%
1%
0%
Ekurhuleni CoJ Gauteng South Africa
Figure 3: Population and Household Growth in Gauteng, 2011-2016
(Source: Stats SA 2011 and 2016)
According to the Community Survey of 2016, approximately 18.7% of the households in the City of
Ekurhuleni are informal dwellings. 52.9% of households are fully owned or being paid off, while
32.8% of the households have women as their heads. There are also 3 737 child-headed
households (www.wazimap.co.za).
The City of Ekurhuleni has a median age of 30 and 66% of the population is between the ages of
18-64, 18% is below the age of 18 and 6% is above the age of 65. The city has a relatively young
population which is about the same rate as that of Gauteng Province (www.wazimap.co.za). The
African population accounts for 80% of the population followed by the white population at 14%, the
Coloured population at 3% and the Indian population at 2%.
Males make up 51% of the population within the city and females account for 49%.
Table 10: City of Ekurhuleni: Population by Age
City of Ekurhuleni: Population by Age
Age Category Total Percentage
Under 18 years 946,843 28%
18-64 years 2,225,730 66%
65 and over 206,531 6%
(www.wazimap.co.za).
15Table 11: Gender Profile
City of Ekurhuleni: Gender Profile
Gender Total Percentage
Males 1,736,750 51.4%
Females 1,642,354 48.6%
From the above it is clear that the population composition is typical of that of the rest of South Africa
with the majority of people falling within the 18 to 64 years age category and the balanced gender
profile.
Within the City of Ekurhuleni, Isizulu is the most widely spoken language at home at about 34%
followed by Sepedi at 12%, Sesotho at 11% and English at 10% (www.wazimap.co.za). Generally,
the population of the City speak more than 1 official South African language and all 11 languages
are spoken within the City (City of Ekurhuleni: 2018).
The table below shows the relative high percentage of the Black African population (Sepedi and
Xitsonga speakers) in the wards surrounding the landfill. Ehurhuleni Ward 1 (where the landfill is
situated) is an exception mainly because of the presence of the large Midstream Estate further to
the north that forms part of the ward.
Table 12: Basic Cultural Characteristics of the Local Area, 2011
% Black African % born in % born
AREA Main languages %
population Gauteng outside SA
Ekurhuleni Ward 1 (landfill ward) 64.8% Afr (25%); Eng (13%) 42.9% 5.8%
Ekurhuleni Ward 102 (Tswelopele) –
99.1% Sepedi (46%); Xitsonga (25%) 20.3% 10.6%
east
CoJ Ward 92 (Glen Austin&
91.2% Sepedi (28%); Xitsonga (10%) 34.7% 15.0%
Randjiesfontein) ‐west
CoJ Wards 77 and 133 (Ivory Park) ‐
99.0% Sepedi (25%); Xitsonga (26%) 35.4% 16.8%
south
Ekurhuleni 78.7% isiZulu (34%); Sepedi (12%) 54.8% 8.0%
CoJ 76.4% isiZulu (23%); Eng (20%) 52.0% 12.6%
Gauteng 77.4% isiZulu (20%); Eng (13%) 54.4% 9.2%
South Africa 79.2% isiZulu (23%); (isiXhosa 22%) 14.7% 4.2%
Source: Stats SA (2011)
The relatively low percentages of the population born in Gauteng as well as the relatively high
percentages born outside the country underscore the relatively high-in-migration rates into the area,
from other provinces in South Africa as well as from outside South African borders.
2.4 Basic Services
The table below shows high housing backlogs in the main Gauteng metros in 2016. In Ekurhuleni
28% of households lived in shacks or backyard flats in 2016 and in the CoJ almost a third (31%).
These percentages are much higher than the already high 20% for South Africa in general. However,
households (including informal settlements) in the Gauteng metros are in general better serviced in
16terms of water provision, flush toilets and regular waste removal than households in the South Africa
on average. The exception is the relatively high electricity backlogs in Ekurhuleni.
Table 13: Service Delivery Backlogs in Main Gauteng Metros, 2016
% of Households % of Household % of h
AREA % of Households without water % of Household without regular Household with
living in shacks service without flush service (once a no access to
or backyard flats providers toilets week) electricity
Ekurhuleni 28.2% 2.5% 10.6% 12.6% 10.2%
CoJ 30.8% 2.7% 8.1% 12.6% 6.4%
CoT 23.4% 7.8% 20.6% 20.2% 5.2%
Gauteng 27.6% 4.7% 12.1% 14.8% 7.4%
South Africa 19.6% 19.7% 41.5% 43.3% 7.3%
Source: Stats SA (2016)
Despite the relatively smaller backlogs in municipal service provision in the Gauteng metros, the
table above indicates that 13% of households in Ekurhuleni and CoJ did not receive regular (once a
week) waste removal services while 20% of households in the City of Tshwane did not receive
regular waste removal services.
Table 14 below shows the low service delivery levels to the east of the landfill especially Ekurhuleni
ward 102 (Tswelopele area) and to some extent also the south (CoJ wards 77 and 133 – Ivory Park).
The large housing backlogs in these areas are evident compared to the average for South Africa.
From a groundwater perspective it is worth noting that around 2% of households in the Glen Austin
and Randjiesfontein area (CoJ ward 92) and 5% of households to the east of the landfill (Ekurhuleni
Ward 102 -Tswelopele) made use of boreholes in 2011. This is below the 6% average for South
Africa. In Ekurhuleni ward 1 (the landfill area and including areas north of the landfill, less than 1%
of households made use of boreholes.
Table 14: Service Delivery Backlogs in the Local Area Close to the Landfill, 20112
% of households % of households % of household % of household
AREA living in shacks or without water without flush without regular
backyard flats service providers toilets service (once a week)
Ekurhuleni Ward 1 (landfill ward) 14.6% 2.3% 3.0% 3.6%
Ekurhuleni Ward 102 (Tswelopele) – east 70.3% 8.3% 30.6% 26.9%
CoJ Ward 92 (Glen Austin& Randjiesfontein) -
14.2% 4.0% 5.9% 2.4%
west
CoJ Wards 77 and 133 (Ivory Park) -south 40.2% 2.7% 10.5% 3.2%
Ekurhuleni 27.1% 4.7% 14.8% 9.9%
CoJ 25.0% 4.9% 12.2% 5.1%
Gauteng 23.1% 6.5% 15.5% 11.4%
South Africa 15.8% 23.1% 40.0% 42.0%
Source: Stats SA (2011)
2
Stats SA 2011 data was used since 2016 community survey data is not available on ward level
172.5 Current Status of Landfill Air Space in Gauteng
According to the Draft 2018 State of Waste Report (DEA, 2020), only 7% of South Africa’s waste
was reused or recycled rather than being treated as disposed of in 2017. With a growing population,
large waste collection backlogs and increased urbanisation, waste generation is expected to
increase rapidly in future. With limited landfill airspace available and the construction of new landfills
lagging behind, the Revised and Updated National Waste Management strategy (DEA, 2020)
continues focusing on waste minimisation strategies. These include waste prevention, waste
recycling and recovery around waste as a resource to achieve a more circular economy. The
increase of recycling and recovery rates forms a core aspect of the waste minimisation strategy.
Sufficient landfill airspace will also enable local government to focus on ensuring that citizens receive
appropriate waste services and that the delivery of these services contributes to sustainable
development.
Gauteng Province is by far the biggest generator of waste in South Africa and generates roughly
33% of total national waste. In the medium term (10 to 20 years) the province faces serious
challenges in terms of available landfill air space. This could be ascribed to the low recycling rates,
a number of landfills closing down and the limited remaining landfill life for many municipal landfill
sites. It is anticipated that out of the 9 municipal landfill sites currently in operation only 4 municipal
landfills in Gauteng will be operational within the next 10 to 20 years including Hatherley (CoT);
Rooikraal (Ekurhuleni); Weltevreden (Ekurhuleni) and Platkop (Ekurhuleni) (Otto, 2020):
The City of Ekurhuleni currently has 5 large regional landfills operated under contract namely
Rietfontein (GLB+) Rooikraal, Weltevreden, Platkop and Simmer & Jack (all GLB-). There are no
municipal landfills in the northern sections of Ekurhuleni. All the municipal landfill sites in Ekurhuleni
are located in the southern sections of Ekurhuleni close to Germiston and Springs -some distance
from Tembisa. Rietfontein was the last municipal landfill licensed and developed in Ekurhuleni in
1997. The estimated remaining life for Rietfontein and Simmer & Jack is between 5 and 10 years
while the estimated remaining life for Rooikraal, Weltevreden and Platkop are 20 years plus.
Apart from the 5 municipal landfills above there is currently 2 landfills operated by the private sector
in Ekurhuleni namely Chloorkop (close to Edenvale) and Tonk Meter Road (close to Springs). Both
of them are situated in the southern sections of Ekurhuleni. FG Landfill situated in the northern
sections close to Tembisa was closed by a directive of the National Environmental Department in
2017.
The City of Tshwane has 1 large regional landfill; 1 medium landfill; and 2 small landfills operated
by the municipality: Hatherley (GLB-), GaRankuwa (GMB-), Bronkhorstspruit and Soshanguve
(GSB-). Hatherley was the last municipal landfill licensed and developed in CoT in 1997. The
estimated remaining life for Bronkhorstspruit, GaRankuwa and Soshanguve is between 5 and 10
years while the estimated remaining life for Hatherley is 20 years plus. There are no municipal
landfills in the southern sections of the CoT. In the past 5 years the CoT closed down several
municipal landfills, namely Onderstepoort, Derdepoort, Valhalla, Temba, Kwaggasrand, and
Garstkloof resulting in a rise in illegal dumping.
18The CoT has the largest number of private landfills of all three metros including Rosslyn, Multisand
and Bon Accord (all three situated in the north-west of CoT) and Mooiplaats close to Centurion in
the south western sections of the municipal area.
The City of Johannesburg (CoT) has 3 large regional landfills and 1 medium landfill operated by the
Municipality namely Goudkoppies, Marie Louise, Robinson Deep (all GLB-) and Ennerdale (GMB-).
Marie Louise was the last municipal landfill licensed and developed in CoT in 1992. The estimated
remaining life for Goudkoppies, Marie Louise, Robinson Deep and Ennerdale are between 0 to 5
years. There is only one private landfill operational in the central area of CoJ, namely Genesis landfill.
2.6 Health Status and Facilities
According to the StatsSA community survey of 2016, the life expectancy in the City of Ekurhuleni is
61.2 years for males and at 66.7 years for females. Life expectancy in the City has thus increased
in line with national figures. The infant mortality rate is estimated at 32.8 per 1000 live births
(StatsSA, 2017).
Health and social development challenges in the City that were listed as part of the IDP included:
Building of new clinics
Shortage of medication
24hr operation of clinics
Staff shortage at clinics
Provision of mobile clinic
Construction and support to Early Child Development Centres; and
High level of substance abuse amongst the youth.
Despite the above and other challenges in financing primary health care, there are approximately 90
clinics in the City of Ekurhuleni and 11 of these clinics operate 24 hours per day. These alleviates
some of the strain on the hospitals’ emergency services. There are also social development offices
as well as rehabilitation centres to provide further healthcare services. The city still aims to further
increase the number of local clinics piloting the 24-hour health care programme. In Ward 102 the
New Tswelopele Winnie Mandela Clinic is planned. (City of Ekurhuleni: IDP: 2020;
www.ekurhuleni.gov.za).
2.7 Transport Services and Road Infrastructure
The study area is surrounded by a well-developed road infrastructure, which includes the N1, the
R21, the K111 and the R562.
The area also has diverse transportation modes ranging from and dominated by taxis and buses
that serve the residents and workers in the area. It is, however, imperative to link the different areas
by means of public transport to ensure ease of access to employment opportunities.
The City’s rail passengers make up 39% of total estimated daily commuters, while bus passengers
only make up 2% of that number. Minibus taxi passengers make up 59%. In addition, there is a
large flow of passengers across municipal boundaries to and from the City of Johannesburg and the
City of Tshwane (City of Ekurhuleni: IDP: 2020).
19You can also read