Observations of protoplanetary disks - NBI Summer school Protoplanetary disks dr. Nienke van der Marel NRC Herzberg, Victoria BC ...
←
→
Page content transcription
If your browser does not render page correctly, please read the page content below
Observations of
protoplanetary disks

   NBI Summer school Protoplanetary disks
           dr. Nienke van der Marel
         NRC Herzberg, Victoria BC
     http://www.nienkevandermarel.com
                 @NienkeMarel
                August 6th 2019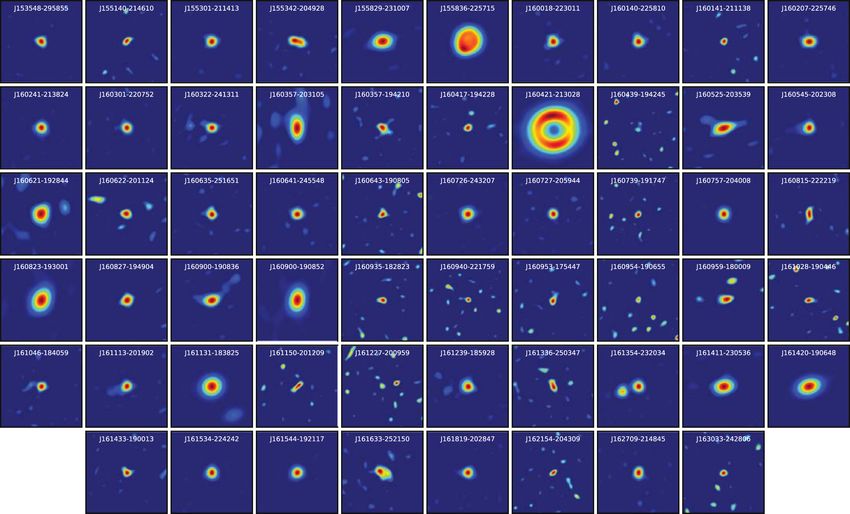
Contents
•   Disk structure
•   How to observe
     • Dust radiative transfer
     • Line excitation
•   UV/optical (accretion)                 Remember: not embedded in the cloud,
                                             so it is possible to study the disk
•   NIR
                                                 directly in all wavelengths
     • Inner disk (SED)
     • Rovibrational lines
     • Interferometry                            Today: primarily discussing
     • Scattered/polarized light                  unresolved observations
•   IR and FIR                                Tomorrow: gaps in disks (resolved)
     • Dust composition
     • Molecular lines
•   Submillimeter and millimeter
     • Disk mass
     • Chemistry
•   Centimeter and beyond
•   Future facilities              Slides available at www.nienkevandermarel.com!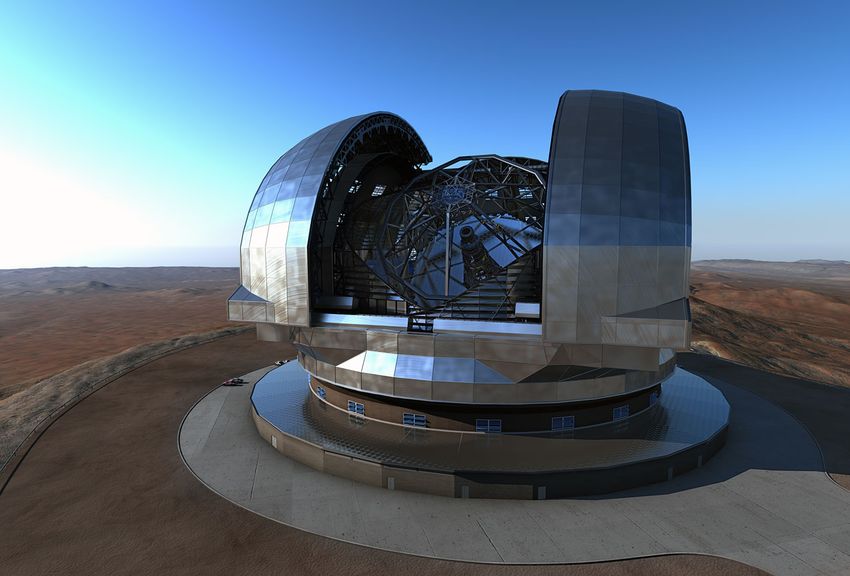
Disk structure
Disk structure

             Henning & Semenov 2013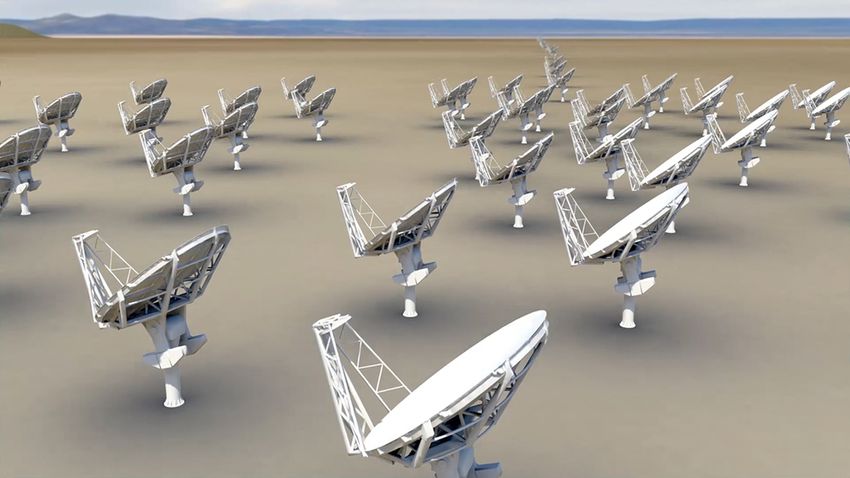
How to observe
How to observe
      Dust                                1/d2

•
                                         ∫
    Flux density
    (Jansky = erg s-1 cm-2 Hz-1)     Fν = IνdΩ
•   Specific intensity             Iν = Bν(T )(1 − e −τν)
    (erg s-1 cm-2 Hz-1 sr-1)
                                       2hν 3  1
•   Planck function            Bν(T ) = 2 hν/kT
                                        c e     −1
                                κνΣdust
•   Optical depth        τν =
                                 cos i
•   Dust opacity     κν ∼ ν β
                    κν ∼ n(a) ∝ a −p, amax, amin
                               + composition
Dust opacity wavelength dependence: at wavelength λ
you are sensitive to grains up to size ~3 λ                 Draine 2006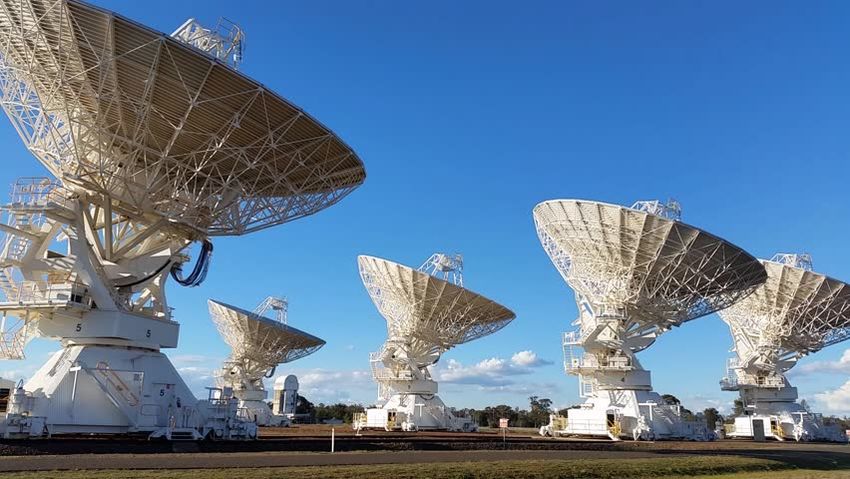
How to observe
Dust
                                          Bν(T )κν Mdust          Commonly used to
Optically thin: τν < < 1 :        Fν =                          derive disk dust masses
                                                 d2
                                                  2           2+β        α
 Rayleigh-Jeans: Bν(T ) ∼ ν 2            Fν ∼ ν κν ∼ ν              ∼ν
In practice:
•   Dust opacity tables can be computed using Mie-theory: many tables available online
•   Either integrated flux (entire disk) conversion to mass
    OR
•   Full radiative transfer: compute dust temperatures throughout the disk based on a
    stellar radiation field and dust density structure, and compute SED and images at
    various wavelengths and compare with data
•   Flux density is function of frequency/wavelength: remember: superposition
    blackbodies and opacities
•   Radiative transfer codes: e.g. RADMC, MCFOST, etc. (see Thursday hands-on)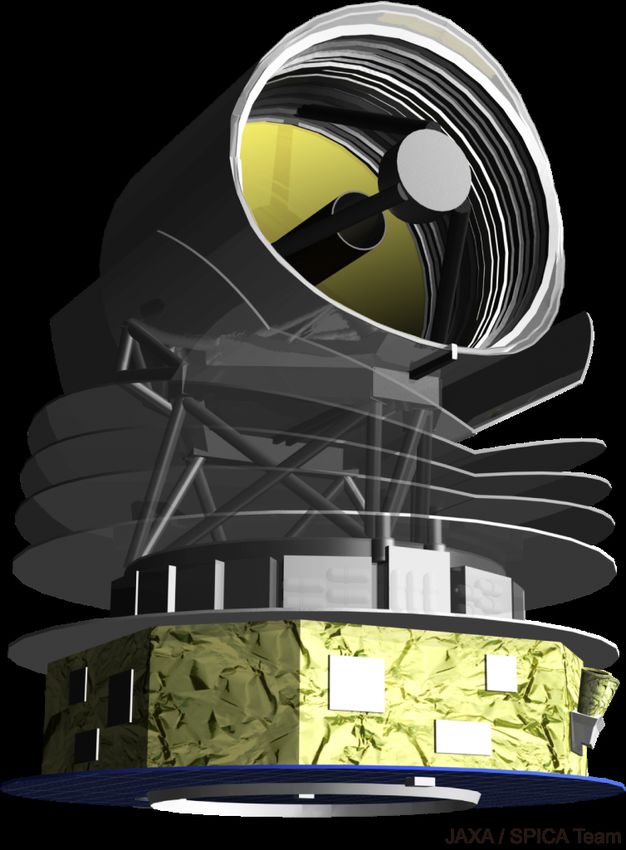
How to observe
Line    Local Thermodynamic Equilibrium (LTE): collisions lead to excitation
                      and spontaneous emission photon

                                                      Find transitions + frequencies:
                                                       http://www.splatalogue.net

 Different electronic states, defined
        by quantum numbers:
  In rovibrational lines, e.g. v=2-1
    In rotational lines, e.g. J=3-2
   Fine structure, e.g. F=5/2-3/2

        Some transitions are
‘forbidden’ (rare): brackets, e.g. [OI]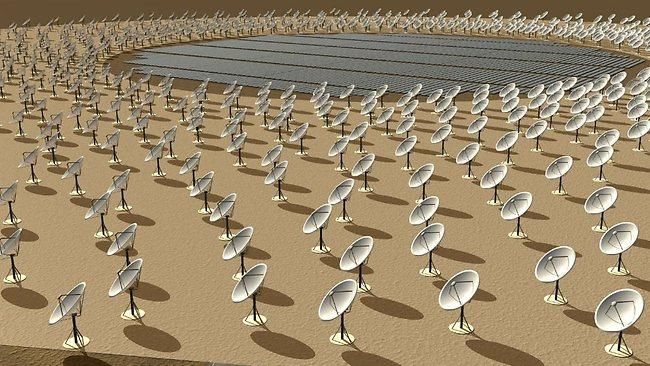
How to observe
   Line    Local Thermodynamic Equilibrium (LTE): collisions lead to excitation
               and spontaneous emission photon: Boltzmann distribution

                             g = degeneracy of energy level            Line broadened by
                                                                      turbulence+rotation

  Calculate molecular column
density using integrated line flux,
   assuming a temperature
                                       Q(T)=partition function
    In practice, need to make
  additional assumptions about                                   Integrated line flux
abundance throughout disk, and
 temperature/density gradients:                       Aul = Einstein coefficient
                                                    (spontaneous emission rate)
 full physical-chemical models
          disk structure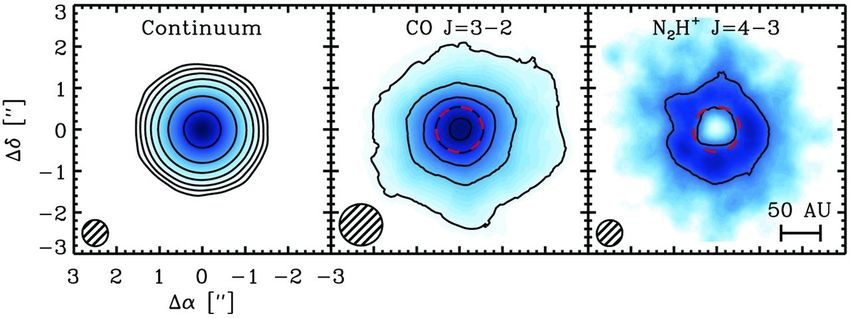
How to observe
UV and optical
     Accretion: matter from the inner disk edge is channeled along the magnetic field
     lines onto the star, resulting in shocked gas with T~104 K, shown as UV excess
                          and line emission (e.g. Balmer, Paschen).
                                                                                Analysis spectra often
    UV excess:                                                                together with spectral type

                                                                  H-alpha

UV accretion luminosity Lacc can be converted to accretion rate Macc (Mo yr-1).

Careful: in several papers in 90s and 00s, the width of the H-alpha line (equivalent
width, 10%width) is converted to Macc as well. Don’t trust these values as these
lines also have contributions from disk winds and chromospheric activity. Proper         Alcala et al. 2014
analysis requires full spectra from UV to NIR (X-shooter)                            Alexander et al. 2006
UV and optical
• Typical accretion rates: 10-7 to
10-11 Mo yr-1 (detection limit)
• Correlation accretion rate ~ disk
mass: consistent with viscous
disk model on ~few Myr time
scales
• Terminology: Classical T Tauri
Star (CTTS) vs Weak-line T Tauri
Star (WTTS): threshold for line-
width H-alpha for accreting vs
non-accreting disks (but careful!
No UV!). Correlation with Class II
& Class III disks, respectively.
Manara et al. 2014
Kenyon & Hartmann 1995•
NIR
NIR excess (in a transition disk) has been
studied in detail in SEDs, by fitting a dust
surface density profile with an inner disk
• Main limitation: size inner disk
unconstrained, sensitive to inner edge
• Inner rim shape modeled physically in
detail: smooth increase but puffed up
(hydrostatic equilibrium)
Quantify amount of
dust in inner disk: dcav
Interest inner disk: accretion rate vs amount of material:
material flowing through gap? Dissipation timescale? Isella et al. 2004
Inner disk radius (sublimation)? Andrews et al. 2011NIR
Seasaw variability: anti correlation NIR and MIR as function of time:
time scales of weeks and years! (limited data)
2004 Feb 1
2008 Oct 1
2008 Oct 8
• Explanation: varying shadowing of inner disk wall onto the outer disk wall, due to
warping (misalignment of inner disk vs outer disk), perhaps caused by planets?
• Limitation: Spitzer-IRS spectra only taken in multiple epochs for handful of
sources
• Need MIR telescope to measure this behaviour: after Spitzer (cold mission) was
finished, no more follow-ups
Muzerolle et al. 2009
Espaillat et al. 2014NIR interferometry
• VLTI: infrared interferometry
• Four movable 1.8m telescopes
next to 8.2m VLTs
• Instruments: PIONIER (H-band: 1.6
μm), GRAVITY (K-band: 2.2 μm)
and recently: MATISSE (L, M, N-
band: 3-5 μm)
• Optical/NIR (OIR) interferometry
much more complex than radio,
due to photon collection: not
possible to amplify signal like in
radio waves when splitting it over
multiple baselines, so cannot build
array of 66 OIR telescopes and
limited to bright sources
• Spatial resolution is ~ few
milliarcseconds, but imaging not
possible due to poor uv-coverageNIR interferometry
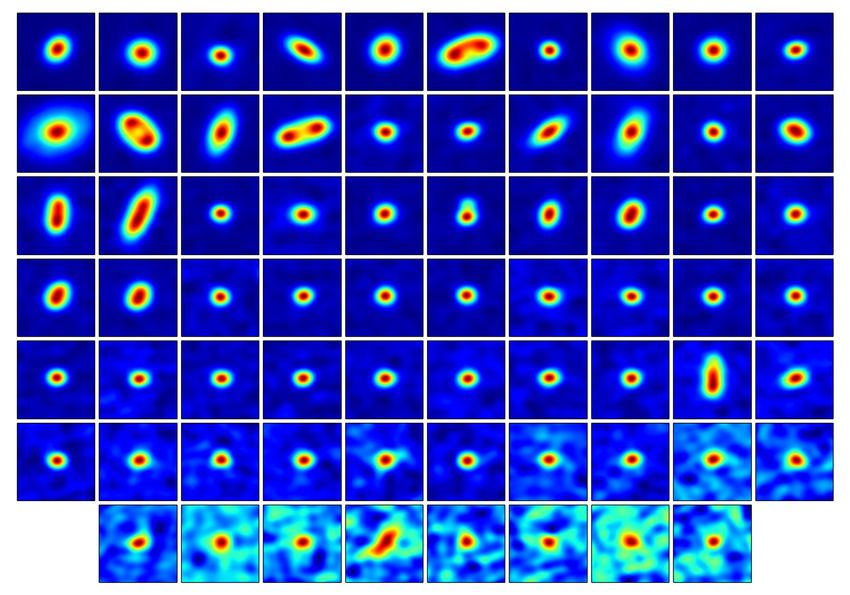
Example: Survey 51 Herbig stars with VLTI PIONIER
Example models: ellipse, ring, asymmetry? (notice scales!)
Visibility profile
5
0
5
5 0. 5
RA (mas)
symbols: wavelengths
Main results:
• Tsub (inner edge)~1800 K
• Axisymmetric ring most common
• Wide rings: dr/r ~ 0.5
• Thickness z~0.2-0.5
r (au)
• Luminosity - radius correlation confirmed
Log Lstar Lazareff et al. 2017NIR rovibrational lines
• Rovibrational CO lines (also H2O, OH, HCN, ..):
excitation temperatures >1000 K
• originating from inner few AU
• excitation through a combination of collisional
excitation, infrared pumping and UV fluorescence
• for high spectral resolution (e.g. Keck/NIRSPEC:
R~25 000 or 12.5 km/s, or VLT/CRIRES: R~95 000
or 3.2 km/s) lines are spectrally resolved =>
proxy for spatial location
Salyk et al. 2009, 2011
Brown et al. 2012, 2013
Pontoppidan et al. 2008, 2011NIR rovibrational lines
• Line profiles:
• Many profiles single-peak
rather than Keplerian: disk winds?
• Spectroastrometry transition disks:
measure line profile for different
orientations across disk and use
combination of position and velocity
to measure inner radius CO:
gas cavity radius < dust cavity radius
• Keplerian: derive inner radius CO: difference
with NIR continuum
=> relation to planet presence?
Bast et al. 2011
Pontoppidan et al. 2008
Banzatti et al. 2015, 2017, 2019NIR: scattered light images • NIR images of scattered light: • Sensitive to surface layers only (scattered light or polarised light) • Sensitive to small dust grains ( λ-dependence dust opacity) • Brightness drops quickly with radius: sensitive out to ~tens of au (not outer disk) • High spatial resolution: need 8m-class telescope with AO system • Depending on technique may need coronagraph to block star
NIR: scattered light images

Large variety of structures: rings, gaps, spiral arms, asymmetries

                                      Credits: VLT/SPHERE and Subaru/HICIAO/ScEXAO
NIR scattered light images
Spiral arms: density Shadows: misaligned inner disk
waves due to planets? (warp) due to companion?
Also seen in velocity profile:
Usually not visible in mm
(ALMA): scale-height
variations? Warps are pretty
common in disks!
DSHARP spirals:
gravitational instability? Dong et al. 2015, 2017
Marino et al. 2015MIR and FIR
MIR continuum spectra (Spitzer IRS):
=> many broad features, originating from different
dust species (silicate, olivine, forsterite, etc.) and
Poly Aromatic Hydrocarbons (PAHs)
Bouwman et al. 2008
Geers et al. 2007MIR and FIR
• Edge-on disks: ices => IR absorption
Pontoppidan, Dullemond et al. 2005MIR and FIR
• Herschel: Far infrared lines:
disk atmosphere
• CO ladder (J transitions >15)
• [OI]: 63, 145 μm
• [CI]: 370, 810 μm
• [CII]: 158 μm
• H2O: e.g. 179, 78 μm
• Approach: estimating excitation
temperature (few 100 K), number of Reminder:
molecules using simple models => origin
of the lines
• Disk Herschel surveys: GASPS (GAS in
Protoplanetary Systems), DIGIT (Dust, Linear relation: Meeus et al. 2010,2012
Ice Gas In Time) Rotational diagram Fedele et al. 2013MIR and FIR
• CO ladder using Herschel data:
Full disk model of HD100546
Bruderer et al. 2012MIR and FIR
• Search for correlations
between different lines
and disk properties
• General conclusion:
large variety of line
strengths throughout
sources, unclear origin
Carr & Najita 2011
Salyk et al. 2011
Meeus et al. 2012(Sub)millimeter
• Range: ~350 μm - 3 mm or 100 - 750 GHz (radio instrumentation!)
• Optically thin wavelengths: trace full disk mass!
• Single dish observations tricky:
due to resolution ~ λ/D, even for 30m telescope:
res~15” (confusion with surroundings!)
• Most reliable disk observations use millimetre interferometry: SMA, PdBI,
CARMA and ALMA (not necessarily resolved)
to measure integrated disk fluxes, both continuum and molecular lines
Bν(T )κν Mdust
• Disk dust mass: F =
ν
+ assumption d2
on gas-to-dust-ratio=100 (ISM):
=> total disk mass(Sub)millimeter
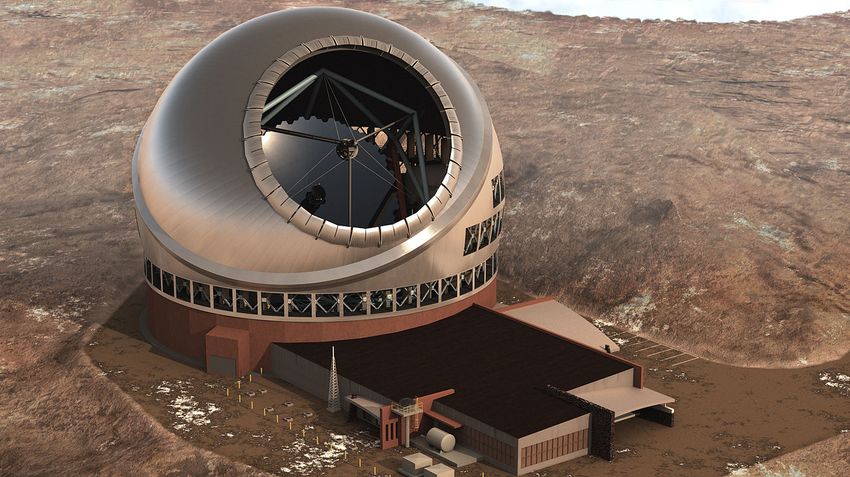
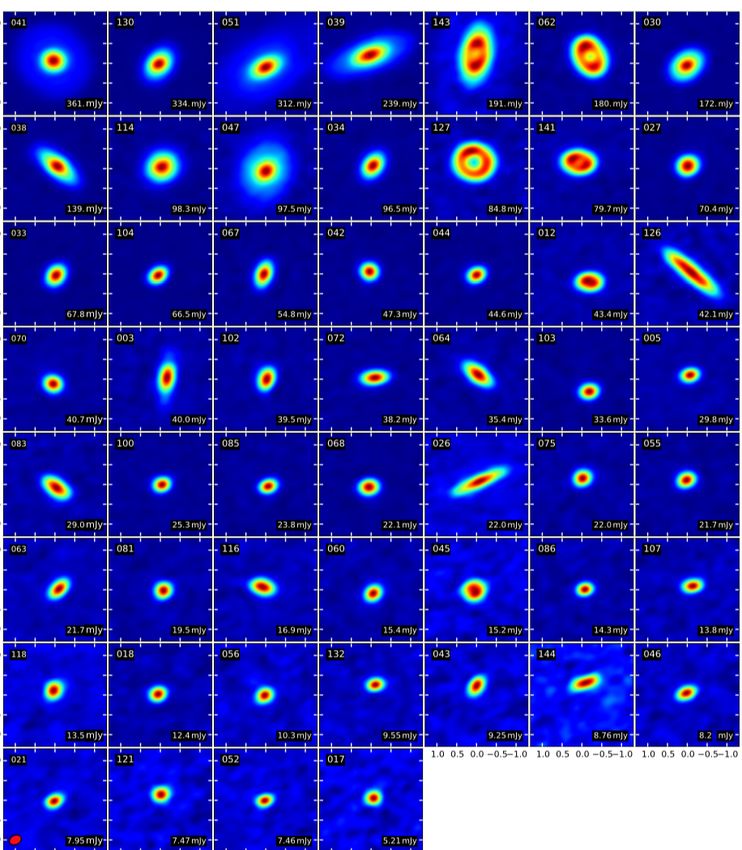
Low-resolution disk snapshot surveys with ALMA at ~0.8-1.3mm:
continuum + CO isotopologues (12CO, 13CO, C18O) integrated fluxes
and derive dust and gas masses Upper Sco
Lupus
Ophiuchus
Ansdell et al. 2016
Survey: all Class II disks within a star forming Cieza et al. 2018
region for statistical study of disk properties Barenfeld et al. 2016(Sub)millimeter
Disk masses in Lupus disk survey (2 Myr old region)
10 MEarth
1 MEarth
10 MJup
1 MJup
Sources =================================>
• Majority of disks has disk dissipation?
• At least half of the disks unresolved:(Sub)millimeter
Compare disk dust masses in different clusters with ages
{ 1-3 Myr
/ 3-5 Myr
/ 5-10 Myr
Dust mass declines with age!
Ansdell et al. 2017(Sub)millimeter
Embedded disks much more massive
>1 Myr(Sub)millimeter
Using CO isotopologues to derive gas mass:
Take into account dissociation, freeze-out, chemistry, temperature, optical depth
CO photodissociated
CO frozen out
e.g. Bruderer 2013
Miotello et al. 2016
=> need physical-chemical models to quantify CO: e.g. DALI, ProDiMo(Sub)millimeter vs IR
CI and CII observations
suggest either carbon-depletion
or gas-poor disks
FIR HD observations suggest CO/H2(Sub)millimeter
Chemistry: complex molecules => building blocks of life?
Complex organic molecules in disks so far: H2CO (formaldehyde), CH3OH (methanol),
CH3CN (acetonitrile), CH3OCHO (methyl formate), etc.
(hard to localize/quantify)
Oberg et al. 2011, 2015
Walsh et al. 2014, 2016
Lee et al. 2019
CO snowline through N2H+?
Chemistry: N2H+ can only form
efficiently when CO is frozen out
=> cloud tracer snowlike
Detailed physical-chemical modeling:
CO snowline not that simple for disks
=> vertical temperature gradient produces a CO ‘snow surface’ Qi et al. 2013
Van t Hoff et al. 2017Centimeter and beyond
What happens at longer
wavelengths?
Centimeter-sized grains?
Is grain size ~ 3 λ?
Emission at longer wavelengths:
JVLA (New Mexico): 6mm - 410 cm & ATCA (Australia): 3mm-27 cm
VLA ATCACentimeter and beyond
Measured fluxes of disks at
centimeter-wavelengths:
Not continuing steep slope with
α~2.5 from flux relation
α
Fν ∼ ν
Additional component with
slope αCentimeter and beyond Future: ALMA-lowfrequency, ngVLA and/or SKA resolve free-free emission and investigate origin: Stellar surface? Centimetre grains? Disk wind?
Future facilities
                                                                    TMT
                                    E-ELT                      λ=0.3-28 μm
        JWST
                                 λ=0.3-14 μm             Planned first light: ~2027(?)
     λ=0.5-28 μm
                           Planned first light: ~2024
 Planned launch ~2021

       SPICA
    λ=12-230 μm                      SKA                              ngVLA
Planned launch: ~2032           λ=3-600 cm                        λ=0.3-20 cm
                        Planned first light ~2025-2030    Planned first light ~2025-2030
Summary
• Disks emit radiation anywhere between UV and centimetre
wavelengths, originating from different parts of the disk,
tracing different physical processes
• Unresolved measurements still provide a lot of useful
information about the physical structure of the disk.
• Disk masses are fundamental for many processes but their
values remain highly uncertain
• Future facilities in infrared and millimeter/centimeter
wavelengths will provide many more opportunities of detailed
studies of disksQuestions?
You can also read