Ohio Economic Profile Sandusky County - Ohio Department of Job and Family Services Office of Workforce Development July 2021
←
→
Page content transcription
If your browser does not render page correctly, please read the page content below
Ohio Economic Profile
    Sandusky County

Ohio Department of Job and Family Services
     Office of Workforce Development

                July 2021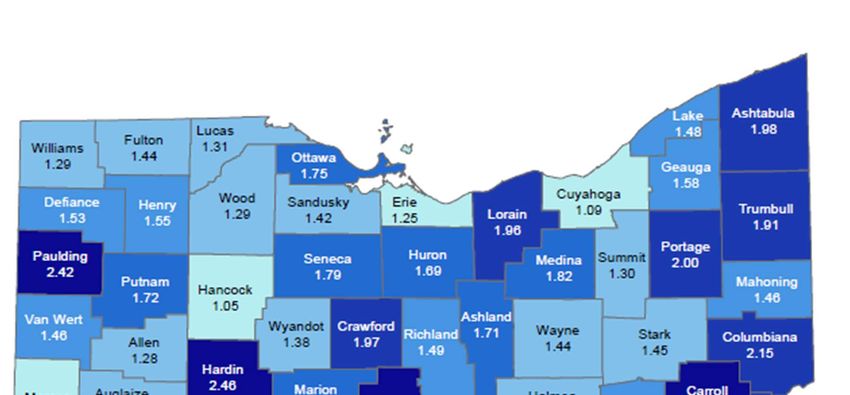
Ohio Economic Profile                                                                  Sandusky County

1. Employment Percent by Industry
The table below shows how jobs are distributed throughout the county by industry. The higher the
percentage, the more workers there are in the industry. Multiple years are shown to demonstrate how
employment in the industries may have shifted over time. However, percent change across years does not
necessarily indicate growth or decline in employment by industry.

1a. Employment Percent by Industry
                                                         Percent Annual Employment in Industry
 Industry Name                                              2004          2010          2019
 Manufacturing                                             38.8%         35.4%         40.2%
 Health Care and Social Assistance                         12.0%         14.5%         12.1%
 Retail Trade                                              10.0%          9.9%          8.4%
 Educational Services                                       9.2%          8.0%          7.3%
 Accommodation and Food Services                            5.0%          5.9%          6.7%
 Construction                                               4.3%          3.2%          4.0%
 Transportation and Warehousing                             1.5%          2.2%          3.0%
 Administrative and Support Services                        4.0%          4.6%          2.7%
 Other Services (except Public Administration)              3.0%          2.9%          2.6%
 Public Administration                                      2.2%          2.8%          2.5%
 Wholesale Trade                                            2.1%          2.1%          2.3%
 Finance and Insurance                                      1.8%          1.8%          2.0%
 Professional, Scientific, and Technical Services           1.2%          1.5%          1.4%
 Real Estate and Rental and Leasing                         1.1%          1.3%          1.4%
 Management of Companies and Enterprises                    0.7%          0.8%          1.0%
 Arts, Entertainment, and Recreation                        1.2%          1.3%          0.9%
 Information                                                1.0%          0.7%          0.6%
 Utilities                                                  0.4%          0.5%          0.5%
 Agriculture, Forestry, Fishing and Hunting                 0.5%          0.5%          0.3%
 Mining, Quarrying, and Oil and Gas Extraction               N/A*           0.1%          N/A*
Source: U.S. Census Bureau, Quarterly Workforce Indicators, excludes federal government.
*Data non-disclosable as it does not meet U.S. Census Bureau publication standards. Columns may not sum to 100
percent due to both U.S. Census Bureau methodology and the effects of rounding. The difference between summed
percentages (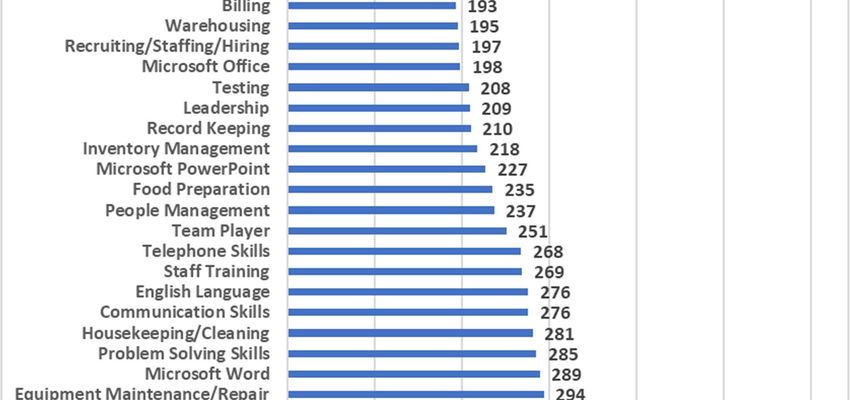
Ohio Economic Profile                                                                               Sandusky County

2a. Employment Trends–Manufacturing, Health Care and Social Assistance, and Retail Trade

                               45,000

                               40,000

                               35,000

                               30,000

                               25,000

                               20,000

                               15,000

                               10,000

                                 5,000

                                     0
                                           2010     2011     2012     2013     2014     2015     2016     2017     2018     2019
         Manufacturing                    32,855    33,426   33,566   33,105   34,032   35,883   38,131   38,410   37,596   36,900
         Health Care and Social Assistance 13,444   13,634   13,353   13,177   13,009   11,844   11,639   11,370   11,397   11,066
         Retail Trade                      9,236    9,250    8,829    8,806    8,745    8,494    8,466    8,161    8,051    7,676

Source: U.S. Census Bureau, Quarterly Workforce Indicators, excludes federal government.

2b. Wage Trends–Manufacturing, Health Care and Social Assistance, and Retail Trade

                               $5,000
                               $4,500
                               $4,000
                               $3,500
                               $3,000
                               $2,500
                               $2,000
                               $1,500
                               $1,000
                                 $500
                                    $0
                                           2010     2011     2012     2013     2014     2015     2016     2017     2018     2019
         Manufacturing                    $3,843    $3,748   $3,822   $4,014   $4,118   $4,196   $4,206   $4,310   $4,329   $4,453
         Health Care and Social Assistance $2,745   $2,715   $2,768   $2,815   $2,827   $2,869   $2,874   $2,977   $3,054   $3,122
         Retail Trade                     $2,036    $2,045   $2,122   $2,166   $2,185   $2,237   $2,279   $2,339   $2,406   $2,459

Source: U.S. Census Bureau, Quarterly Workforce Indicators, excludes federal government.

The following three charts compare the percentage of employment in firm size between the county and
Ohio. Tables comparing firms with 0-49 employees (small firms), 50-499 employees (medium firms), and,
500+ employees (large firms) are shown. When a large firm dominates an area, downturns in that industry
will have a greater impact on a county than when employment is dispersed among many small or mid-size
firms.

                                                               2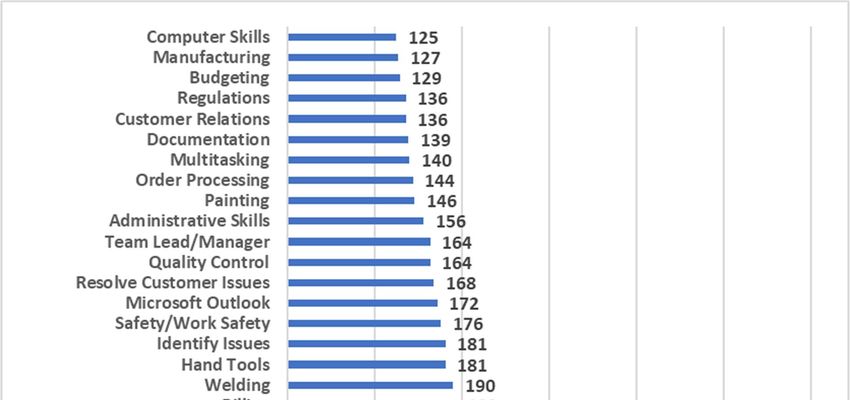
Ohio Economic Profile                                                                     Sandusky County

2c. Percent of Employment in Small Firms

                                       Ohio Small (0-49)        Sandusky Small (0-49)

 35.0%
 30.0%
 25.0%
 20.0%
 15.0%
 10.0%
  5.0%
  0.0%
         2001 2002 2003 2004 2005 2006 2007 2008 2009 2010 2011 2012 2013 2014 2015 2016 2017 2018 2019

Source: U.S. Census Bureau, Quarterly Workforce Indicators, private ownership only.

2d. Percent of Employment in Medium Firms
                                  Ohio Medium (50-499)          Sandusky Medium (50-499)

 35.0%
 30.0%
 25.0%
 20.0%
 15.0%
 10.0%
  5.0%
  0.0%
         2001 2002 2003 2004 2005 2006 2007 2008 2009 2010 2011 2012 2013 2014 2015 2016 2017 2018 2019

Source: U.S. Census Bureau, Quarterly Workforce Indicators, private ownership only.

2e. Percent of Employment in Large Firms
                                      Ohio Large (500+)         Sandusky Large (500+)

 60.0%

 50.0%

 40.0%

 30.0%

 20.0%

 10.0%

  0.0%
         2001 2002 2003 2004 2005 2006 2007 2008 2009 2010 2011 2012 2013 2014 2015 2016 2017 2018 2019

Source: U.S. Census Bureau, Quarterly Workforce Indicators, private ownership only.

                                                           3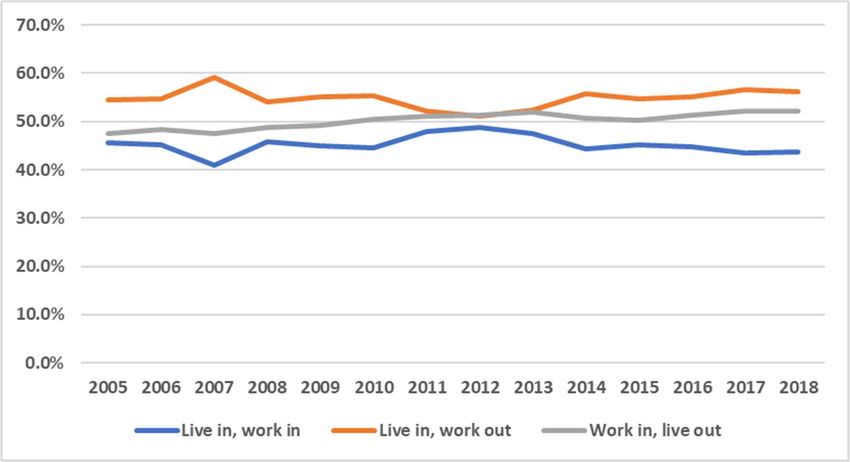
Ohio Economic Profile                                                                    Sandusky County

3. Online Job Postings
The following section provides a count of online job advertisements for the county. It is a snapshot of one
aspect of the labor market and provides a look at labor demand by industry within the county.

3a. Online Job Postings by Industry, 1/1/2020 – 12/31/2020
  Industry                                                                                  Ads
  Retail Trade                                                                              362
  Transportation and Warehousing                                                            309
  Manufacturing                                                                             297
  Administrative and Support and Waste Management and Remediation Services                  290
  Accommodation and Food Services                                                           234
  Health Care and Social Assistance                                                         231
  Finance and Insurance                                                                     106
  Educational Services                                                                       94
  Wholesale Trade                                                                            80
  Other Services (except Public Administration)                                              71
  Arts, Entertainment, and Recreation                                                        43
  Public Administration                                                                      43
  Real Estate and Rental and Leasing                                                         42
  Construction                                                                               39
  Information                                                                                35
  Professional, Scientific, and Technical Services                                           21
  Management of Companies and Enterprises                                                      1
  Unclassified Establishments                                                               117
  Total                                                                                   2,415
Source: TalentNeuron, 2021. Job advertisements counted are those posted in OhioMeansJobs.com, Monster, Indeed,
LinkedIn, Career Builder, online newspapers and many others. The use of TalentNeuron reflects a change in
methodology used in previous reports and data should not be compared to earlier reports.

*Excludes job advertisements in unclassified establishments (NAICS 999999) and establishments for which industry
was unavailable.

3b. Top Occupations with the Most Area Online Job Ads, 1/1/2020 – 12/31/2020
 Occupations                                                                      Ads
 Heavy and Tractor-Trailer Truck Drivers                                          574
 First-Line Supervisors of Retail Sales Workers                                   146
 Retail Salespersons                                                              146
 Light Truck or Delivery Services Drivers                                         128
 Registered Nurses                                                                112
 Laborers and Freight, Stock, and Material Movers, Hand                           110
 Stock Clerks- Stockroom, Warehouse, or Storage Yard                               85
 Cashiers                                                                          69
 Customer Service Representatives                                                  63
 First-Line Supervisors of Production and Operating Workers                        61
Source: TalentNeuron, 2021.

                                                        4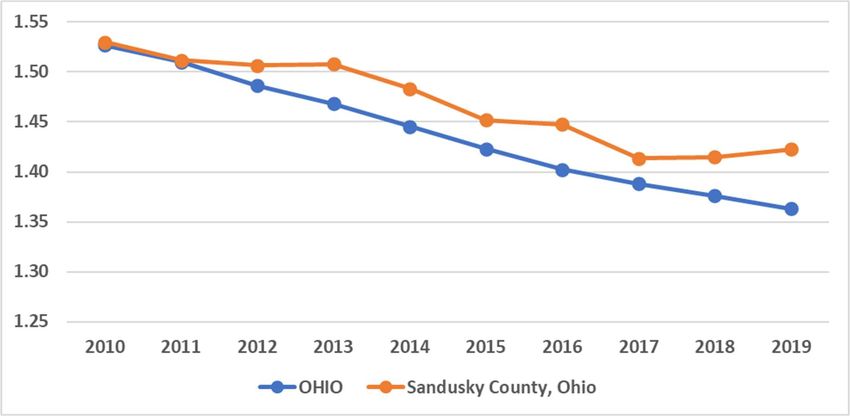
Ohio Economic Profile                                                       Sandusky County

3c. Top Employers with the Most Area Online Job Ads, 1/1/2020 – 12/31/2020
 Employer                               Ads
 Promedica                              255
 Lowe's                                 136
 UberEATS                                95
 PENSKE                                  93
 FedEx                                   86
 Amazon                                  73
 Terra Community College                 72
 Whirlpool                               62
 Volunteers of America                   56
 The Dollar General                      51
Source: TalentNeuron, 2021.

3d. Top Certifications for Online Job Ads, 1/1/2020 – 12/31/2020
 Certifications                                                    Ads
 Commercial Driver's License                                       564
 Driver's License                                                  477
 Class A Commercial Driver’s License                               470
 HAZMAT                                                            152
 Certification in Cardiopulmonary Resuscitation                    118
 Certified Registered Nurse                                        112
 Occupational Safety & Health Administration Certification          79
 Federal legislation                                                70
 Licensed Practical Nurse                                           66
 DOT Medical card                                                   66
Source: TalentNeuron, 2021.

3e. Top Skills for Online Job Ads, 1/1/2020 – 12/31/2020
 Skills                          Ads
 Operations                      795
 Nursing                         458
 Innovation                      372
 Analysis                        283
 Memory care                     265
 Advocacy
 programs                         242
 Social
 determinants of
 health                           242
 Mathematics                      234
 Forklifts                        224
 Depth perception                 224
Source: TalentNeuron, 2021.

                                                         5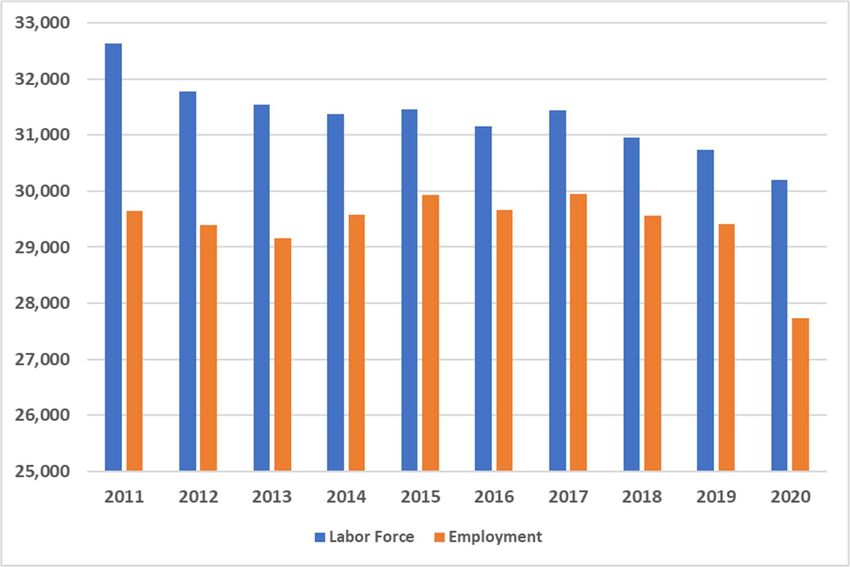
Ohio Economic Profile                                                                             Sandusky County

4. Industry Turnover Rates
The following table looks at industry turnover rates for Ohio and by county. Turnover rates are calculated
from stable employment (employment that lasted one calendar quarter with the same employer) and are an
indicator of job churn. Industries with high churn will have more openings to replace workers than
industries with low churn. It should be noted that this calculation does not include short-term employment
that lasts less than a full quarter.

4a. Industry Turnover Rates, Statewide and County
                                                                   Ohio                           Sandusky County
Industry                                           2019Q1 2019Q2 2019Q3 2019Q4            2019Q1 2019Q2 2019Q3 2019Q4
All NAICS Sectors                                    8.6%       8.1%      9.1%    10.2%     7.7%     7.1%   8.0%    8.1%
Manufacturing                                        5.6%       5.4%      5.3%    6.0%      5.4%     5.0%   4.3%    5.1%
Health Care and Social Assistance                    7.6%       7.9%      7.8%    9.3%      8.1%     8.2%   7.5%    9.2%
Retail Trade                                        11.1%       9.6%      10.5%   11.9%    10.2%     9.1%   9.9%    10.8%
Educational Services                                 6.9%       4.7%      3.3%    7.9%      8.8%     3.2%   3.6%    6.9%
Accommodation and Food Services                     16.5%       16.3%     17.3%   22.5%    17.3%    17.9%   16.3%   20.0%
Construction                                         7.8%       8.4%      14.6%   10.1%     5.6%     6.0%   15.1%   7.9%
Transportation and Warehousing                       9.4%       7.8%      9.6%    10.8%     6.3%     6.7%   8.8%    7.3%
Administrative and Support Services                 17.2%       16.3%     20.0%   19.2%    17.4%    16.3%   23.2%   19.5%
Other Services (except Public Administration)        8.8%       8.8%      9.5%    13.1%     7.8%     8.9%   10.7%   10.9%
Public Administration                                3.5%       4.0%      5.3%    4.5%      4.8%     4.6%   6.0%    5.3%
Wholesale Trade                                      6.1%       6.1%      6.4%    6.6%      9.6%     6.6%   5.1%    6.3%
Finance and Insurance                                4.7%       4.6%      5.0%    4.9%      4.9%     5.5%   5.1%    4.7%
Professional, Scientific, and Technical Services     7.7%       7.2%      7.5%    7.6%      9.9%     9.1%   8.6%    6.6%
Real Estate and Rental and Leasing                   8.1%       8.3%      10.1%   9.7%      6.4%     5.8%   7.3%    6.6%
Management of Companies and Enterprises              5.5%       5.5%      5.7%    5.6%      5.1%     6.3%   5.5%    3.7%
Arts, Entertainment, and Recreation                 11.7%       11.8%     24.1%   19.2%     7.0%     8.8%   35.6%   17.0%
Information                                          6.5%       6.4%      7.1%    8.2%      3.8%     5.8%   7.2%    14.0%
Utilities                                            3.2%       3.3%      3.6%    3.5%      3.2%     3.9%   4.5%    N/A*
Agriculture, Forestry, Fishing and Hunting           9.1%       10.7%     16.9%   8.6%     N/A*      7.7%   34.5%   N/A*
Mining, Quarrying, and Oil and Gas Extraction        8.6%       8.7%      10.3%   8.7%     N/A*     N/A*    N/A*    N/A*
Source: U.S. Census Bureau, Quarterly Workforce Indicators, All ownerships, except federal government.
*Data non-disclosable as it does not meet U.S. Census Bureau publication standards.

                                                            6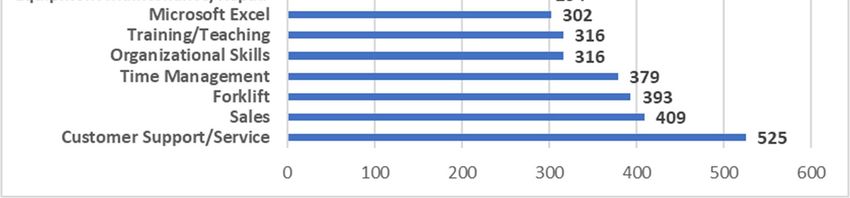
Ohio Economic Profile                                                                     Sandusky County

5. High School Enrollment
The table below shows annual enrollment trends for high school seniors for public, private and charter
schools by fiscal year, where FY 1 represents the school year 2018-2019. Enrollment is the count of
students in October of the school year. School enrollment is important as it has implications for the
workforce as well as the county’s capacity to accommodate its students. Enrollment changes can be
affected by boundary changes or redistricting. Also presented in the table is information regarding the
number of OhioMeansJobs.com K-12 accounts that migrated to regular OMJ accounts.

5a. Number of High School Seniors
                    Number of 12th Graders*                     OMJ K-12
                                                              Accts Migrate
                                                               to Regular
 Fiscal Year Public       Private     Charter     Total**        Acct***
    2015      545           34          0           579
    2016      581           32          0           613              260
    2017      545           37          0           582              295
    2018      533           31          0           564              535
    2019      585           34          0           619              653
    2020      551           29          0           551             1,063
*Source: Ohio Department of Education. All data that represents
Ohio Economic Profile Sandusky County
6a. Number of Resumes with Top 45 Workforce Skills
Source: Monster Government Solutions, April 2021.
8Ohio Economic Profile Sandusky County
6b. Educational Level
4500 4078
4000
3500
3000
2500
2000
1500 1077
842
1000 590 561
500 147 72 120 247 132
3 23 9
0
Source: Monster Government Solutions, April 2021. See “Quick Guide to Understanding the County Economic Health
Reports” for description of educational categories.
7. Educational Attainment
The following table shows the distribution of educational attainment by age group for county residents.
Educational attainment refers to the highest level of education completed.
7a. Educational Attainment by Age Group
High school
9th to 12th graduate Some Graduate or
Less than grade, no (includes college, Associate's Bachelor's professional
Age categories 9th grade diploma equivalency) no degree degree degree degree Total
18 to 24 years 34 579 2,098 1,415 222 290 - 4,638
25 to 34 years 59 391 2,017 1,817 946 913 400 6,543
35 to 44 years 102 385 2,618 1,426 860 1,178 499 7,068
45 to 64 years 270 980 7,216 3,816 1,972 1,536 699 16,489
65 years and over 570 1,193 5,527 1,631 600 810 566 10,897
Source: American Community Survey, 5-year estimates, 2015-2019.
8. Veteran Employment at the Local Level
The following table represents a snapshot of veteran and nonveteran labor force population (i.e., estimate
of the employed and those looking for work); the labor force participation rate (i.e., percent of the total
population participating in the labor force); and the unemployment rate (i.e., percent of the labor force that
is unemployed). Veterans are those who have ever served on active duty in the U.S. Armed Forces,
Reserves, or National Guard.
9Ohio Economic Profile Sandusky County
8a. County Veteran and Nonveteran Employment Estimates
Nonveterans Veterans
Labor Force Population 27,404 1,542
Labor Force Population Rate 79.0% 84.9%
Unemployment Rate 4.2% 0.5%
Source: American Community Survey, 18-64-year-olds, 5-year estimates, 2015-2019.
9. Civilian Labor Force and Commuting Patterns
The next set of tables look at the civilian labor force and commuting patterns of workers in the county. The
civilian labor force is the sum of the employed and unemployed. It is based on civilians 16 years of age and
over who are working or seeking work. It excludes military personnel, persons in institutions, those
studying or keeping house full-time, retirees, and volunteer workers. This is the available workforce, and
used in conjunction with commuting patterns data, one can see where workers in the county live and work.
Commuting information is based on all jobs held. Commuting trends data are also presented to see inflow
and outflow trends of workers, including the top work counties for out-commuters and top home counties
for in-commuters.
9a. Civilian Labor Force and Number Employed
Source: U.S. Department of Labor, Bureau of Labor Statistics, Local Area Unemployment Statistics.
10Ohio Economic Profile Sandusky County
9b. Commuting Patterns, 2005 – 2018
2005 2010 2018
# of workers who live and are emloyed here 14,146 12,411 12,855
# of workers who live here, but work in another county 16,903 15,402 16,531
# of workers who work here, but live in another county 12,777 12,645 13,992
Source: U.S. Census Bureau, OnTheMap. Includes all jobs, 2 nd quarter only.
9c. Commuting Trends
Source: U.S. Census Bureau, OnTheMap. Includes all jobs, 2 nd quarter only.
9d. Commuting Trends for Out-Commuters – Live in County, but Work in Another County, 2018
Top Work Counties for Out-Commuters
Lucas County, OH 2,323
Erie County, OH 2,016
Wood County, OH 1,642
Seneca County, OH 1,456
Ottawa County, OH 1,348
Cuyahoga County, OH 1,219
Huron County, OH 1,170
Lorain County, OH 851
Franklin County, OH 576
Hancock County, OH 440
Source: U.S. Census Bureau, OnTheMap. Includes all jobs, 2 nd quarter only.
11Ohio Economic Profile Sandusky County
9e. Commuting Trends for In-Commuters – Work in County, but Live in Another County, 2018
Top Home Counties for In-Commuters
Seneca County, OH 2,256
Ottawa County, OH 1,642
Erie County, OH 1,428
Huron County, OH 1,232
Wood County, OH 1,138
Lucas County, OH 910
Hancock County, OH 666
Marion County, OH 266
Lorain County, OH 240
Cuyahoga County, OH 228
Source: U.S. Census Bureau, OnTheMap. Includes all jobs, 2 nd quarter only.
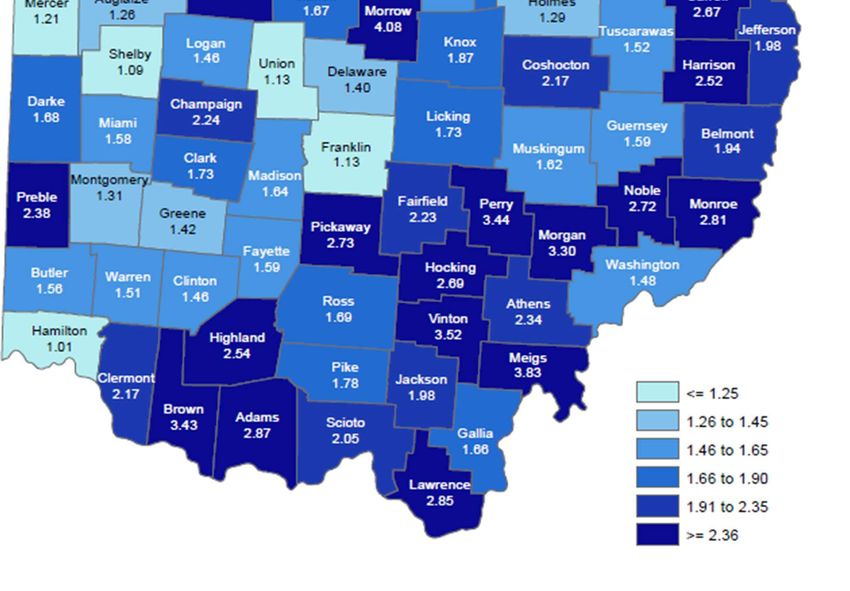
10. Area Population to Jobs
The graph below and map on the next page look at the population to jobs ratio. The prime working-age
population consists of those ages 18 to 64. However, not everyone in the working-age population is
employed – they may be going to school, caring for children or others, or retired. As the population-to-jobs
ratio increases, there are more workers living in the county than there are jobs, meaning there will be more
competition for jobs in that county. Workers in high-ratio counties may be more likely to commute to other
counties for work. A lower population-to-jobs ratio would indicate the county could have a higher ratio of
in-commuters. This will be rare, but a population-to-jobs ratio less than one would indicate there are more
jobs than workers. The graph below compares the county population to jobs ratio to the statewide ratio.
The map shows population to jobs ratio for all counties.
10a. Ohio and County Population (18-64-year-old)* to Jobs** Ratio, 2019
*Source: U.S. Census Bureau.
**Source: U.S. Department of Labor, Bureau of Labor Statistics, Quarterly Census of Employment and Wages.
12Ohio Economic Profile Sandusky County
10b. Ohio County Population* (18-64-year-old) to Jobs** Ratio Map, 2019
*Source: U.S. Census Bureau.
**Source: U.S. Department of Labor, Bureau of Labor Statistics, Quarterly Census of Employment and Wages.
13Ohio Economic Profile Sandusky County
11. Profile of UI Claims
The next set of charts compares demographic characteristics of unemployment insurance claimants and
people in the labor force for the county. These graphs can show if some segments of the labor force are
filing higher proportions of claims. However, certain industries with seasonal work patterns and/or typical
shut down periods, such as construction and manufacturing will have higher proportion of men than
women. Differences between the labor force and UI claimants can be used to target intervention and
training programs.
11a. Gender, UI Claims vs Labor Force, 2020
56.0%
54.2%
54.0% 52.9%
52.0%
50.0%
48.0% 47.1%
45.7%
46.0%
44.0%
42.0%
40.0%
UI Claims Labor Force
Male Female
Source: Ohio Bureau of Labor Market Information.
11b. Age Distribution, UI Claims vs Labor Force, 2020
30.0%
24.9%
25.0% 23.8%
21.4%
20.3% 19.9% 20.0%
20.0% 18.4%
17.2%
15.0%
9.3% 9.5%
10.0%
4.9% 5.5%
4.4%
5.0%
0.7%
0.0%
Age 16-19 Age 20-24 Age 25-34 Age 35-44 Age 45-54 Age 55-64 Age 65 and
Older
UI Claims Labor Force
Source: Ohio Bureau of Labor Market Information.
14Ohio Economic Profile Sandusky County
11c. Race, UI Claims vs Labor Force, 2020
100.0% 93.1%
90.0% 85.3%
80.0%
70.0%
60.0%
50.0%
40.0%
30.0%
20.0% 12.0%
6.5% 8.9%
10.0% 2.9% 0.5% 0.3% 0.5% 0.2%
0.0%
White Black Asian or Pacific Amer. Indian or Hispanic or Latino
Islander Alaska Native.
UI Claims Labor Force
Source: Ohio Bureau of Labor Market Information.
11d. UI Claims by Industry, 2020
Unclassified/Not Coded* 641
Manufacturing 234
Construction 124
Health Care and Social Assistance 66
Accommodation and Food Services 62
Administrative and Support and… 62
Retail Trade 56
Transportation & Warehousing 26
Professional, Scientific and Technical… 18
Arts, Entertainment, and Recreation 18
Other Services (except Public… 17
Wholesale Trade 15
Educational Services 14
Agriculture, Forestry, Fishing and… 7
Real Estate and Rental and Leasing 6
Finance and Insurance 6
Management of Companies and… 5
Information 5
Mining, Quarrying, and Oil and Gas… 3
Public Administration 3
Utilities 1
0 100 200 300 400 500 600 700
Source: Ohio Bureau of Labor Market Information.
*Unclassified/Not Coded industries coded as NAICS ‘999999’ or claims with an unspecified employer.
15Ohio Dept. of Job and Family Services
Office of Workforce Development
P.O. Box 1618
Columbus, OH 43216
Bureau of Labor Market Information
Business Principles for Workforce Development
• Partner with the workforce and economic development community.
• Develop and deploy new information solution tools and systems for the workforce and
economic development community.
• Provide products and services that are customer- and demand-driven.
• Be known as an important and reliable source for information solutions that support
workforce development goals and outcomes.
Acknowledgments: The Office of Workforce Development produced this report under the
direction of Bureau Chief Coretta Pettway. For further information, visit OhioLMI.com or
call the Ohio Bureau of Labor Market Information at 1-888-296-7541 option 6, or (614)
752-9494.
Mike DeWine, Governor
Jon Husted, Lt. Governor
State of Ohio
Ohio.gov
Matt Damschroder, Interim Director
Ohio Department of Job and Family Services
jfs.ohio.gov
Office of Workforce Development
jfs.ohio.gov/owd/
Bureau of Labor Market Information
OhioLMl.com
This institution is an equal opportunity provider and employer.
A proud partner of the American Job Center network.
This workforce product was funded by a grant awarded by the U.S. Department of Labor's Employment and Training Administration. The product
was created by the recipient and does not necessarily reflect the official position of the U.S. Department of Labor. The Department of Labor
makes no guarantees, warranties, or assurances of any kind, express or implied, with respect to such information, including any information on
linked sites and including, but not limited to, accuracy of the information or its completeness, timeliness, usefulness, adequacy, continued
availability, or ownership. This product is copyrighted by the institution that created it. Internal use by an organization and/or personal use by
and individual for non-commercial purposes is permissible. All other uses require the prior authorization of the copyright owner.You can also read