Oilfield Services Quarterly Update | Q1 2022 - MNP

 
CONTINUE READING
Oilfield Services Quarterly Update | Q1 2022 - MNP
Oilfield Services
Quarterly Update | Q1 2022

                             MNPCF.ca
Oilfield Services Quarterly Update | Q1 2022 - MNP
Market Update
Articles - Canada

Canadian Government Approves $12 Billion Bay du Nord Offshore Project1
April 6, 2022: The Canadian government approved Norwegian energy producer Equinor ASA’s proposed $12 billion
offshore oil project off the coast of Newfoundland & Labrador following the results of an environmental
assessment that concluded there would be no significant adverse effects resulting from the project.
• The Bay du Nord project would see a floating platform built about 500km off of the Newfoundland coast, with
  extraction planned to begin in 2025.
• Bay du Nord would be Canada’s first remote deep-water project, operating at depths of around 4,000ft.
• The project is estimated to produce approximately 300 million barrels of crude oil throughout its lifespan.
• Equinor has since reported that this project will be included in federal emission requirements, and that this
  project has the potential to produce the lowest carbon emissions of any major Canadian extraction project.

Suncor Strengthens Its Focus on Hydrogen & Renewable Fuels2
April 5, 2022: Suncor Energy announced it will be shifting its focus and future energy transition plans away from
wind and solar, in favour of increasing investment in hydrogen and renewable fuel projects. Suncor reports that this
strategic direction will be instrumental in reaching net-zero goals, which Suncor hopes to achieve by 2050.
Currently, Suncor operates 8 wind projects across 3 Canadian Provinces, generating enough electricity to power
approximately 53,000 homes. While Suncor does not operate any solar projects, it was developing plans for a
number of solar opportunities, including a proposal for the Forty Mile Solar Power Project.

Suncor joins numerous North American industry peers in adopting carbon capture technology, hydrogen projects,
and low carbon fuels in an effort to decarbonise. In May 2021, Suncor and ATCO announced a partnership with the
goal to develop a hydrogen production facility capable of producing 300,000 tonnes of hydrogen annually, while
utilizing carbon capture technology to capture 90% of facility emissions.

Canada Offering To Increase Oil & Gas Exports To European Countries3
March 24, 2022: In a meeting at the International Energy Agency in Paris, Canada’s Natural Resource Minister
Jonathan Wilkinson went on the record to express Canada’s ability to increase oil exports and begin liquid natural
gas exports to European nations. This comes in response to a number of sanctions against Russia and a desire for
the EU to eliminate its dependence on Russian energy products.
This is a positive development for both the Canadian energy industry and for European countries in the short-term,
offering European nations access to ethical and reliably sourced oil & gas. Canadian oil & gas could be instrumental
in reducing European countries dependence on Russian energy. In turn, increasing output will help spur economic
development within the Canadian oil & gas sector and the overall economy, while accelerating economic recovery
across the country.
Wilkinson estimated that the Canadian energy sector could increase oil & gas exports by up to 300,000 barrels per
day by the end of 2022, an increase of 200,000 barrels of oil, and 100,000 barrels of LNG.

Source: 1) Reuters – Canada approves $12b Bay du Nord offshore oil project
        2) Upstream/Suncor – Suncor Energy Strengthens Its Focus on Hydrogen and Renewable Fuels for Energy Expansion
        3) Reuters – Canada says it can boost oil, gas exports to help replace lost Russian supply                      Page 2
Oilfield Services Quarterly Update | Q1 2022 - MNP
Market Update
Articles - International

US Refiners Set For Strong Start to 2022 As Fuel Prices Surge Worldwide1
April 24, 2022: US based oil refiners are anticipating strong Q1 2022 earnings as margins on refined oil products
have widened due to tightening supply and surging demand for oil. Demand for refined oil products like jet fuel,
gasoline, and heating oil have eclipsed pre-pandemic levels while refining capacity has not risen in tandem due to
refineries being shut down during the pandemic.

Analysts are expecting that the average earnings-per-share of seven large US based refining companies to reach
$0.61 in Q1 2022, up from a loss of $1.32 in Q1 2021.

Profit margins are continuing to grow, even as margins entering 2022 were at near record levels. Most notably, the
heating oil crack spread reached $41 in March 2022, an increase of nearly $20 over the past five-year average
spread.

US To Resume Oil & Gas Drilling on Federal Land2
April 6, 2022: In response to surging energy prices across the United States due to a number of factors, US
President Joe Biden announced the resumption of previously cancelled plans for developing oil & gas drilling
operations on federal land.
In total, 144,000 acres of federal land will be made available to oil & gas drilling companies. This is expected to
offer some much-needed relief to US consumers in the form of lower gas and energy prices.

OPEC to Stick With Planned Oil Output Hike Despite Requests For Increases3
March 31, 2022: OPEC announced that it will maintain its current strategy concerning increasing oil output starting
May 1, 2022.
OPEC plans to increase daily output by a modest 432,000 barrels a day, which is much lower than what many of its
top customers have called for in response to spiking energy prices which have nearly surpassed all-time highs
across the globe.
OPEC has increased output targets by 400,000 barrels a day each month since April 2020 following their
unprecedented supply cuts. These cuts amounted to approximately 10 million barrels a day during April 2020 in
response to cratering energy markets in the early months of the COVID-19 pandemic.
OPEC officials defended the modest increase, noting that their decisions were focused on stabilizing energy prices
from other geopolitical factors and that their focus will not be rooted in politics, rather the “common good” of the
global energy industry.

Source: 1) Reuters - U.S Refiners Set For Strong Start to 2022 As Fuel Prices Surge Worldwide
        2) Reuters/BOE Report – US to resume oil, gas drilling on public land despite Biden campaign pledge
        3) CNBC - OPEC+ sticks to modest oil output hike as US considers unprecedented release of reserves        Page 3
Oilfield Services Quarterly Update | Q1 2022 - MNP
Market Update
Alberta Oil Patch

                                                                   WTI Versus WCS
                                                                                                                                                     Q1
                  $120

                  $100

                  $80
  $US/bbl

                  $60

                  $40

                  $20

                   $0

                                                                 WCS               WTI               Spread

                                      Average Barrels of Production Per Day in Alberta
                   4000                                                                                                                         90%

                   3750                                                                                                                         75%

                                                                                                                                                          WCS to WTI Discount
Barrels (000's)

                   3500                                                                                                                         60%

                   3250                                                                                                                         45%

                   3000                                                                                                                         30%

                   2750                                                                                                                         15%

                   2500                                                                                                                         0%
                          Sep

                          Sep

                          Sep
                          Oct
                          Nov

                          Apr

                          Oct
                          Nov

                          Apr

                          Oct
                          Nov

                          Apr

                          Oct
                          Nov
                          Dec

                          Feb
                           Jan

                          Mar

                          May

                          Aug

                          Dec

                          Feb
                           Jan

                          Mar

                          May

                          Aug

                          Dec

                          Feb

                          Feb
                           Jan

                          Mar

                          May

                          Aug

                          Dec
                           Jan

                          Mar
                           Jun
                            Jul

                           Jun
                            Jul

                           Jun
                            Jul

                          Q4     Q1   Q2          Q3     Q4       Q1       Q2          Q3     Q4        Q1       Q2          Q3   Q4     Q1

                          2018             2019                                 2020                                  2021               2022

                                            Curtailment Limit                 Output                 WCS to WTI % Discount
                                      Curtailment announced                 Curtailment takes effect                  Curtailment ends

Source: Alberta Government https://www.alberta.ca/oil-production-limit.aspx, https://www.alberta.ca/budget.aspx and
https://www.alberta.ca/alberta-petrochemicals-incentive-program.aspx#toc-0                                                                            Page 4
Oilfield Services Quarterly Update | Q1 2022 - MNP
Industry Overview
Private Placement, Public Offerings, And Shelf Registration

                                                    Canadian Oil and Gas E&P - Private Placements, Public Offerings, Shelf
                                                                                Registration
                                                    233                 235

                                                                                                                                                                                         Transaction Volume (# of Deals)
Transaction Value ($CAD Billions)

                                    $60                                                                                                                                            250

                                    $50                                                                                                                                            200
                                                                                           166
                                                                        12.09                                                       153
                                    $40                                                                                                            142
                                                   9.25                 3.75                                        113                                                            150
                                                                 0.95
                                    $30
                                                   12.92                13.38                                                                                                      100
                                    $20                                                   8.19
                                                                                                                             2.29                                     34
                                                   10.33                                  7.44        1.47          2.39            7.32    1.25                                   50
                                    $10                       1.00      19.93     1.00
                                                                                          6.89                               0.75   2.65    1.34   8.84      1.43           0.97
                                                   6.99                                                 1.00
                                      -                                                                                                                                            -
                                                   2016                 2017              2018                      2019            2020           2021              2022
                                              Cenovus Energy Inc.                                     Canadian Natural Resources Limited            Suncor Energy Inc.
                                              Husky Energy Inc.                                       All other players                             Ovintiv Inc.
                                              Transaction volume

                                                                                  Canadian E&P Public Capital Raised
• $1.0 billion of total capital was raised in Q1 2022, a significant decrease from the $5.3 billion raised in Q1 2021.
• Q1 2022 saw less Canadian Exploration and Production (“E&P”) capital raised than Q4 2021 ($1.0 billion vs $1.6
  billion, respectively). The two largest contributors to this quarter’s capital raises was International Petroleum
  Corporation’s public offering of $374 million and Tamarack Valley Energy Ltd.’s private placement of $200 million.

                                                    Canadian Oilfield Services - Private Placements, Public Offerings, Shelf
                                                                                  Registration
Transaction Value ($CAD Millions)

                                    $5,000                                                                                                                                         80

                                                                                                                                                                                         Transaction Volume # of Deals)
                                                                           69
                                                       64

                                                                                                                                    Update
                                    $4,000
                                                                                                                                                                                   60
                                                           150
                                    $3,000                                1,954
                                                                                               34                                                                                  40
                                                                                                               19            110
                                    $2,000                                                                                                                    18
                                                                          589
                                                      2,013
                                                                          600                                                                                                      20
                                    $1,000                        150                    315                         1,723            7
                                                                                                                                                   2,391               1
                                                                          946                                                 92             150                              0
                                                      469
                                          -                                                                                                                                        -
                                                      2016                2017                 2018                  2019            2020          2021               2022
                                              Precision Drilling Corporation                           Shawcor Ltd.                                       CES Energy Solutions Corp.
                                              Trinidad Drilling Ltd.                                   All other players                                  Mullen Group Ltd.
                                              Transaction volume

                                                                                  Canadian OFS Public Capital Raised
• Q1 2022 saw a substantial decrease in capital raised compared to the $58 million capital in Q1 2021.
• The sole contributor identified in this quarter’s capital raise was RocketFrac Services Ltd.’s $100k private
  placement.

Source: Capital IQ. Data as of March 31, 2022.
Note: Data does not contain share buy-backs.                                                                                                                                           Page 5
Oilfield Services Quarterly Update | Q1 2022 - MNP
Industry Overview
M&A Transactions & Performance
                                                            Canada - Oilfield Services - M&A Transactions

                                                                                                                                                                       Transaction Volume (# of Deals)
                                    $1,600                             7                                                                                         8
Transaction Value ($CAD Millions)

                                                                                                                   1,333.7
                                    $1,400    6                                                                                                                  7
                                    $1,200                     5                                                                                                 6
                                                                                           944.9
                                    $1,000           4                                                         4              4              4     4             5
                                     $800                                          3                                                                       3     4
                                     $600                                                            2                                                           3
                                     $400                            214.2                                1                                                      2
                                                                                                                             166.0                       158.4
                                     $200    57.8             45.6                                                                          7.1   12.5           1
                                                    0.8                           2.7                    0.0
                                        $0                                                                                                                       0
                                             Q2     Q3        Q4      Q1          Q2           Q3        Q4          Q1       Q2            Q3    Q4      Q1

                                                    2019                                2020                                         2021                2022

                                                                            Transaction value              Transaction volume

                                                                               Transaction Highlights
• The Canadian Oilfield Services market saw transaction value increase, growing to $158 million compared to $13
  million in Q4 2021. Transaction volume decreased slightly, with 3 transactions in Q1 2022.
• The majority of disclosed transaction value for the quarter came from Macro Enterprises Inc. going private via share
  buybacks. The size of this transaction was $131 million.

                                                           United States - Oilfield Services - M&A Transactions
                                             24
                                      $25           23                                                                                                           25

                                                                                                                                                                       Transaction Volume (# of Deals)
Transaction Value ($CAD Billions)

                                                               19     19
                                      $20                                                                                                   24    17             20
                                                                                               15
                                                                                                         14
                                      $15                                                                                                                 12     15
                                                                                                                     11       11
                                                                                  10
                                      $10    22.0                                                                                                                10
                                                    7.7
                                                                                                                                            6.0
                                       $5                                                                                                                        5
                                                                      1.4                      0.8       0.9                                      1.2     1.1
                                                              0.1                 0.3                               0.2      0.0
                                       $0                                                                                                                        0
                                             Q2     Q3        Q4      Q1          Q2           Q3        Q4         Q1       Q2             Q3    Q4      Q1

                                                    2019                                2020                                       2021                  2022

                                                                            Transaction value              Transaction volume

                                                                               Transaction Highlights
• Both transaction value and volume decreased in the United States in Q1 2022 with 12 transactions and a total value
  of $1.1 billion. The previous quarter had 17 deals and a total value of $1.2 billion.
• The largest contributor to this quarters’ transaction value was Enerflex Ltd.’s $1.0 billion acquisition of Exterran
  Corporation in January 2022.

Source: Capital IQ. Data as of March 31, 2022.
Notes: Transaction data may not include all OFS related transactions due to database limitations.
       Oilfield services transactions include companies with head offices in other countries                                                                         Page 6
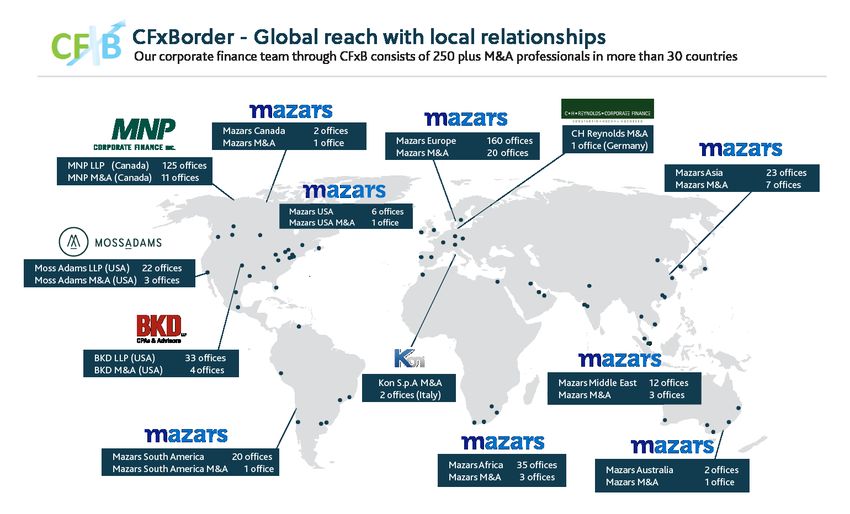
Oilfield Services Quarterly Update | Q1 2022 - MNP
Industry Overview
M&A Transactions & Performance

                                                  Canada - Oil and Gas Exploration and Production - M&A Transactions
                                    $30                                                                                 35                                    40
                                                                                                    19
Transaction Value ($CAD Billions)

                                                                                                                                                                     Transaction Volume (# of Deals)
                                    $25    29                                                                  30                                             35
                                                                                                                                                              30
                                    $20                                                     22
                                                             19                                                                        19                     25
                                    $15              16             15        16                                                                              20
                                                                                                                                               14
                                                                                                                                                       12
                                    $10
                                                                                                   25.48      22.97                                           15

                                           3.69
                                                                                                                                                              10
                                     $5                                                    1.63                         2.48                  2.16
                                                    0.25     1.01   0.28     0.37                                                     0.90            0.95    5
                                     $0                                                                                                                       -
                                           Q2        Q3      Q4     Q1        Q2            Q3      Q4         Q1       Q2            Q3      Q4       Q1

                                                    2019                            2020                                       2021                   2022

                                                                           Transaction value               Transaction volume

                                           United States - Oil and Gas Exploration and Production - M&A Transactions
                                                      73                                                                                                      80

                                                                                                                                                                     Transaction Volume (# of Deals)
                                    $100    60
Transaction Value ($CAD Billions)

                                                                                                                                               59             70
                                    $80                                                                                  52            53
                                                                                            50      50                                                        60
                                                                                                                46                                     43
                                                                               42                                                                             50
                                    $60
                                           93.26                                                                                                              40
                                                                     26                            36.20
                                    $40                                                    31.55                                                              30
                                                               13                                                      26.92
                                                                                                                                      19.80
                                                                                                               13.51                                  13.49   20
                                    $20              10.59                                                                                    10.36
                                                             7.01   1.13      1.87                                                                            10
                                     $0                                                                                                                       -
                                            Q2        Q3      Q4     Q1        Q2           Q3      Q4          Q1      Q2             Q3      Q4      Q1

                                                     2019                            2020                                      2021                   2022

                                                                           Transaction value               Transaction volume

                                                                              Transaction Highlights
Canadian E&P transaction value dropped to $1.0 billion this quarter, compared to $2.2 billion in Q4 2021. Transaction
volume decreased slightly to 12 total transactions from 14 last quarter. Notable deals include:
• Vermilion Energy Inc.’s acquisition of Leucrotta Exploration Inc. for $541 million. Leucrotta is a Montney-focused oil
  and natural gas exploration and development company with lands located in the Mica area of Northeast British
  Columbia and Northwest Alberta.
• USD Partners LP acquisition of Hardisty South Terminal’s assets located in Alberta for $135 million.
US E&P transaction value increased in Q1 2022 to $13.5 billion compared to $10.4 billion in Q4 2021. This quarter saw
43 deals, a quarterly decrease for the first time since Q1 2021. The largest US E&P transaction for the quarter was:
• Whiting Petroleum Corporation's acquisition of Oasis Petroleum Inc. for $4.5 billion in March 2022 via a reverse
  merger transaction. Oasis Petroleum is an exploration and production company, focusing on the acquisition and
  development of onshore unconventional oil and natural gas resources in the United States.
Source: Capital IQ. Data as of March 31, 2022.
Notes: Transaction data may not include all OFS related transactions due to database limitations.
       Oilfield services transactions include companies with head offices in other countries                                                                       Page 7
Oilfield Services Quarterly Update | Q1 2022 - MNP
Pipeline Update
Press Releases

                                           Trans Mountain Expansion Project Celebrates 50%
                                           Construction Completion
                                           As of March 2022, the Trans Mountain Expansion Project announced that it has
                                           surpassed 50% completion of the pipeline expansion project from Edmonton to
                                           Burnaby. This amounts to over 400km of installed pipe, 500km of cleared right-of-
                                           way, and 32 trenchless crossings.
                                           The expansion is expected to triple the current capacity of the pipeline to over 800k
                                           barrels of crude oil per day, increasing Canada’s access to foreign markets. With the
                                           project having recently surpassed the halfway mark, the current target completion
                                           date is late 2023 as reported in February of 2022 by representatives from the
                                           pipeline.

                                           Ottawa Files Court Brief Supporting Enbridge In Line 5
                                           Dispute With Michigan
                                           On February 4th, 2022, the Canadian federal government urged a Michigan judge to
                                           allow Enbridge’s Line 5 pipeline to remain operational throughout negotiations under
                                           the terms of a 1977 treaty which prevents interruptions of any cross-border flow of oil
                                           & gas between Canada and the United States. Officials from both countries are
                                           expected to continue talks with the goal of reaching a mutual agreement. Canadian
                                           officials are fighting to ensure the pipeline remains active while talks continue as the
                                           treaty specifies exclusive federal regulatory authority over pipeline safety. This
                                           dispute has been ongoing since late 2020, when Michigan's governor ordered a full
                                           shutdown of Line 5, citing risk of an ecological disaster in a major regional
                                           watershed.

                                           Pembina Peace Pipeline Expansion Updates
                                           On February 24, 2022, Pembina released their 2021 Q4 results and provided
                                           guidance in addition to a number of project updates. Included in the report was a
                                           number of updates on the Peace pipeline expansion project. With the project well
                                           underway, and on track to have the VII and IX portion of the expansion operational in
                                           mid-late 2022, Pembina provided a revised capital cost estimate for both projects. It
                                           was reported that the VII expansion phase will come in $110 million under budget,
                                           while the IX expansion is expected to remain on budget.

                                           The Peace pipeline is a liquid natural gas and condensate pipeline which operates
                                           between northern BC and Alberta.

Source: Company websites
        Global News - Ottawa files court brief supporting Enbridge in Line 5 dispute with Michigan                          Page 8
Oilfield Services Quarterly Update | Q1 2022 - MNP
Select Recent M&A Transactions

                                                                  • Mincon Group plc engages in the design,
                                    Closed        Jan 1, 2022       manufacture, sale, and servicing of rock drilling tools
                                                                    and associated products in Ireland, the Americas,
                                    TEV           Not disclosed     Oceania, Europe, the Middle East, and Africa.
    has acquired
                                    TEV/EBITDA    Not disclosed   • Spartan Drill Tools manufactures drill pipe and
                                                                    accessories for quarrying, mining, and well drilling
                                    TEV/Revenue   Not disclosed     needs.

                                                                  • Cathedral Energy Services Ltd. provides directional
                                    Closed        Feb 10, 2022
                                                                    drilling services to oil and natural gas companies in
                                                                    Western Canada and the United States. It offers
                                    TEV           $20.7MM
    has acquired                                                    horizontal drilling services, directional drilling services,
                                                                    and drilling optimization and well planning services.
                                    TEV/EBITDA    Not disclosed
                                                                  • Discovery Downhole Services Inc. provides mud motor
                                    TEV/Revenue   Not disclosed     technology including drilling motors and a wide range
                                                                    of motor components.

                                                                  • Smart Sand, Inc., an integrated frac sand supply and
                                    Closed        Mar 4, 2022       services company, engages in the excavation,
                                                                    processing, and sale of sands or proppant for use in
                                    TEV           $8.3MM
                                                                    hydraulic fracturing operations in the oil and gas
    has acquired
                                                                    industry in the United States.
                                    TEV/EBITDA    Not disclosed
                                                                  • Hi-Crush Inc. provides proppant and logistics
                                    TEV/Revenue   Not disclosed     services for hydraulic fracturing operations in the
                                                                    United States. The company offers raw frac sand
                                                                    used in the hydraulic fracturing process for oil and
                                                                    natural gas wells.

                                                                  • Vertex Resource Group Ltd. provides environmental
                                    Closed        Apr 25, 2022      and industrial services in Canada and the United
                                                                    States. It operates through two segments,
                                    TEV           $27.6MM           Environmental Services and Environmental
    has acquired                                                    Consulting.
                                    TEV/EBITDA    5.2x
                                                                  • Cordy Oilfield Services Inc. provides energy,
                                    TEV/Revenue   1.0x              municipal, and construction services in Canada. The
                                                                    company operates in two segments, Environmental
                                                                    Services and Heavy Construction.
Source: Capital IQ.
All figures are in $CAD millions.                                                                                        Page 9
Oilfield Services Quarterly Update | Q1 2022 - MNP
Industry Overview
Natural Gas Performance

                                                                                        Natural Gas Prices: Henry Hub vs. AECO
                                                                                                                                                                                                                                                             Q1
                              8

                              7

                              6

                              5
CAD/MMBtu

                          4

                              3

                              2

                              1

                              0

                                                                                                          Henry Hub                                    AECO                           Spread

                                                                                                    Canadian Natural Gas Storage
                                                                                                                                                                                                                                                              Q1
                          30

                          25
Cubic Meters (Millions)

                          20

                          15

                          10

                              5

                          -
                                  Jan-20

                                                                                                          Sep-20

                                                                                                                   Oct-20

                                                                                                                            Nov-20

                                                                                                                                              Jan-21

                                                                                                                                                                                                                      Sep-21

                                                                                                                                                                                                                                                          Jan-22
                                                                                                                                                                                                                               Oct-21

                                                                                                                                                                                                                                        Nov-21
                                                                               Jun-20
                                           Feb-20

                                                             Apr-20

                                                                      May-20

                                                                                        Jul-20

                                                                                                                                     Dec-20

                                                                                                                                                                                           Jun-21
                                                                                                 Aug-20

                                                                                                                                                       Feb-21

                                                                                                                                                                         Apr-21

                                                                                                                                                                                  May-21

                                                                                                                                                                                                    Jul-21

                                                                                                                                                                                                                                                 Dec-21
                                                                                                                                                                                                             Aug-21

                                                                                                                                                                                                                                                                   Feb-22
                                                    Mar-20

                                                                                                                                                                Mar-21

                                                                                                 5 Year Max                    5 Year Min                  Natural Gas Storage

Sources: GLJ Petroleum Consultants Commodity Price Forecasts as at March 31, 2022.
         Canadian Gas Association as at March 31, 2022.                                                                                                                                                                                                        Page 10
Industry Overview
         Rig Count & Land Sales

                                                                 Total Rig Count: Canada Vs. United States
                                                                                                                                                Q1
             1,200                                                                                                                                        90%

                                                                                                                                                                Percentage of Rigs Used for Gas Wells (vs. Oil Wells)
                                                                                                                                                          80%
             1,000
                                                                                                                                                          70%

                    800                                                                                                                                   60%

                                                                                                                                                          50%
Total Rigs

                    600
                                                                                                                                                          40%

                    400                                                                                                                                   30%

                                                                                                                                                          20%
                    200
                                                                                                                                                          10%

                                     0                                                                                                                    0%

                                                          Canada - Percentage of Rigs Used for Gas Wells           Canada       US

                                                        Oil & Gas Land Sales - Alberta, B.C., and Saskatchewan
                                         2,000                                                                                                       $3,000
                                                                             Land sales have experienced
                                                                             delays and postponements due
                                         1,800                               to the COVID-19 pandemic
                                                                                                                                                     $2,500
                                         1,600
         Hectares Sold (Thousands)

                                         1,400
                                                                                                                                                     $2,000
                                         1,200                                                                                                                  Avg$/Ha

                                         1,000                                                                                                       $1,500

                                          800
                                                                                                                                                     $1,000
                                          600

                                          400
                                                                                                                                                     $500
                                          200

                                            0                                                                                                        $-
                                                 2014    2015       2016        2017        2018            2019     2020     2021       2022

                                                         British Columbia                  Saskatchewan                     Alberta
                                                         BC Avg$/Ha                        Sask Avg$/Ha                     AB Avg$/Ha

         Sources: Government of Alberta, B.C., and Saskatchewan; Data as of March 31, 2022.
                  Baker Hughes rig count report as at March 31, 2022                                                                                      Page 11
Public Comparable Analysis
Performance Analysis

   200%                                                   Oilfield Service Group Share Prices
                                                                                                                                188.8%
   175%

   150%

   125%

   100%
                                                                                                                                 61.9%
    75%
                                                                                                                                 43.1%
    50%
                                                                                                                                 36.8%
    25%                                                                                                                          29.3%
                                                                                                                                 25.6%
     0%
                                                                                                                                 15.0%
   -25%

          Oil and Gas Drilling                                      Oil and Gas Field Services     Oil and Gas Machinery and Equipment
          Oil and Gas Storage and Transportation                    Integrated Oilfield Services   Camp Accomodations
          Oil and Gas Software Solutions

                                                  Oilfield Service Group EBITDA Multiples
  40x

  35x

  30x

  25x
                                                                                                                                  14.0x
  20x
                                                                                                                                  13.2x
   15x                                                                                                                            12.2x
                                                                                                                                  11.4x
   10x
                                                                                                                                   9.5x
                                                                                                                                   7.2x
    5x
                                                                                                                                   7.2x
    0x

          Oil and Gas Drilling                                     Oil and Gas Field Services      Oil and Gas Machinery and Equipment
          Oil and Gas Storage and Transportation                   Integrated Oilfield Services    Camp Accomodations
          Oil and Gas Software Solutions

Source: Capital IQ. Data as of March 31, 2022.
Above noted oilfield service peer groups are market capitalization weighted indexes.                                         Page 12
Public Comparable Analysis
Growth, Margins & Multiples

            Median Revenue Growth (LTM)                                                           Median Revenue Growth (NTM)
                                                           28%                                                                                 23%
          Software Solutions -7%                                                                Software Solutions            18%
       Camp Accomodation                            56%                                      Camp Accomodation                2%
Storage and Transportation                          45%                               Storage and Transportation                   7%
 Integrated Oilfield Services                       46%                                Integrated Oilfield Services           35%
 Machinery and Equipment                            1%                                 Machinery and Equipment                41%
                Field Services                      26%                                               Field Services          25%
                       Drilling                     27%                                                       Drilling        36%

                               -20%            0%        20%      40%   60%                                              0%       10%     20%        30%     40%   50%

             Median EBITDA Margin (LTM)                                                          Median EBITDA Margin (NTM)
                                                          17%                                                                                  22%
          Software Solutions            29%                                                       Software Solutions             44%
       Camp Accomodation                17%                                                    Camp Accomodation                 15%
Storage and Transportation              24%                                             Storage and Transportation               24%
 Integrated Oilfield Services           10%                                              Integrated Oilfield Services            20%
 Machinery and Equipment                13%                                              Machinery and Equipment                 17%
                Field Services          11%                                                             Field Services           15%
                       Drilling         17%                                                                    Drilling          20%

                                   0%     5% 10% 15% 20% 25% 30%                                                            0%      10%    20% 30% 40% 50%

                 Median EV/EBITDA (LTM)                                                               Median EV/EBITDA (NTM)
                                                           9.6x                                                                                 7.7x
          Software Solutions            10.7x                                                    Software Solutions            8.6x
       Camp Accomodation                8.0x                                                  Camp Accomodation                6.7x
Storage and Transportation              12.8x                                          Storage and Transportation              11.4x
 Integrated Oilfield Services           10.4x                                           Integrated Oilfield Services           6.1x
 Machinery and Equipment                7.2x                                            Machinery and Equipment                4.9x
                Field Services          8.5x                                                           Field Services          4.5x
                        Drilling        10.8x                                                                 Drilling         11.7x
                                   0x               5x          10x     15x                                               0x              5x           10x         15x

Source: Capital IQ. Data as of March 31, 2022.
Above noted oilfield service peer groups are market capitalization weighted indexes.
LTM refers to last twelve months. NTM refers to next twelve months. Figures above are based on median peer group metrics.                                      Page 13
Public Comparable Analysis
  Trading Multiples & Operating Statistics

( F i gu res i n $CA D Mi l l i on s, except percen tages an d rati os)
                                                                                                L TM Operati n g F i gu res                  N TM Con sen su s Esti mates              Val u ati on
                                                  Mark et           En terpri se                 Rev en u e                   EB ITDA    Rev en u e   EB ITDA        N TM          L TM          L TM
Compan y                                       Capi tal i zati on     Val u e      Rev en u e    Growth         EB ITDA       Margi n    Growth       Margi n     EV/ EB ITDA   EV/ EB ITDA     EV/ REV
Oi l an d Gas Dri l l i n g
Precision Drilling Corporation                      $1,260            $2,385        $987            5.5%          $165         16.7%      34.6%         24.1%        7.4x          14.4x              2.4x
Ensign Energy Services Inc.                          $563             $2,018        $996             6.3%         $191         19.2%      37.0%         23.0%        6.5x           10.6x             2.0x
PHX Energy Services Corp.                            $323              $334         $350            42.0%         $43          12.2%      32.0%         18.1%        4.0x           7.8x              1.0x
Western Energy Services Corp.                         $19              $253         $132            27.0%          $23         17.3%      28.3%         16.6%        9.0x           11.1x             1.9x
AKITA Drilling Ltd.                                  $74               $161         $110            (8.0%)         $9          8.6%       77.6%         14.3%        5.7x           17.0x             1.5x
Stampede Drilling Inc.                               $40                $51          $32           123.4%          $5          16.8%        N/A          N/A         N/A            9.4x              1.6x
Cathedral Energy Services Ltd.                       $79               $98           $63            54.1%          $1           1.3%      143.1%        21.7%        3.0x            NM               1.6x
Medi an                                              $79              $253          $1 32          27. 0%         $23         1 6. 7%     35. 8%       1 9. 9%       6. 1 x        1 0. 8x            1 . 6x
Mean                                                $337              $757          $381           35. 8%         $62         1 3. 2%     58. 8%       1 9. 6%       5. 9x         1 1 . 7x           1 . 7x
Oi l an d Gas F i el d Serv i ces
Mullen Group Ltd.                                   $1,254            $2,000        $1,477          26.9%         $220        14.9%        17.6%        15.1%        7.6x           9.1x          1.4x
Calfrac Well Services Ltd.                           $171              $581         $1,002          42.1%         $56           5.5%      27.9%         10.0%        4.5x          10.5x          0.6x
STEP Energy Services Ltd.                            $191              $393          $536          45.4%          $49           9.2%      39.5%         15.0%        3.5x          7.9x           0.7x
Macro Enterprises Inc.                               $124              $140          $349           32.0%         $42          12.2%       13.6%        12.5%        2.8x          3.3x           0.4x
Wolverine Energy and Infrastructure Inc.              $20              $133           $79          (42.3%)         ($8)        (9.6%)      (5.3%)       20.8%        8.5x           NM            1.7x
Essential Energy Services Ltd.                       $62               $67           $121          26.0%           $7          5.8%       29.9%         11.7%        3.6x          9.5x           0.6x
Vertex Resource Group Ltd.                           $47               $148          $159           17.1%         $23          14.1%      24.8%         15.2%        4.9x          6.6x           0.9x
ENTREC Corporation                                    $3               $251          $180            4.1%         $27          15.1%        N/A          N/A         N/A           9.2x           1.4x
ClearStream Energy Services Inc.                      $7               $324          $389           (0.9%)        $12           3.1%        N/A          N/A         N/A            NM            0.8x
Cordy Oilfield Services Inc.                          $9                $26           $26           59.5%           $5        20.0%         N/A          N/A         N/A           5.0x           1.0x
Medi an                                              $55              $1 99         $265           26. 5%         $25         1 0. 7%     24 . 8%      1 5. 0%       4 . 5x        8. 5x          0. 9x
Mean                                                $1 89             $4 06         $4 32          21 . 0%        $4 3         9. 0%      21 . 1 %     1 4 . 3%      5. 1 x        7. 6x          0. 9x
Oi l an d Gas Mach i n ery an d Equ i pmen t
Enerflex Ltd.                                       $718               $934          $960          (21.1%)        $139        14.5%       82.8%         16.7%        3.2x          6.7x           1.0x
CES Energy Solutions Corp.                          $609              $1,046        $1,196         34.7%          $139         11.6%      30.9%         11.6%        5.8x          7.5x           0.9x
Total Energy Services Inc.                          $333               $503          $432           18.0%          $73         17.0%      40.6%         16.9%        4.9x          6.9x           1.2x
McCoy Global Inc.                                    $27               $23            $33          (15.2%)         $3          9.3%         N/A          N/A         N/A           7.7x           0.7x
Medi an                                             $4 71             $71 8         $696            1.4%          $1 06       1 3. 1 %    4 0. 6%      1 6. 7%       4 . 9x        7. 2x          0. 9x
Mean                                                $4 22             $627          $655            4.1%          $89         1 3. 1 %    51 . 4 %     1 5. 1 %      4 . 6x        7. 2x          0. 9x
In tegrated Oi l f i el d Serv i ces
Trican Well Service Ltd.                             $921               $902        $562           41.7%           $87         15.4%      34.8%         19.6%         6.1x         10.4x              1.6x
Secure Energy Services Inc.                         $1,654             $2,960      $3,766         106.5%          $260          6.9%      (65.1%)      34.9%          6.5x          11.4x             0.8x
CWC Energy Services Corp.                            $99                $145        $103           51.2%           $14         13.9%        NA           N/A          N/A           10.2x             1.4x
High Arctic Energy Services Inc                      $85                 $90         $76          (15.8%)           $3          3.6%      46.5%         13.9%         5.8x           NM               1.2x
Medi an                                             $51 0              $524         $333          4 6. 4 %        $51         1 0. 4 %    34 . 8%      1 9. 6%        6. 1 x       1 0. 4 x           1 . 3x
Mean                                                $690              $1 , 024     $1 , 1 27      4 5. 9%         $91          9. 9%      5. 4 %       22. 8%         6. 1 x       1 0. 7x            1 . 2x
Oi l an d Gas Storage an d Tran sportati on
Enbridge Inc.                               $116,573                 $203,076      $47,071         20.4%        $13,626       28.9%        6.2%        30.7%         13.2x         14.9x          4.3x
TC Energy Corporation                        $69,158                 $125,151       $13,387         3.0%         $9,871       73.7%        9.7%       66.4%          12.8x          12.7x         9.3x
Pembina Pipeline Corporation                 $25,928                 $40,424        $8,627         44.9%         $2,962       34.3%        (1.6%)     42.2%          11.3x          13.6x         4.7x
Keyera Corp.                                 $7,004                   $10,686       $4,985         65.5%          $941         18.9%       7.8%        17.7%         11.2x          11.4x         2.1x
Gibson Energy Inc.                           $3,706                   $5,386        $7,211         46.0%          $416         5.8%        8.7%         5.9%         11.5x          12.9x         0.7x
Tidewater Midstream and Infrastructure Ltd.   $444                     $1,258        $1,698        73.4%          $222         13.1%      (20.2%)      15.9%          6.0x          5.7x          0.7x
Medi an                                     $1 6, 4 66               $25, 555      $7, 91 9        4 5. 5%      $1 , 952      23. 9%       7. 0%      24 . 2%        11.4x         1 2. 8x        3. 2x
Mean                                        $37, 1 36                $64 , 330     $1 3, 830       4 2. 2%      $4 , 673      29. 1 %      1 . 8%     29. 8%         1 1 . 0x      1 1 . 9x       3. 7x
Camp A ccomodati on s
Dexterra Group Inc.                                 $512                  $603      $733           55.6%           $66          9.0%      26.4%          9.7%        6.7x          9.2x               0.8x
Civeo Corporation                                   $416                  $728      $752            12.2%         $130         17.3%       2.3%         15.5%        6.2x          5.7x               1.0x
Black Diamond Group Limited                         $295                  $482      $340           88.8%          $60          17.8%      (11.7%)       22.7%        7.2x          8.0x               1.4x
Medi an                                             $4 1 6                $603      $733           55. 6%         $66         1 7. 3%      2. 3%       1 5. 5%       6. 7x         8. 0x              1 . 0x
Mean                                                $4 08                 $604      $608           52. 2%         $85         1 4 . 7%     5. 7%       1 5. 9%       6. 7x         7. 6x              1.1x
Oi l an d Gas Sof tware Sol u ti on s
Pason Systems Inc.                                  $1,257                $1,103     $207           32.0%          $59         28.6%       36.0%       41.0%         9.6x           18.7x         5.3x
Computer Modelling Group Ltd.                        $431                 $423       $64            (7.0%)        $28         42.9%         6.3%      47.6%          13.0x         15.4x          6.6x
Dawson Geophysical Company                            $69                  $43        $31          (71.3%)        ($19)       (60.9%)        N/A        N/A          N/A             NM           1.4x
Pulse Seismic Inc.                                   $118                  $121      $49           333.1%         $43          86.7%      (53.2%)      69.6%         7.6x           2.8x          2.5x
ION Geophysical Corporation                           $32                 $222       $133          (23.6%)         $37         27.6%       30.4%       26.8%         4.8x            6.1x         1.7x
Medi an                                             $1 1 8                $222       $64           ( 7. 0% )      $37         28. 6%      1 8. 4 %    4 4 . 3%       8. 6x         1 0. 7x        2. 5x
Mean                                                $381                  $382       $97           52. 6%         $29         25. 0%       4 . 9%     4 6. 3%        8. 7x         1 0. 7x        3. 5x

In order to derive more accurate valuation multiples, MNP Corporate Finance Inc. has eliminated results which skew
the averages excessively.

  Source: Capital IQ. Data as of March 31, 2022.
  LTM refers to last twelve months. NTM refers to next twelve months.                                                                                                                         Page 14
About Us

MNP Corporate Finance (MNPCF) has a dedicated team of over 100            Recently Closed Deals
M&A and due diligence professionals across Canada. MNPCF
works with clients in virtually all industries as they prepare, plan           (National)
and execute transactions.

Our typical transactions range in value between $3 million and
$300 million.

            Local and International Reach
MNP is a participating firm within Praxity, a unique global alliance of
independent accounting/advisory firms created to answer global
business needs. As a member of Praxity, we are able to offer access
to corporate finance, accounting and tax advisory services
worldwide. We are also affiliated with Corporate Finance Cross
Border, which consists of 250+ M&A professionals in more than 30
countries.

                              Services
           • Divestitures              • Due Diligence
           • Acquisitions              • Transaction Advisory
           • Debt Financing              Services

                                                                                            Page 15
About Us

                       Deal Experience                                Recently Closed Deals
                                                                           (National)
Since our inception, our team has advised on hundreds of
transactions, in a wide range of industries with diverse enterprise
values. In the past eight years alone we have completed over 200
transactions worth over $3.5 billion (not including due diligence
engagements).

                    Industry Experience
      •   Food & Beverage                •   Transportation
      •   Retail & Distribution          •   Construction
      •   Manufacturing                  •   Software
      •   Agriculture                    •   Financial Services
      •   Automotive                     •   Technology
      •   Materials                      •   Energy
      •   Health Care                    •   Oilfield Services
      •   Pharmaceutical                 •   Real Estate

                    Hands-on Approach
Current M&A transactions require a hands-on approach from start
to finish including the active engagement of senior resources. Our
senior resources are dedicated to our clients and are available as
necessary and appropriate. We keep our clients regularly informed
of the engagement status, issues we are encountering, successes
and overall progress.

              Integrated Service Offering
We draw on the vast experience and deep specialist knowledge
network of our partners locally, nationally and internationally as
specialty issues arise, such as pre-transaction tax planning,
transaction structuring, estate planning, valuation, due diligence,
performance improvement and risk management.

                                                                                        Page 16
Leadership Team

                                        Transaction Leadership

        Brett Franklin             Aleem Bandali             Mark Regehr               Mike Reynolds
             President            Managing Director        Managing Director         Managing Director
             Winnipeg                Vancouver                 Edmonton                    Calgary
      Brett.Franklin@mnp.ca     Aleem.Bandali@mnp.ca      Mark.Regehr@mnp.ca        Mike.Reynolds@mnp.ca
           204.336.6190             778.374.2140              780.969.1404               587.702.5909

        Erik St-Hilaire            Stephen Shaw               Dan Porter              Kevin Tremblay
      Managing Director            Managing Director       Managing Director          Managing Director
             Winnipeg                   Toronto                 Toronto                     Toronto
     Erik.St-Hilaire@mnp.ca      Stephen.Shaw@mnp.ca       Dan.Porter@mnp.ca        Kevin.Tremblay@mnp.ca
          204.336.6200                416.515.3883            416.515.3877                647.943.4051

          Jon Edgett              Patrick Khouzam          Jonathan Banford             Éric Grondin
       Managing Director           Managing Director        Managing Director         Managing Director
            Waterloo                     Montreal               Chicoutimi                 Sherbrooke
       Jon.Edgett@mnp.ca        Patrick.Khouzam@mnp.ca   Jonathan.Banford@mnp.ca     Éric.Grondin@mnp.ca
          519.772.7460                 514.228.7874            418.696.3924               819.823.3290
                                                               Due Diligence Leadership

    Jean-Raymond Lafond            Craig Maloney              Johnny Earl            John Caggianiello
        Managing Director          Managing Director       Managing Director          Managing Director
          Drummondville                  Halifax               Vancouver                    Toronto
   Jean-Raymond.Lafond@mnp.ca    Craig.Maloney@mnp.ca      Johnny.Earl@mnp.ca      John.Caggianiello@mnp.ca
           819.473.7251               902.493.5430            604.637.1504                416.513.4177

                                                                                                       MNPCF.ca

                                                                                                              Page 17
You can also read