Onshore Acoustic Assessment - Revolution Wind Offshore Wind Farm - APRIL 2021 - Bureau of Ocean Energy ...
←
→
Page content transcription
If your browser does not render page correctly, please read the page content below
Technical Report

Onshore Acoustic
Assessment
Revolution Wind Offshore Wind Farm

         PREPARED FOR

              Revolution Wind, LLC
              56 Exchange Terrace, Suite 300
              Providence, RI 02903

         PREPARED BY

              101 Walnut Street
              PO Box 9151
              Watertown, MA 02471

              APRIL 2021
Onshore Acoustic Assessment Technical Report Executive Summary VHB has conducted an airborne sound assessment of the construction and operation of onshore components of the Revolution Wind Farm (RWF) and Revolution Wind Export Cable (RWEC) Project. The report presents background on airborne sound concepts, applicable federal, state, and local noise laws, ordinances, and guidelines, methodologies used to evaluate construction and operational sound, ambient sound monitoring results, an assessment of how the project will comply with relevant noise standards, and an evaluation of the need for practicable operational and/or construction best management practices (BMPs) to minimize potential noise effects. The U.S. Environmental Protection Agency (EPA) has noise guidelines (“Information on the Levels of Environmental Noise Requisite to Protect Public Health and Welfare with an Adequate Margin of Safety”) which recommend limiting operational noise to a day-night average sound level of 55 dBA (Ldn) which is equivalent to a constant equivalent sound level of 48.6 dBA (Leq). The State of Rhode Island general laws (Chapter 11-45) does not include quantitative noise limits and defers to municipalities to establish and enforce noise limits. The Town of North Kingston, Rhode Island noise ordinance (Town Code Article VI) limits continuous noise to 50 dBA between 10:00 PM and 7:00 AM and to 60 dBA between 8:00 AM and 10:00 PM at residential property lines. The noise ordinance limits continuous noise to 75 dBA any time of day at commercial/industrial property lines. The town ordinance prohibits construction activities between 6:00 PM and 7:00 AM, but has no quantitative noise limits for construction activities. Noise sensitive receptors (NSRs) near the potential landfall sites, transmission cable routes, and proposed onshore substation (OnSS) and interconnection facility (ICF) include single- family residences on the south side of Camp Avenue, multi-family residences on Millcreek Drive, industrial properties on Circuit Drive and Whitecap Drive, and Blue Beach including a walkway from Circuit Drive. Long-term (approximately 72 hours) ambient sound measurements were conducted at three locations near the proposed OnSS and Landing Work Area envelope. Insect sound was filtered out of the ambient sound measurements to provide results more representative of quieter nighttime conditions during the year when insects are not present. The ambient sound measurements results ranged from 44 to 45 dBA (Leq) at night (10:00 PM to 7:00 AM) and 49 to 50 dBA during the day (7:00 AM to 10:00 PM). The proposed OnSS would introduce new sources of sound including transformers, shunt reactors, harmonic filters, cooling and ventilation associated with the outdoor substation equipment, as well as condensers, pumps, skids and auxiliary transformers associated with the synchronous condenser building. Sound from the substation would be 43.9 dBA or lower at the closest NSRs which would be below the EPA guideline for noise exposure (48.6 dBA Leq) and below the Town of North Kingston, Rhode Island nighttime noise ordinance limit for residential properties (50 dBA). Operational sound from the OnSS would also be below 50 dBA at the nearest residential property lines and below 70 dBA at the nearest commercial/industrial property lines which is below the noise ordinance noise limits.
Onshore Acoustic Assessment Technical Report

Therefore, the operation of the proposed OnSS would comply with relevant federal, state,
and local noise limits and there is no need for measures to avoid, minimize or mitigate
operational noise.

Airborne sound will be generated onshore during construction by vessels and aircraft traffic.
Construction vehicles and equipment will also generate noise at ports used for construction
staging. Decommissioning may result in similar noise generation if it involves the removal of
Project components with comparable equipment and methods as construction.

Construction sound has been evaluated assuming operations on the western end of the
Landfall Work Area envelope as this is closest to noise-sensitive receptors on Middle Street
and Sauga Avenue. The building at 61 Whitecap Drive to the west of the site would provide
sound acoustic shielding to the residences farther west. Construction sound associated with
the cofferdam construction would be up to 51 dBA (Leq(8h)) at the nearest beach and
residences. Construction sound associated with the HDD site preparations, including sheet
pile driving for an anchor wall which will take approximately three days, would be up to 70
dBA (Leq(8h)) at the closest beach locations and approximately 36 to 43 dBA (Leq(8h)) at the
nearest residences. Construction sound from HDD operations would be approximately up to
54 dBA (Leq(8h)) at the beach and between 14 and 33 dBA (Leq(8h)) at residential receptors.

HDD operations would be below existing ambient daytime and nighttime sound conditions
and is not be expected to cause significant adverse noise impacts. Therefore, the
construction of the proposed Project would comply with relevant state and local noise limits
for all daytime construction activities, including HDD operations, and would not be expected
to result in significant adverse noise impact at any time.
Onshore Acoustic Assessment Technical Report

    Table of Contents

    1       Introduction ................................................................................................................... 1

            1.1         Project Description .................................................................................................................... 1
            1.2         Airborne Sound Concepts and Terminology .................................................................. 2

    2       Regulatory Context ....................................................................................................... 5

                        2.1.1             Federal ....................................................................................................................... 5
                        2.1.2             State ........................................................................................................................... 6

    3       Airborne Sound Analysis Methodology ..................................................................... 9

            3.1         Operational ................................................................................................................................ 10
                        3.1.1     Onshore Substation Operations ................................................................... 10
            3.2         Construction .............................................................................................................................. 11
                        3.2.1     Landfall Construction ........................................................................................ 12
                        3.2.2     Onshore Transmission Cable Construction .............................................. 13
                        3.2.3     Onshore Substation and ICF Construction ............................................... 14

    4       Affected Environment................................................................................................. 17

            4.1         Study Area .................................................................................................................................. 17
            4.2         Ambient Sound Measurement Results............................................................................ 17

    5       Environmental Consequences and Mitigation ......................................................... 21

            5.1         Operational Sound Impact Assessment.......................................................................... 21
                        5.1.1     Onshore Substation and ICF ........................................................................... 21
            5.2         Construction Sound Impact Assessment........................................................................ 25
                        5.2.1     Landfall Construction ........................................................................................ 25
                        5.2.2     Onshore Substation and ICF Construction ............................................... 35
            5.3         Avoidance, Minimization and Mitigation ....................................................................... 39
            5.4         Summary of Impacts............................................................................................................... 39

    6       References .................................................................................................................... 41

            Appendix ..................................................................................................................... 43

i   Introduction
Onshore Acoustic Assessment Technical Report
List of Tables
Table No. Description Page
Table 2.0-1 Summary of Noise Limits ...................................................................................................... 5
Table 2.1-1 EPA Noise Levels Identified to Protect Public Health and Welfare ...................... 6
Table 2.1-2 Town of Kingston, Rhode Island Noise Ordinance..................................................... 7
Table 3.1-2 Onshore Substation and ICF: Equipment Sound Levels ......................................... 11
Table 3.2-1 Landfall Construction Equipment Noise Emissions .................................................. 13
Table 3.2-2 Onshore Transmission Cable Construction Equipment Noise Emissions ........ 14
Table 3.2-3 Onshore Substation and ICF Construction Equipment Noise Emissions ......... 15
Table 4.2-1 Ambient Sound Measurement Results.......................................................................... 18
Table 5.1-1 Onshore Substation: Operational Noise ....................................................................... 22
Table 5.2-1 Landfall: Cofferdam Construction Noise ...................................................................... 26
Table 5.2-2 Landfall: HDD Site Preparation Noise ............................................................................ 26
Table 5.2-3 Landfall: HDD Operations Noise ...................................................................................... 27
Table 5.2-4 Onshore Transmission Cable Construction Noise .................................................... 35
Table 5.2-5 Onshore Substation and ICF: Construction Noise .................................................... 36
ii IntroductionOnshore Acoustic Assessment Technical Report
List of Figures
Figure No. Description Page
Figure 1.2-1 Maximum Airborne Sound Levels of Common Sources .......................................... 4
Figure 4.2-1 Ambient Sound Monitoring Locations .......................................................................... 19
Figure 5.1-1 Onshore Substation and ICF Operational Sound Contours .................................. 23
Figure 5.2-1 Landfall: Cofferdam Construction Sound Contours ................................................. 29
Figure 5.2-2 Landfall: HDD Site Preparation Sound Contours ...................................................... 31
Figure 5.2-3 Landfall: HDD Operations Sound Contours ................................................................ 33
Figure 5.2-4 Substation and ICF Construction Sound Contours .................................................. 37
iii IntroductionOnshore Acoustic Assessment Technical Report
Acronyms and Abbreviations
BMP Best Management Practice
BOEM Bureau of Ocean Energy Management
COP Construction and Operations Plan
dBA A-weighted decibel
dB Un-weighted decibel
EPA U.S. Environmental Protection Agency
GIS Geographic information system
HDD Horizontal directional drilling
Hz Hertz
ISO Organization for International Standardization
kHz kilohertz
km kilometer
Ldn Day-night average sound level
Leq Equivalent sound level
Lmax Maximum sound level
Lmin Minimum sound level
Ln Statistical sound level
Mi Mile
NEMA National Electrical Manufacturers Association
nm Nautical mile
NSR Noise sensitive receptor
OSS Offshore substation
OnSS Onshore substation and interconnection facility
PDE Project Design Envelope
RIDEM Rhode Island Department of Environmental Management
RWF Revolution Wind Farm
RWEC Revolution Wind Farm Export Cable
WTG Wind turbine generator
1 IntroductionOnshore Acoustic Assessment Technical Report
Introduction
This Onshore Airborne Sound Assessment Technical Report (“report”) includes an overview
of the Revolution Wind Farm Project (RWF) (the “Project” or the “proposed Project”) and the
onshore components that are the subject of the sound study including the Revolution Wind
Export Cable (RWEC) to connect the transmission cable to the onshore substation (OnSS)
and interconnection facility (ICF) located in Davisville, Rhode Island (a village in the town of
North Kingston). The report includes background information on airborne sound level
concepts, applicable federal, state, and local regulations, and ordinances and standards
related to noise, methodologies for analyzing operational and construction airborne sound,
characterizing existing ambient sound conditions in the study area, the results of ambient
sound monitoring, an assessment of the potential effects of operational and construction
sound due to the Project, and an evaluation of the need for practicable operational and/or
construction-period best management practices (BMPs) to minimize potential airborne noise
effects.
1.1 Project Description
Revolution Wind, LLC (Revolution Wind) proposes to construct and operate the Revolution
Wind Farm Project (Project). The Project consists of the offshore RWF, located in federal
waters on the Outer Continental Shelf, in BOEM Renewable Energy Lease Area OCS-A 0486
(Lease Area), and the RWEC, traversing federal and state waters with a landfall in Rhode
Island. The Lease Area is approximately 20 miles (mi) (30 kilometers [km]) southeast of Block
Island, Rhode Island.
1 IntroductionOnshore Acoustic Assessment Technical Report
In accordance with the BOEM Draft Guidance (BOEM, 2018), the Construction and
Operations Plan (COP) and the airborne acoustic assessment have been evaluated based on
a Project Design Envelopes (PDE) representing a reasonable range of design parameters. The
Project generally includes the following: Revolution Wind Farm (RWF), inclusive of up to 100
wind turbine generators (WTGs), up to two offshore substations (OSSs), Inter-Array Cables,
and OSS Interconnector Cable; up to two submarine export cables (referred to as the
Revolution Wind Export Cable [RWEC]), inclusive of up to 25 mi (40 km) in federal waters and
up to 23 mi (37 km) Rhode Island State Waters; and onshore facilities, inclusive of an up to
500-ft (152-m) segment of the RWEC, onshore transmission cable, and an OnSS and ICF.
Refer to Section 3 of the Project’s COP for a complete description of the PDE. This report
evaluates airborne sound expected from construction and operation of onshore facilities
including the RWEC Landfall Work Area envelope, onshore transmission cable, OnSS, and
ICF.
This airborne sound assessment assumes the maximum design envelope footprint for the
Project. For example, the sound evaluation of the OnSS uses sound emissions for
transformers based on National Electrical Manufacturers Association (NEMA) ratings. The
NEMA rating is generally considered to be an upper bound of the sound generated by a
transformer. Manufacturers will often provide guaranteed sound levels lower than the NEMA
rating and the actual measured sound level of equipment is typically below the guaranteed
level. Construction sound has been evaluated assuming operations on the western end of
the Landfall Work Area envelope as this is closest to noise-sensitive receptors on Middle
Street and Sauga Avenue.
1.2 Airborne Sound Concepts and Terminology
Sound is the rapid fluctuation of pressure above and below the ambient conditions and can
occur in any medium such as air or water. When sound becomes unwanted, it is defined as
noise. Sound becomes an adverse impact when it interferes with the normal habits or
activities of fish, wildlife or people. Sound is described based on its loudness or intensity
(sound level), the frequencies of sound, and the variation of sound over time. Sound levels
are most often measured on a logarithmic scale of decibels (dB) relative to 20 micro-Pascals
in air and relative to 1 micro-Pascal in water. Since airborne and underwater sound levels are
based on different reference levels, they should not be directly compared. For some
activities, such as pile driving for foundations, both airborne and underwater sound will be
generated.
Airborne sound can have a range of effects on humans including pain and hearing loss, at
high amplitudes, speech interference, sleep interference, annoyance, and physiological
effects such as anxiety or tinnitus and at high amplitudes could result in pain or hearing loss.
Potential effects from underwater sound on fish and mammals include altering their
behavior, disrupting their functions or physiology, causing injury or resulting in mortality.
Behavioral effects from sound may include causing fish to be startled, moving away from
typical habitats, reducing the ability to locate prey, or inability to communicate. Physiological
effects may include stress, temporary hearing loss, or cellular changes to organs such as a
2 IntroductionOnshore Acoustic Assessment Technical Report
fish’s swim bladder, eyes or brain. The severity of these effects depends on the intensity and
characteristics of underwater sound and the size and type of fish present.
Airborne sound is the rapid fluctuations of air pressure above and below ambient pressure
levels. Noise is defined as unwanted or excessive sound. Sound becomes unwanted when it
interferes with normal activities such as sleep, work, communication, or recreation. How
people perceive sound depends on several measurable physical characteristics, including:
› Sound Level – Sound level is based on the amplitude change in pressure and is related to
the loudness or intensity. Human hearing covers a wide range of changes in sound
pressure amplitude. Therefore, sound levels are most often measured on a logarithmic
scale of decibels (dB) relative to 20 micro-pascals. The dB scale compresses the audible
range of acoustic pressure levels, which can vary from the threshold of hearing (0 dB) to
the threshold of pain (120 dB). Because sound levels are measured in dB, the addition of
two sound levels is not linear. For example, adding two equal sound levels results in a 3-
dB increase in the overall level. Research indicates the general relationships between
sound level and human perception are as follows:
A 3-dB increase is a doubling of acoustic energy and is approximately the smallest
difference in sound level that can be perceived in most environments.
A 10-dB increase is a tenfold increase in acoustic energy and is generally perceived as a
doubling in loudness to the average person.
› Frequency – Sounds are comprised of acoustic energy distributed over a range of
frequencies. Acoustic frequencies, commonly referred to as tone or pitch, are typically
measured in Hertz (Hz). Human hearing generally ranges from 20 to 20,000 Hz; however,
the human ear does not perceive sound levels from each frequency as equally loud. To
compensate for this phenomenon in perception, a frequency filter known as A-weighting
is commonly used to evaluate environmental noise levels, and sound levels are denoted
as “dBA.” Sound is often presented in frequency bands such as octave or one-third octave
bands.
› Sound levels reported in octave or one-third-octave frequency bands are often used to
describe the frequency content of different sounds. Some sources of sound can generate
“pure tones,” which is when there is a concentration of sound within a narrow frequency
range such as a whistle. Humans can hear pure tones very well, and such conditions can
be a cause of increased annoyance.
A variety of sound level descriptors can be used for environmental noise analyses. These
descriptors relate to the way sound varies in level over time. The following is a list of
common sound level descriptors:
Energy-Average Sound Level (Leq) – Leq is a single value, which represents the same
acoustic energy as the fluctuating levels, that exist over a given period of time. The Leq takes
into account how loud noise events are during the period, how long they last, and how many
times they occur. Leq is commonly used to describe environmental noise and relates well to
human annoyance. An Leq over an 8-hour period is commonly used to evaluate construction
noise and is denoted Leq[8hr].
3 IntroductionOnshore Acoustic Assessment Technical Report
Day-night Average Sound Level (Ldn) – Ldn is similar to the Leq in that it is a single value,
which represents the same acoustic energy as the fluctuating levels, that exists over a 24-
hour period. The Ldn takes into account how loud sound events are, how long they last, how
many times they occur over a 24-hour period, and whether they occur during the day (7:00
AM to 10:00 PM) or night (10:00 PM to 7:00 AM). Sound that occurs during the night is given
a 10-dB penalty to account for the increased human sensitivity to noise at night. If sound
levels are constant over a 24-hour period, the Ldn level is 6.4 dB greater than the Leq level
due to the 10-dB nighttime penalty.
Statistical Sound Levels – Sound level metrics, such as L01, L10, L50 or L90, represent the
levels that are exceeded for a particular percentage of time over a given period. For example,
L10 is the level that is exceeded for 10 percent of the time. Therefore, it represents the
higher end of the range of sound levels. The L90, on the other hand, is the level that is
exceeded 90 percent of the time, and therefore, is representative of the background sound
level.
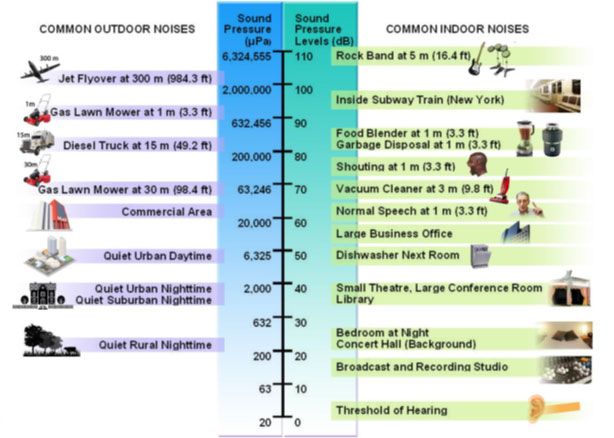
Maximum Sound Level (Lmax) – Many sources of sound, including mobile sources and
stationary sources, change over time. Stationary sources associated with energy facilities can
often generate different sound levels depending on the operational condition of the
equipment. It is common to describe sound in terms of the maximum (Lmax) sound level
emissions. Figure 1.2-1 (FHWA, 2018) presents a list of the maximum sound levels of
common outdoor and indoor sources.
Figure 1.2-1 Maximum Airborne Sound Levels of Common Sources
Source: FHWA, 2019
4 IntroductionOnshore Acoustic Assessment Technical Report
Regulatory Context
This section describes the federal, state, and local noise laws, regulations, ordinances, and
guidelines applicable to the proposed Project. Table 2.0-1 summarizes the jurisdiction,
agency, standard, and residential operational and construction noise limits.
Table 2.0-1 Summary of Noise Limits
Construction
Operational Noise Noise Limit
Jurisdiction Agency Standard Limit (dBA) (dBA)
Information on the Levels of 55 dBA (Ldn)
Environmental Noise Requisite to
Federal EPA 48.6 dBA (Continuous None
Protect Public Health and Welfare with
Leq)
an Adequate Margin of Safety
State of Rhode Chapter 11-45.1 Unreasonable Noise
General Laws N/A None
Island Levels
Residential: No construction
Town of North Kingston, RI Town Code Article VI: Noise 60 dBA 8 AM – 10 PM between
50 dBA 10 PM – 7 AM 6 PM – 7 AM
Sources: North Kingston, Rhode Island Town Code Chapter 8, Article VI, Noise, April 9, 2019.
2.1.1 Federal
The Noise Control Act of 1972 authorized federal agencies to adequately control noise that
may endanger the health and welfare of the nation’s population. In 1974, the EPA conducted
a study on noise impacts relative to public health and safety (EPA, 1974). This EPA study
5 Regulatory ContextOnshore Acoustic Assessment Technical Report
provides guidance on the potential effects of noise that can be considered by federal, state,
and local agencies; however, it does not constitute a standard or regulation.
As shown in Table 2.1-1, the EPA study concluded that a day-night average sound level of
55 dBA (Ldn) or less for outdoor residential areas, or 55 dBA (Leq[24]) or less for outdoor
areas where people spend limited amounts of time, such as schools and playgrounds, would
protect public health and welfare in regard to potential interference with outdoor activity
and annoyance. The study also concluded that a sound level of 45 dBA (Ldn) or (Leq[24]) or
less for indoor residential uses and schools, respectively, would protect public health and
welfare in regard to potential interference and annoyance. Since most buildings with
windows closed provide 20 dB or more, and buildings with windows open provide 10 dB of
outdoor-to-indoor sound attenuation, the exterior criteria are more stringent, and noise
from the proposed Project will be evaluated according to the outdoor criteria.
The EPA noise guidelines are based on the evaluation of pervasive long-term noise, and
therefore, are applied to future operational noise conditions and are not typically applied to
short-term construction-period activities.
Table 2.1-1 EPA Noise Levels Identified to Protect Public Health and Welfare
Effect Level Area
Outdoors in residential areas and farms, other outdoor areas where people
LDN [55 dBA] spend widely varying amounts of time, and other places in which quiet is a
Outdoor Activity basis for use
Interference
Outdoor areas where people spend limited amounts of time, such as
LEQ(24) [55 dBA]
school yards, playgrounds, parks, etc.
Indoor Activity LDN [45 dBA] Indoor residential areas
Interference and
Annoyance LEQ(24) [45 dBA] Other areas with human activities, such as schools
Source: EPA, 1974.
2.1.2 State
The following summarizes the relevant federal, state, and local laws, regulations, policies, and
guidance applicable to the Project.
2.1.2.1 Rhode Island
The State of Rhode Island general laws include a noise policy (Chapter 11-45.1 Unreasonable
Noise Levels) which prohibits unreasonable, excessive and annoying noise levels from all
sources subject to its police power. The Rhode Island Department of Environmental
Management (RIDEM) does not have environmental noise regulations applicable to the
Project. Therefore, there are no state-wide quantitative noise criteria for operations or
construction of the Project. The State of Rhode Island relies on individual communities to
establish noise regulations through community by-laws.
2.1.2.2 Local
The Town of North Kingston, Rhode Island noise ordinance (Chapter 8, Article VI) establishes
standards for the control of noise pollution by setting maximum permissible sound levels at
6 Regulatory ContextOnshore Acoustic Assessment Technical Report
or within the real property boundary of a receiving land use, to protect the public health,
safety and welfare. These sound level limits, shown in Table 2.1-2 are applicable to
construction and operation of the OnSS. The sound level limits do not apply to construction
activities which are controlled by limiting the operation of construction, drilling or
demolition work between the hours of 6:00 PM and 7:00 AM in any manner that creates a
noise disturbance.
Table 2.1-2 Town of Kingston, Rhode Island Noise Ordinance
Sound Level
Municipality Location of Receiving Land Use Time Limit, dBA
8 AM - 10 PM 60
Residential, and open space
10 PM - 7 AM 50
Town of Kingston, RI Business (neighborhood, waterfront and general) At all times 65
Business (heavy, planned and industrial) At all times 70
Noise sensitive area At all times 60
Sources: North Kingston, Rhode Island Town Code Chapter 8, Article VI, Noise, April 9, 2019. Accessed
https://library.municode.com/ri/north_kingstown/codes/code_of_ordinances?nodeId=PTIIIREOR_CH8HESA_ARTVINO.
7 Regulatory ContextOnshore Acoustic Assessment Technical Report
This page intentionally left blank.
8 Regulatory ContextOnshore Acoustic Assessment Technical Report
Airborne Sound Analysis Methodology
The methodology used to assess potential effects of onshore airborne sound from the
construction and operation of the Onshore Facilities includes 1) identifying noise-sensitive
receptors in the study area, 2) characterizing the existing ambient sound environment with
measurements, 3) modeling future sound emissions from the construction and operation of
the proposed Project, 4) assessing potential impact according to applicable criteria (see
Section 2, Regulatory Context) and 5) evaluating the need for construction or operational
airborne noise mitigation.
Noise sensitive receptors (NSRs) have been identified near the potential Landfall Work Area
envelope, transmission cable routes, and proposed OnSS by reviewing the North Kingston
land use data base and making field observations.
Ambient sound measurements were conducted at three locations within the study area.
Measurements were conducted using sound level meters certified to have Type I accuracy
according to the ANSI S1.4 “Specifications for Sound Level Meters.” Larson Davis model 831
and model LxT sound level meters were utilized. The sound level meters were calibrated in
the field prior to and after the measurements and by a laboratory traceable to the National
Institute of Standards and Technology within one year of the field measurements. The
measurements included overall A-weighted sound levels and one-third-octave band sound
levels, which provide information on the frequency content (i.e. low or high-pitched)
character of sound. Data collection included one-second time histories of all sound level
metrics and hourly interval summaries of the minimum, maximum, percentile values (L01,
L10, L33, L50, L90, and L99), and the energy-average sound level (Leq). Atmospheric
observations of wind speed, wind direction, air temperature, precipitation, barometric
9 Airborne Sound Analysis MethodologyOnshore Acoustic Assessment Technical Report
pressure and sky conditions were made in the field and from a nearby weather station (data
accessible online).
During attended measurements, observations were made of the predominant sources of
sound. For long-term unattended measurements, audio recordings and/or sound level time
histories were reviewed to understand the character of different sources of sound. The noise
data was evaluated to determine whether there was significant insect noise present. This was
done based on knowledge of the potential presence of insects, by listening to audio
recordings and by analyzing the frequency content to identify high-frequency tonal
conditions, which are indicative of insect noise. The sound levels were evaluated for the
presence of insect noise which can cause nighttime sound levels to be higher than they
would be without insects. Since insect noise is a seasonal occurrence and is not always
present, they have been filtered out of the sound measurement results to provide results
which are representative of the periods throughout the year when insect noise is not as
prevalent. By filtering insect noise, the ambient sound measurement results are more
conservative in that they represent the ambient sound levels during quieter periods of the
year where there is greater potential for increases in noise due to the Project. The process to
filter out insect noise is to identify the frequencies of sound that the insects generate
(typically between 2,000 and 10,000 Hz) and to remove the tones generated by the insects.
Ambient sound measurement results are presented in Section 4, Affected Environment.
Operational and construction sound has been predicted using Cadna-A sound software.
Cadna-A is an internationally-accepted sound prediction program that implements the
International Standards Organization 9613-2 sound propagation standard. This model takes
into account the sound emissions of equipment, the ground cover, terrain, and intervening
objects such as buildings. Terrain near the OnSS has been obtained from the Rhode Island
Geographic Information System (RIGIS) LiDAR database.
3.1 Operational
Operational sound generated by onshore components of the Onshore Facilities include the
OnSS and ICF in Davisville, Rhode Island.
3.1.1 Onshore Substation Operations
The proposed OnSS would introduce new sources of sound including transformers, shunt
reactors, harmonic filters, cooling and ventilation associated with the outdoor substation
equipment, as well as condensers, pumps, skids and auxiliary transformers associated with
the synchronous condenser building. The ICF has wave traps that generate sound. At this
phase of the substation design, specific manufacturers and models of equipment have not
been finalized. Reference sound levels for transformers have been given as the equivalent
National Electrical Manufacturers Association (NEMA, 2014) rating for difference sized
transformers and reactors which follow the Institute of Electrical and Electronics Engineers
(IEEE) measurement standard. Specifically, the onshore substation is assumed to include the
following sound-generating equipment as shown in Table 3.1-2. The loudest pieces of
equipment are the closed-circuit cooling systems with a sound level of 96 dBA at
10 Airborne Sound Analysis MethodologyOnshore Acoustic Assessment Technical Report
approximately 1 foot. The synchronous condenser building is conservatively assumed to
provide 20 dBA of indoor-to-outdoor noise reduction for the equipment inside.
Table 3.1-2 Onshore Substation and ICF: Equipment Sound Levels
Source Sound Level (dBA) Reference
Inside Synchronous Condenser Building
Synchronous Condenser (x2) 95 Sound Pressure Level at 3 feet
106 Sound Power Level (Sound Pressure at
Lube Oil Skid (x2)
approximately 1 foot)
111 Sound Power Level (Sound Pressure at
Water Skid (x2)
approximately 1 foot)
104 Sound Power Level (Sound Pressure at
Vacuum Pump (x2)
approximately 1 foot)
98 Sound Power Level (Sound Pressure at
Auxiliary Transformer (x2)
approximately 1 foot)
Outdoor Equipment
GSU Transformer (x2) 76 NEMA Rated Sound Pressure Level (at 1 to 6 feet)
Main Transformer (x2) 76 NEMA Rated Sound Pressure Level (at 1 to 6 feet)
Shunt Reactor (x4) 77 Sound Pressure Level at 3 feet
83 Sound Power Level (Sound Pressure at
Harmonic Filter Reactor (x12)
approximately 1 foot)
Harmonic Filter Capacitor 79 Sound Power Level (Sound Pressure at
(x12) approximately 1 foot)
Building Fans and Louvers 75 Sound Pressure Level at 3 feet
Closed Circuit Cooling System 96 Sound Power Level (Sound Pressure at
(x2) approximately 1 foot)
Cooling Water Pumps (x2) 85 Sound Pressure Level at 3 feet
82 Sound Power Level (Sound Pressure at
ICF Wave Traps (x2)
approximately 1 foot)
Source: Burns & McDonnell.
3.2 Construction
Airborne sound will be generated onshore during construction of the RWEC landfall,
transmission cable to the OnSS, and the OnSS and ICF. The overall installation schedule for
onshore facilities including landfall, onshore transmission cables, and the OnSS and ICF is
approximately 18 months (see COP Section 3.2, Project Schedule). Construction will typically
result in temporary increases in sound. Sound has been evaluated based generally on a
noisiest condition when the loudest construction equipment would be in operation.
Construction noise has been modeled using standard methods for energy and transmission
line projects in a manner that is consistent with federal guidelines. The construction noise
model accounts for the types of construction equipment, the number of each type of
equipment, the amount of time they typically operate during a work period (usage factor),
and the distance between receptor locations and the equipment. Cadna-A has been used to
11 Airborne Sound Analysis MethodologyOnshore Acoustic Assessment Technical Report
predict sound at nearby receptor locations for construction of the cofferdam, RWEC landfall,
and the OnSS and ICF. The model includes specific locations of the equipment, heights of
the construction noise sources, terrain, and location and height of intervening objects such
as sound walls surrounding the HDD site. The model provides construction sound level
contours from the sites. For the transmission cable along the streets, the Federal Highway
Administration’s (FHWA) Roadway Construction Noise Model (RCNM) has been used which
provides construction noise levels as a function of distance from the linear construction
activities.
For typical daytime construction activities, construction noise is evaluated according to the
8-hour energy-average Leq(8h). For construction activities that may occur continuously, such
as horizontal directional drilling (HDD), construction noise is evaluated according to the 24-
hour energy-average Leq(24h). Noise emissions of construction equipment are based on
reference data from the FHWA’s RCNM and other Project-specific equipment. RCNM
includes a database of sound emissions for commonly used construction equipment such as
dump trucks, backhoes, concrete saws, air compressors, and portable generators.
3.2.1 Landfall Construction
The installation method for the RWEC landfall will be determined based on an analysis of the
ground conditions and other engineering or environmental constraints. Construction would
be completed using the HDD methodology which involves drilling underneath the seabed
using a rig that would be located in the Landfall Work Area envelope. Ducts for the
transmission cable would be fit into the borehole and pulled back through the hole with
winches. A key factor relating to noise is that it is typically necessary to continually pump
fluids through the hole and to operate the HDD to prevent the hole from collapsing or the
drill rig from ceasing. There would be a maximum of two HDD rigs and two cable ducts
installed. The primary sound-generating construction equipment associated with HDD
operations includes the drill rig, a generator, excavator, and mud pumps. Unlike most other
construction activities that can be limited to daytime hours, it is typically necessary for HDD
operations to occur continuously to minimize the risk of the soil settlement and equipment
failures.
HDD construction at the landfall site would also include site preparation, including support
of excavation (anchor wall), and excavation for the vault. The equipment included in the HDD
site preparation activities includes an excavator, crane, and either an impact or vibratory
sheet pile driver. The loudest phase of construction at the transition site will be HDD site
preparation activities associated with sheet piling which is expected to last approximately
two days to install and remove.
As described in the COP Section 3, a temporary cofferdam may be installed at a sea depth of
approximately 13 feet (4 m) which is between approximately 1,700 feet (518 m) and 5,000
feet (1524 m) offshore from the mean high-water line. For the purposes of the noise
assessment, the analysis conservatively assumed the closest potential cofferdam location of
1,700 feet. Results are presented for the Landfall Work Area envelope assuming that
activities occur on the western end. Since the closest residential receptors are west of the
envelope area, this is a conservative assessment of potential construction noise impact. The
12 Airborne Sound Analysis MethodologyOnshore Acoustic Assessment Technical Report
cofferdam will be installed using either sheet pile or gravity cell and would take
approximately three days.
If the temporary cofferdam is constructed of steel sheet pile, vibratory hammer pile driving
will be used for installation and removal. Vibratory hammering for the cofferdam differs from
impact hammering for the foundations because it is non-impulsive (or continuous).
Installation of the sheet pile cofferdam would take approximately 3 days. Table 3.2-1
presents the typical equipment used during open-cut, HDD site preparation, and HDD
operations.
Table 3.2-1 Landfall Construction Equipment Noise Emissions
Sound Level at
Construction Activity Equipment 50 feet (dBA) Utilization Factor
Impact Pile Driver A 101 20%
Landfall HDD Site Preparation
Excavator A 81 40%
(Anchor Wall)
Small Crane A 76 10%
HDD Rig C 70 100%
Mud pump D 67 50%
Landfall HDD Operations Small Crane A 76 10%
Generator (75 kW) B 56 40%
Backhoe A 78 40%
Landfall Cofferdam Construction Vibratory Sheet Pile Driver A 95 20%
Sources:
A: Source: RCNM, 2011.
B: Source: WhisperWatt.Ultra Silent 75 kW Generator.
C: Source: Vermeer, Caterpillar.
D Source: eNoise Control Case Study (Sound Power Level, 98 dBA).
3.2.2 Onshore Transmission Cable Construction
Construction of the Onshore Transmission Cable involves different phases such as clearing
the transmission cable route, excavation of the route, support of excavation with shoring,
installing the duct, and then backfilling and final restorative activities. The types of
construction equipment used during Onshore Transmission Cable installation generally
include bulldozers, backhoes, front end loaders, aerial lifts, trenchers, compactors, concrete
saws, graders, pumps, compressors, and trucks. It is anticipated that construction of the
Onshore Transmission Cable will take approximately 12 months occurring within the overall
18-month period for installation of Onshore Facilities. Since the Onshore Transmission Cable
installation process progresses along the cable route during this period, the exposure to
construction noise is of a substantially shorter duration at any particular location along the
route. The transmission cable routes would extend along Circuit Drive and transition to the
Project site by either going across 135 Circuit Drive to Camp Avenue or continuing north on
Circuit Drive and transitioning to Camp Avenue between 101 and 135 Circuit Drive. Table
3.2-2 presents the reference sound emissions of the equipment used during each phase of
the onshore transmission cable construction.
13 Airborne Sound Analysis MethodologyOnshore Acoustic Assessment Technical Report
Table 3.2-2 Onshore Transmission Cable Construction Equipment Noise Emissions
Sound Level at
Construction Activity Equipment 50 feet (dBA) Utilization Factor
Generator A 82 50%
Small Bulldozer A 85 40%
Cable Installation- Route Clearance
Small Tractor A 84 40%
Small Excavator A 85 40%
Backhoe A 85 40%
Front End Loader A 85 40%
Cable Installation – Excavation Medium Excavator A 85 40%
Concrete Saw A 90 20%
Large Excavator A 85 40%
Trencher A 82 50%
Cable Installation – Shoring/Trenching Pump A 77 50%
Compressor A 80 40%
Aerial Lift A 85 20%
Cable Puller A 82 50%
Cable Installation – Duct Installation
Generator A 82 50%
Welder A 73 40%
Small Bulldozer A 85 40%
Bobcat A 80 40%
Hydraulic Tamper A 85 20%
Cable Installation - Backfilling Roller A 85 20%
Compactor A 80 20%
Grader A 85 40%
Concrete Vibrator A 80 20%
Sources:
A: Source: RCNM, 2011.
3.2.3 Onshore Substation and ICF Construction
The OnSS and ICF will be designed to meet Rhode Island State Building Code/2015
International Building Code, American Society of Civil Engineers (ASCE) Standard 7-10, ASCE
113, ASCE 24-14, all applicable Institute of Electrical and Electronics Engineers (IEEE)
standards, and local climate and geotechnical conditions. The sequence for construction the
OnSS and ICF typically includes clearing the site of vegetation, grading the site, installing
environmental erosion controls, installing the foundations and erecting buildings, such as
the synchronous condenser building, for housing equipment, and restoring any disturbed
areas on the site and removing environmental controls. Table 3.2-3 presents the primary
sound-generating construction equipment typically used during OnSS and ICF construction.
14 Airborne Sound Analysis MethodologyOnshore Acoustic Assessment Technical Report
Table 3.2-3 Onshore Substation and ICF Construction Equipment Noise Emissions
Sound Level at
Construction Activity Equipment 50 feet (dBA) Utilization Factor
Backhoe 80 40%
Cranes (2) 85 16%
Onshore Substation and ICF Refrigerator Unit 82 100%
Front End Loader 80 40%
Generator 82 50%
Sources:
A: Source: RCNM, 2011.
15 Airborne Sound Analysis MethodologyOnshore Acoustic Assessment Technical Report
This page intentionally left blank.
16 Airborne Sound Analysis MethodologyOnshore Acoustic Assessment Technical Report
Affected Environment
This section presents the affected environment including the study area used to assess
potential onshore airborne sound effects and the noise sensitive receptors (NSRs) within the
study area.
4.1 Study Area
The study area for onshore airborne sound includes the Landfall Work Area envelope which
is bordered by Circuit Drive to the north, Whitecap Drive to the west, Burlingham Avenue to
the east, and the shoreline to the south. The transmission cable route would extend along
Circuit Drive and transition to the Project site by either going across 135 Circuit Drive to
Camp Avenue or continuing north on Circuit Drive and transitioning to Camp Avenue
between 101 and 135 Circuit Drive. The OnSS would be located on the following three
contiguous parcels of land; 574 Camp Avenue, 594 Camp Avenue, and 109 Circuit Avenue.
NSRs have been identified near the Landfall Work Area envelope, transmission cable routes,
and proposed OnSS by reviewing the North Kingston land use data base and field
observations. NSRs include single-family residences on the south side of Camp Avenue,
multi-family residences on Millcreek Drive, industrial properties on Circuit Drive and
Whitecap Drive, and Blue Beach including a walkway from Circuit Drive.
4.2 Ambient Sound Measurement Results
Ambient sound measurements have been conducted at three sites near the OnSS and the
Landfall Work Area envelope from August 27 to August 31, 2019, as shown in Figure 4.2-1.
17 Affected EnvironmentOnshore Acoustic Assessment Technical Report
The ambient sound measurement data were evaluated and observations were made to
determine that there was significant sound from insects present during the nighttime period.
Sound from the insects caused nighttime sound levels to be higher than they would be
without insects. Since insect noise is a seasonal occurrence and is not always present, they
have been filtered out of the sound measurement results to provide results which are
representative of the periods throughout the year when insect noise is not as prevalent.
Sound levels with insect noise filtered out are denoted as “dBA-i”. By filtering insect noise,
the ambient sound measurement results are more conservative in that they represent the
ambient sound levels during quieter periods of the year where there is greater potential for
increases in noise due to the Project. The process to filter out insect noise is to identify the
frequencies of sound that the insects generate (typically between 2,000 and 10,000 Hz) and
to replace the sound energy in these frequencies with sound levels that do not include the
insect generated tones.
Table 4.2-1 presents the results of the daytime and nighttime ambient sound level results at
sites M1, M2, and M3. Photos of the measurement sites and ambient sound measurement
results at each site including hourly maximum, minimum, energy-equivalent, and statistical
sound levels are presented in the Appendix.
Table 4.2-1 Ambient Sound Measurement Results
Measurement Measurement Overall Octave-Band Sound Pressure Level (Leq, dBA)
Site Location Period (dBA-i) 31.5 63 125 250 500 1000 2000 4000 8000
Night 43.9 16.2 27.5 32.8 34.1 37.6 38.1 37.2 30.7 29.1
M1 Blue Beach
Day 49.1 20.2 32.0 36.3 38.4 41.8 42.1 42.2 41.5 38.1
Project Site Night 45.4 15.7 27.3 31.0 33.1 39.3 40.3 37.6 36.1 30.6
M2 (Southern
Day 50.5 19.5 31.6 36.0 38.0 42.9 44.7 44.1 42.4 39.0
Portion)
Project Site Night 45.0 15.4 26.0 29.1 33.8 38.5 39.6 37.2 35.8 33.6
M3 (Western
Day 50.0 19.2 29.4 34.4 37.6 41.7 43.0 43.8 43.2 39.8
Portion)
Source: VHB, 2019.
Day is between 7:00 AM and 10:00 PM
Night is between 10:00 PM and 7:00 AM
18 Affected Environmentil Dr
Revolution Wind
$
No
Aldrich
sa
r th
Ave
Main
In-Air Sound Study Results
ru
pR
Ambient Sound Measurement Locations
d
Dr
GRID
M3
NORTH
!
(
ek
Mill Cre
Circuit Rd
Qu
o ns
et Av
e Figure 4.2-1
Ambient Sound
R d lver
Be
Monitoring Locations
d
M2
R
!
(
ay
Camp Av
e
ew
Gat
Camp
Ave
W
ind
wa
rd
Bur
W
alk Rh
od
ling
es
h
Pl
am
r
Circuit D
Ave
McNa
ugh t St
!
( Measurement Location
Fishing Cov
e Rd Cou
ntry
Ln
Onshore Substation
Project Site
Anchorage, Environmental: Fugro
Shellgish Areas: MDMR
Service Layer Credits: Source: Esri, Maxar, GeoEye, Earthstar
Ki Geographics, CNES/Airbus DS, USDA, USGS, AeroGRID, IGN, and the
ng
Whi
Av sle
e y
teca
An
pD
Dr
ch
r
or
Seabreeze
Wa
y
ve
6th
sA
S t
cre
re A
Sho
Ln
g
in
t
nd
S
La
le
Reference system: NAD83 (2011)
dd
M1
!
( Projection: UTM Zone 19N
Mi
0 60 120 180 Meters
5th
S 0 250 500 Feet
t
4t
Date: 05/19/2020 Created by: D. WHITE
h
St
Document no: Checked by: S. MOBERG
Approved by: STEPWOnshore Acoustic Assessment Technical Report
Environmental Consequences and Mitigation
This section presents the results of the airborne sound assessment which assesses the
compliance of the proposed Project with relevant federal, state, and local noise laws,
regulations, and ordinances. This section presents the results of the operational sound
impact assessment, including an evaluation of sound generated by the OnSS and ICF, and
the construction sound impact assessment, including an evaluation of sound generated
during onshore activities such as the landfall construction, transmission cable installation,
and OnSS and ICF construction.
5.1 Operational Sound Impact Assessment
This section presents the results of the sound predictions and the impact assessment for
operation of the Project.
5.1.1 Onshore Substation and ICF
Table 5.1-1 presents the overall A-weighted sound emissions from the operations of the
OnSS and ICF at nearby receptor locations. Figure 5.1-1 presents the operational sound
level contours. This figure shows the contours of equal sound levels between 35 and 55 dBA.
The highest sound level at an NSR is 43.9 dBA at 129 Cattail Lane. This sound level is below
the EPA guideline of 48.6 dBA (Leq), which is equivalent to a day-night average sound level
of 55 dBA (Ldn), and therefore complies with the EPA guidance for exterior noise.
Operational sound from the OnSS and ICF would also be below 50 dBA at the nearest
residential property lines and below 70 dBA at the nearest commercial/industrial property
lines which is below the Town of North Kingston, RI Noise Ordinance noise limits.
21 Environmental Consequences and MitigationOnshore Acoustic Assessment Technical Report
Future sound levels at 129 Cattail Lane, which include existing ambient sources and the
proposed OnSS and ICF, would be 50.9 dBA during the daytime and 47.5 dBA during the
night. The overall increase in sound would be 0.9 dBA during the day and 2.5 dBA during the
night at this location. At NSRs south of the OnSS and ICF, sound would be 43.0 dBA (Leq) or
quieter and future sound levels would increase by 2 dBA or less. An increase in sound level
of 3 dBA or less is typically considered to be the threshold of perceptible change in sound.
Therefore, the operation of the proposed OnSS and ICF would comply with relevant federal,
state, and local noise limits.
Since most buildings with windows closed provide 20 dB or more, and buildings with
windows open provide 10 dB of outdoor-to-indoor sound attenuation, interior noise
conditions would be substantially quieter.
Table 5.1-1 Onshore Substation: Operational Noise
Existing Sound Level Substation Future Sound Level
(dBA-i, Leq) Sound (dBA, Leq) Increase (dBA)
Level
Receptor Address Daytime Nighttime (dBA, Leq) Daytime Nighttime Daytime Nighttime
R1 129 Cattail Lane 50.0 45.0 43.9 50.9 47.5 0.9 2.5
R2 140 Brook View Drive 50.0 45.0 40.8 50.5 46.4 0.5 1.4
R3 10 Gateway Road 50.5 45.4 38.3 50.8 46.2 0.3 0.8
R4 511 Camp Avenue 50.5 45.4 38.8 50.8 46.3 0.3 0.9
R5 525 Camp Avenue 50.5 45.4 40.7 50.9 46.7 0.4 1.3
R6 541 Camp Avenue 50.5 45.4 39.3 50.8 46.4 0.3 1.0
R7 553 Camp Avenue 50.5 45.4 39.3 50.8 46.3 0.3 0.9
R8 571 Camp Avenue 50.5 45.4 39.9 50.9 46.5 0.4 1.1
R9 595 Camp Avenue 50.5 45.4 39.9 50.9 46.5 0.4 1.1
R10 613 Camp Avenue 50.5 45.4 41.0 51.0 46.7 0.5 1.3
R11 629 Camp Avenue 50.5 45.4 40.2 50.9 46.5 0.4 1.1
R12 643 Camp Avenue 50.5 45.4 43.0 51.2 47.4 0.7 2.0
Source: VHB, 2019.
22 Environmental Consequences and MitigationRevolution Wind
Ca
tta
il
Ln
$
GRID
NORTH
Figure 5.1-1
Onshore Substation and
Interconnection Facility Operations
NORTH KINGSTOWN, RI
Qu
o ns
et
R d
R1
!
(
r
D
ek
re
ll C
Mi
Sound Level Contours
R2
!
(
35 dBA
40 dBA
45 dBA
50 dBA
55 dBA
(
! Receptor Location
Substation Equipment Area
Interconnection Facility
Anchorage, Environmental: Fugro
Shellgish Areas: MDMR
Service Layer Credits: Source: Esri, Maxar, GeoEye, Earthstar
Geographics, CNES/Airbus DS, USDA, USGS, AeroGRID, IGN, and the
R3
!
(
R4
!
(
Circu
R5
!
(
it Dr
d
R6
!
( Camp Av e
R
ay
R7
ew
!
( R8
Gat
!
(
R9
!
( R10
!
( Reference system: NAD83 (2011)
Projection: UTM Zone 19N
0 25 50 75 Meters
R11
!
( Camp Ave
0 250 500 Feet
R12
!
(
d
Win
eR
dw Date: 05/19/2020 Created by: D. WHITE
ard
Co v
Wa Document no: Checked by: S. MOBERG
lk
Approved by: STEPW
g
hin
FisOnshore Acoustic Assessment Technical Report
5.2 Construction Sound Impact Assessment
This section presents the airborne onshore sound level results from construction of the
cofferdam, RWEC landfall, transmission cable to the OnSS, the OnSS, and the ICF.
5.2.1 Landfall Construction
Construction activities at the landfall site will include building a cofferdam offshore along the
RWEC. For the purposes of the noise assessment, the cofferdam installation site was
conservatively assumed to be approximately 1,700 feet (518 m) offshore. Construction
activities will include site preparation for HDD activities, such as pile driving a sheet pile
anchor wall, and HDD operations.
As shown in Table 5.2-1 and Figure 5.2-1, onshore airborne construction sound levels from
cofferdam construction would be up to 51 dBA (Leq(8h)) at the nearest beach locations. At
the nearest residential receptors on Middle Street and Sauga Avenue, construction sound
levels would range from 47 to 50 dBA (Leq(8h)). Cofferdam construction would occur during
daytime hour and would be within all applicable state and local noise standards.
As shown in Table 5.2-2 and Figure 5.2-2, onshore airborne construction sound levels from
HDD site preparation activities would be up to 70 dBA (Leq(8h)) at the closest beach
locations. At residential receptors on Middle Street and Sauga Avenue, construction sound
levels would be 36 to 43 dBA (Leq(8h)). HDD site preparation would occur during daytime
hour and would be within all applicable state and local noise standards.
As shown in Table 5.2-3 and Figure 5.2-3, onshore airborne construction sound levels from
HDD operations would be up to 54 dBA (Leq(8h)) at the beach. At the nearest residential
receptors, HDD operations, which may occur during the daytime and nighttime, would
generate sound from 14 to 33 dBA (Leq(8h)). HDD operations during the daytime would be
within all applicable state and local noise standards.
As described in Section 4.2, ambient sound measurements at M3 near Blue Beach were 50
dBA (Leq) during the day and 45 dBA (Leq) during the night. Therefore, HDD operations
would generate sound below ambient conditions during the day and night at the closest
residences on Middle Street.
25 Environmental Consequences and MitigationOnshore Acoustic Assessment Technical Report
Table 5.2-1 Landfall: Cofferdam Construction Noise
Cofferdam Construction
Receptor Address Sound Level (dBA, Leq(8r))
R13 133 Middle St 46.9
R14 125 Middle St 46.9
R15 119 Middle St 47.0
R16 111 Middle St 47.2
R17 91 Middle St 47.5
R18 41 Middle St 47.7
R19 216 Sauga Ave 46.0
R20 221 Sauga Ave 49.6
R21 159 Sauga Ave 48.7
R22 89 Sauga Ave 46.7
-- Blue Beach 51.2
Source: VHB, 2021.
Table 5.2-2 Landfall: HDD Site Preparation Noise
HDD Site Preparation
Construction Sound Level
Receptor Address (dBA, Leq(8hr))
R13 133 Middle St 43.2
R14 125 Middle St 42.2
R15 119 Middle St 41.4
R16 111 Middle St 40.7
R17 91 Middle St 39.2
R18 41 Middle St 38.0
R19 216 Sauga Ave 38.3
R20 221 Sauga Ave 38.9
R21 159 Sauga Ave 37.3
R22 89 Sauga Ave 35.8
-- Blue Beach 69.5
Source: VHB, 2021.
26 Environmental Consequences and MitigationYou can also read