Ontogenetic shift in diet of a large elapid snake is facilitated by allometric change in skull morphology
←
→
Page content transcription
If your browser does not render page correctly, please read the page content below
Ontogenetic shift in diet of a large elapid snake is
facilitated by allometric change in skull morphology
Matthew Brenton Patterson ( 31566976@student.murdoch.edu.au )
Murdoch University https://orcid.org/0000-0002-4468-952X
Ashleigh K Wolfe
Curtin University Bentley Campus: Curtin University
Patricia A Fleming
Murdoch University South Street Campus: Murdoch University
Philip W Bateman
Curtin University Bentley Campus: Curtin University
Meg Martin
Murdoch University South Street Campus: Murdoch University
Emma Sherratt
The University of Adelaide
Natalie M Warburton
Murdoch University South Street Campus: Murdoch University
Research Article
Keywords: Trophic ·Squamata, Geometric morphometrics, Allometric scaling, Post-natal growth, Micro-CT
Posted Date: September 1st, 2021
DOI: https://doi.org/10.21203/rs.3.rs-853742/v1
License: This work is licensed under a Creative Commons Attribution 4.0 International License.
Read Full License
Page 1/30
Abstract
As snakes are limbless, gape-limited predators, their skull is the main feeding structure involved in prey
handling, manipulation and feeding. Ontogenetic changes in prey type and size are likely to be associated
with distinct morphological changes in the skull during growth. We investigated ontogenetic variation in
diet from stomach contents of n = 161 dugite specimens (Pseudonaja affinis, Elapidae) representing the
full range of body size for the species, and skull morphology of 46 specimens (range 0.25–1.64 m snout-
vent-length; SVL). We hypothesised that changes in prey type throughout postnatal ontogeny would
coincide with distinct changes in skull shape. Dugites demonstrate a distinct size-related shift in diet: the
smallest individuals ate autotomised reptile tails, medium-sized individuals predominantly ate small
reptiles (as snakes grew larger there was an increased likelihood of feeding on reptiles head-first), and the
largest individuals (> 0.8 m SVL) ate mammals and large reptiles. Morphometric analysis revealed that ~
40% of the variation in skull shape was associated with body size (SVL). Through ontogeny, skulls
changed from a smooth, bulbous cranium with relatively small trophic bones (upper and lower jaws and
their attachments), to more rugous bones (as an adaption for muscle attachment) and relatively longer
trophic bones that would extend gape. Individual shape variation in trophic bone dimensions was greater
in larger adults and this likely reflects natural plasticity of individuals feeding on different prey
sizes/types. Rather than a distinct morphological shift with diet, the ontogenetic changes were
consistent, but positive allometry of individual trophic bones resulted in disproportionate growth of the
skull, reflected in increased gape size and mobility of jaw bones in adults to aid the ingestion of larger
prey and improve manipulation and processing ability. These results indicate that allometric scaling is an
important mechanism by which snakes can change their dietary niche.

Introduction
Snakes (Squamata, Serpentes) of the clade Macrostomata are “bulk-feeders”, specialising in capturing
and swallowing whole relatively large prey (Bellairs, 1969; Kardong, 2012; Scanferla, 2016). The
maximum size of prey they can consume is limited by the maximum gape of their jaws (Dwyer & Kaiser,
1997; Hampton, 2011). Snake skulls have several adaptations for ingesting large prey, including
enhanced jaw mobility though modified mandibular articulation and the absence of the mandibular
symphysis, and a strengthened braincase that protects the brain during prey manipulation (Bellairs, 1968;
Bellairs, 1969; Kardong, 2012; O'Malley, 2005; Romer & Parsons, 1986). Further adaptations have been
reported for specialist diets. For example, snakes that prey on frogs often have broad heads, robust upper
jaw bones and long quadrate and supratemporal bones (Andjelković et al., 2016; Dwyer & Kaiser, 1997;
Hampton, 2011), while snakes that specialise in eating fish have longer, narrower skulls and jaws to cope
with the physical demands of striking at prey underwater (Andjelković et al., 2016; Hampton, 2011;
Vincent et al., 2007).

To understand dietary specialisation among species, one approach is to investigate the impact of diet
changes during ontogeny. Many snake species demonstrate a dramatic shift in diet during their postnatal
growth (Natusch & Lyons, 2012; Vincent et al., 2007). For example, Pseudonaja textilis, Morelia viridis and
                                                  Page 2/30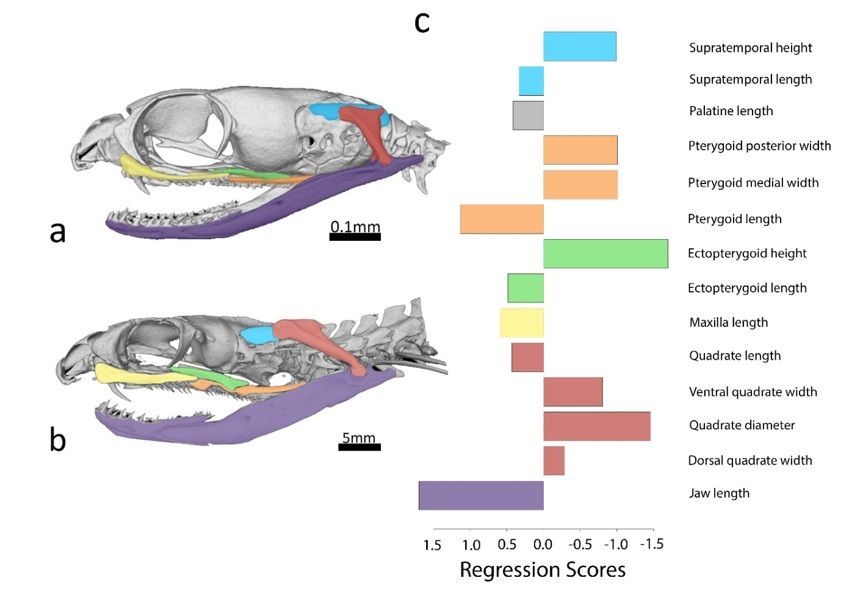
M. spilota exhibit an ontogenetic diet shift from small reptilian prey as juveniles to large mammalian prey
as adults (Natusch & Lyons, 2012; Shine, 1989; Shine, 1991). Such dietary shifts involve different
challenges in prey capture, handling and ingestion (Cundall & Greene, 2000; Scanferla, 2016) that are
expected to impose different functional demands on the skulls (and associated musculature) as they
grow (Hampton, 2011). Such a dietary shift may be facilitated by the proportional growth of the skull
elements with increasing body/head size (i.e., allometry), or be associated with a distinct morphological
shift (i.e., a significant change in the relationship between size and shape). Therefore allometry, the study
of size and its consequences, is a powerful tool to explore the relationship between diet and morphology
during ontogeny.

Australian brown snakes (Elapidae; Pseudonaja spp.) are known to feed mainly on reptiles when they are
small juveniles, while larger individuals take more mammalian prey (Shine, 1989; Wolfe et al., 2017). Here,
we investigate the relationship between diet (as determined by stomach contents) and skull morphology
(examined using linear and landmark-based morphometric techniques) of dugites (P. affinis) across a
range of body sizes to:

(1) quantify ontogenetic changes in diet;

(2) characterise how cranium shape changes with body size during ontogeny;

(3) characterise how trophic bone dimensions change during ontogeny; and

(4) examine the relationship between change in diet and morphology of the skull.

Materials And Methods
Study species
The dugite is a venomous elapid commonly found throughout southwest Western Australia and in the
southeast of South Australia (Bush et al., 2010; Maryan & Bush, 1996). It is an opportunistic diurnal
forager (Shine, 1989; Shine & Schwaner, 1985). It can be found in a wide variety of habitats, including
coastal dunes, shrublands, semi-arid woodlands and wet sclerophyll forests, and often shows a
preference for disturbed urban habitats and those associated with agriculture (Maryan & Bush, 1996).
Neonatal snout-to-vent length (SVL) ranges from 0.19–0.23 metres, while adults average 1.09 m SVL
(maximum 1.63 m) with little to no sexual size dimorphism (Maryan & Bush, 1996; Shine, 1989; Shine,
1994a; Shine, 1994b).

A total of 586 specimens, previously examined by Wolfe et al. (2017), were analysed for diet through
stomach content analysis: 548 collected between 1910 and 2015 held by the Western Australian
Museum, and 20 opportunistically collected during 2014–2015 as road-kill from around the Perth region
in Western Australia (under a Department of Parks and Wildlife Regulation 17 license #SF009895). We
recorded the SVL and body mass of each specimen. For snakes > 0.40 m in length, sex was determined

                                                  Page 3/30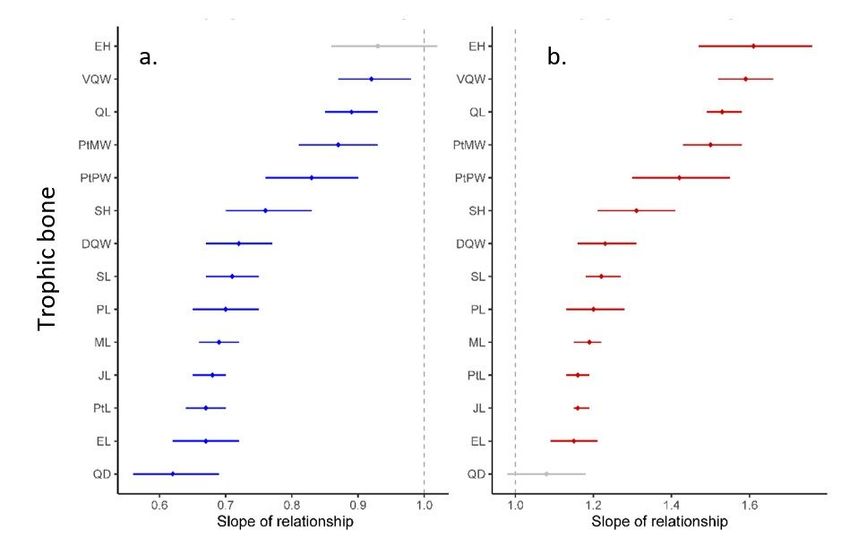
either by probing or dissection of the sub-caudal scales (Wolfe et al., 2017). For juvenile snakes < 0.40 m,
sex was determined by extracting the gonads and examining histological slices under a microscope
(Bloom & Fawcett, 1975; Dellmann, 2006; Jacobson, 2007).

Do dugites show a significant ontogenetic shift in diet?
To quantify diet of dugites, stomach contents were examined by gross dissection. The stomachs of 586
specimens were removed via an incision at the subcaudal third of the ventral midline, continued anteriorly
until the stomach was located and removed. Stomachs were opened lengthwise, and all contents were
removed. A total of n = 161 had items present in their stomachs. Prey items were identified to the lowest
possible taxon by physical examination.

Diet data was sorted into four categories based on the major prey types found in the stomachs:
autotomised reptile tails, intact small reptiles (< 100 mm SVL), intact large reptiles (> 100 mm SVL), and
mammals. A multivariate analysis of covariance (MANCOVA), with SVL as a covariate and the
proportions of each prey (autotomised reptile tails, small reptiles, large reptiles, mammals) as dependent
variables, was carried out in Statistica v7.1 (StatSoft Inc., 2007).

We compared the orientation of reptile prey taken by snakes (head-first or tail-first; snakes with multiple
reptile prey in both orientations were excluded from this analysis) using a Pearson’s Chi test, with
expected values calculated as an equal proportion of head-first or tail-first reptile prey across three snake
size categories (SVL < 0.5m, 0.5–1.0m, 1.0–1.5m).

Do dugites show an ontogenetic change in skull
morphology?
A total of 46 specimens were available to study skull morphology (sampling subject to specimen
damage) and micro-Computed Tomography (micro-CT) was used to make digital models of the skulls. In
preparation for scanning, intact heads were removed from the body and placed in 10% buffered formalin
for at least a week before being scanned. Heads were scanned using a Skyscan 1176 In Vivo Micro-CT at
65 kV, 381 mA with a resolution of 18µm (Centre for Microscopy, Characterisation and Analysis facility;
Harry Perkins Institute of Medical Research; Nedlands, WA). Details of the micro-CT processing steps are
available in Appendix 1. The micro-CT data was first imported into NRecon v.1.7.1.0 (Micro Photonics
Inc., USA) for slice reconstruction and then CT-Analyser v.1.17.7.2 (Micro Photonics Inc., USA) was used
to visualise the reconstructed slices and produce 3D surface models of the skulls. Each 3D surface model
was then imported into MeshLab v.2016.12 (Cignoni et al., 2008), where they were simplified to ease
manipulation for landmarking using Quadric Edge Decimation to reduce the number of vertices (to ~
500,000 vertices). Landmarks were placed onto the skull models using IDAV Landmark Editor v.3.6 (Wiley
et al., 2007).

Two landmarking schemes were used to capture shape variation of the skull across specimens. The first
scheme consisted of 61 landmarks placed on the cranium (Fig. 1a-c), while the second landmarking
scheme consisted of 32 landmarks placed on the trophic bones (Fig. 1d-f) from which 14 inter-landmark
                                                  Page 4/30
distances (linear dimensions) were calculated (Table 1). These cranium versus trophic bone datasets
facilitate complementary analysis of shape changes through postnatal ontogeny on two principal regions
of the skull; the cranium being relatively fixed and immovable (Fig. 1a-c), and the trophic bones being
articulated and highly mobile (Fig. 1d-f).
Table 1
Table of linear measurements of dugite (Pseudonaja affinis) skulls as depicted in Fig. 1, with descriptions
of each.
Abbrev Description
JL Jaw length; anterior tip of dentary to posterior edge of compound bone
DQW Dorsal quadrate width; anterior to posterior end of dorsal portion of quadrate (where it
articulates with supratemporal)
QD Quadrate diameter; diameter of quadrate at central point along length of quadrate
VQW Ventral quadrate width; outer edge to inner edge of ventral portion of quadrate,
perpendicular to length of jaw (where articulates with mandible)
QL Quadrate length; dorsal edge (articulates with supratemporal) to ventral edge (articulates
with mandible) of quadrate
ML Maxilla length; straight line distance from anterior tip to posterior tip of maxilla
EL Ectopterygoid length; straight line distance from anterior tip to posterior tip of ectopterygoid
EH Ectopterygoid height, dorsal edge to ventral edge of ectopterygoid at bony protrusion
towards posterior end
PtL Pterygoid length; straight line distance from anterior tip to posterior tip
PtMW Pterygoid medial width; width of pterygoid at point where it meets with ectopterygoid
PtPW Pterygoid posterior width; width at back of pterygoid where bone fans out flat, taken at
widest fanning out point
PL Palatine length; straight line distance from anterior to posterior end of palatine
SL Supratemporal length; straight line distance from anterior end to posterior end of
supratemporal
SH Supratemporal height; dorsal edge to ventral edge of supratemporal
Landmarks digitised on the cranium were analysed using geometric morphometrics, a method that
preserves the geometry of objects (typically represented by landmark configurations) and permits
statistical analysis of shape (e.g., Adams et al., 2013). Landmark coordinates were standardised to
Procrustes shape coordinates by aligning the landmark configurations using generalised Procrustes
superimposition (Rohlf & Slice, 1990), taking object symmetry into account (Klingenberg et al., 2002)
using the bilat.symmetry function in ‘geomorph’ package v.3.0.6 (Adams et al., 2018) in the R statistical
environment (R Core Team, 2018).
Page 5/30To examine ontogenetic allometry in shape of the cranium, we measured the strength and statistical
significance of the relationship between cranium shape and body size using a multivariate regression of
the Procrustes shape coordinates (dependent variable) against log10-transformed SVL (independent
variable) (Klingenberg, 2016). To account for possible sexual dimorphism, sex was included in the
regressions as a fixed factor. To visualise the allometric relationships between shape and size, a
regression score was calculated and plotted against log10-transformed SVL (Drake & Klingenberg, 2008).
The regression score is a univariate summary of the multivariate regression vector (Drake & Klingenberg,
2008). These analyses were carried out using the procD.lm function in ‘geomorph’ in R.
Do dugites show an ontogenetic change in relative
dimensions of trophic bones?
Linear dimensions were measured from the digital skull models to capture the size of the main trophic
bones identified in previous studies: the pterygoid, palatine, maxilla, quadrate, mandible (compound and
dentary), ectopterygoid and supratemporal bones (Andjelković et al., 2016; Camilleri & Shine, 1990;
Cundall & Rossman, 1984; Dwyer & Kaiser, 1997; Hampton, 2011; Palci et al., 2016; Vincent et al., 2007). A
total of 14 linear measurements were obtained digitally by calculating distances between landmarks
pairs using the interlmkdist function in ‘geomorph’ in R (Table 1, Fig. 1d-f). Prior to analyses, the linear
measurement data was transformed into log-shape ratios to standardise them for scale in order to
quantify the shape variation across the range of specimens (Mosimann & James, 1979). This
transformation involves dividing each of the measures by a standard size variable (geometric mean of all
variables), which quantifies the overall size of the specimen, and then log-transforming the
measurements, and is equivalent to the scaling step of the Procrustes superimposition described above
(Mosimann & James, 1979).
Ontogenetic variation in trophic bone morphology was examined as above for cranial shape using a
multivariate regression of the log-shape ratios against log10-transformed SVL (independent variable),
while taking into account sex as a fixed factor. A series of reduced major axis (RMA) regression of
individual log10-transformed linear measurements against log10-transformed SVL and log10-transformed
head length were performed separately to explicitly calculate the allometric slopes of the trophic bones.
RMA regression was chosen over ordinary least-squares (OLS) regression as it accounts for
measurement error commonly found in morphological data (Vincent et al., 2006a). These analyses were
carried out in using the ‘lmodel2’ package v.1.7-3 in R (Legendre, 2008).
Is there a change in skull morphology coinciding with an
ontogenetic shift in diet?
Preliminary examination of diet data revealed that there was a shift in the primary prey item when snakes
reached ~ 0.80 m SVL. To test whether there is a change in the allometric slope of skull shape coinciding
with this dietary shift (i.e. a distinct morphological shift with diet) we performed a MANCOVA, evaluating
a model with SVL and diet groups (< 0.80 m SVL and > 0.80 m SVL) as interacting independent factors.
Page 6/30The hypothesis of a morphological shift is supported when there is a significant interaction term
indicating difference in the predicted slopes of each diet group. These analyses were carried out using the
procD.lm function in ‘geomorph’ in R, which is designed for high-dimensional data (Collyer et al., 2015).
The predicted slopes were visualised for each shape dataset using the first principal component of the
model’s predicted values (Adams & Nistri, 2010).
Results
Do dugites show a significant ontogenetic shift in diet?
Stomach contents were analysed for n = 586 dugite, of which n = 161 individuals had food present. This
analysis revealed a significant ontogenetic shift (F1,149= 27.63, p < 0.001). The main prey items for
juvenile snakes (< 0.4 m SVL, n = 37) were autotomised tails of skinks and geckos (some whole lizards
found). The stomachs of medium-sized snakes (0.4–1.0 m SVL, n = 54) contained mainly small skinks
and geckos. Mammals (principally Mus musculus, some Rattus spp.) and large reptiles (> 100 mm SVL,
n = 71, principally Tiliqua rugosa) were only found in adult snakes > 0.6 m SVL (Fig. 2). Mammals
(rodents) become the main prey item (measured as proportion of total prey mass) in dugites > 0.8 m SVL.
There was evidence in a change of prey handling as dugites increased in body size. Reptiles had largely
either been ingested head-first (n = 57 snakes) or tail-first (n = 29 snakes), with a smaller proportion of
snakes having prey of both orientations in their stomachs (n = 7 snakes) (Fig. 3). Small snakes (< 0.5 m
SVL, n = 26) were significantly more likely to have ingested reptile prey tail-first (χ21 = 23.45, p < 0.001),
while the largest snakes (1.0–1.5 m SVL, n = 31) were significantly more likely to have ingested reptile
prey head-first (χ21 = 8.49, p = 0.004) (Fig. 3). The orientation of reptile prey ingested by the intermediate
size category (0.5–1.0 m SVL, n = 29) was not significantly different from the expected proportions
calculated as the average of all snakes (χ21 = 2.79, p = 0.095) (Fig. 3).
Do dugites show an ontogenetic change in cranium shape?
Multivariate regression of Procrustes residuals representing cranium shape against SVL revealed 44% of
the variation was associated with body size (R2 = 0.44, P < 0.001). There was a small but significant
difference between the sexes in this relationship (F2, 45 = 5.00, p < 0.001). Cranium shape variability
between individuals remained consistently low throughout our ontogenetic series while remaining closely
correlated with body size (Fig. 4a).
Changes in shape of the anterior cranium (snout) corresponding with an increase in SVL were relatively
slight, with the nasals, and to a lesser degree the frontals, becoming more elongated and compressed
(Fig. 5). By contrast, substantial changes in the shape of the posterior cranium (braincase) were evident
with increasing SVL, specifically in the supraoccipital and occipital bones (located posterior to the
parietal bone on dorsal surface), which a change from smooth and wide in juvenile individuals to a more
compressed, ridged and elongated form in adults (Fig. 5).
Page 7/30Do dugites show an ontogenetic change in relative
dimensions of trophic bones?
Multivariate regression of the trophic bone dimensions against SVL revealed 37% of the variation was
associated with SVL (R2 = 0.37, P < 0.001). There was a small but significant difference between the
sexes in this relationship (F2, 45 = 5.44, p < 0.001) (Fig. 4b). In contrast with cranium shape, trophic bone
variability between individuals appeared to increase during postnatal ontogeny (Fig. 4b).
When examining each bone individually, RMA regressions revealed that ectopterygoid height (EH) scaled
isometrically while all other measurements scaled with significant negative allometry against SVL
(Fig. 6a, Table 2a). Against head length, most trophic bone measurements scaled with significant positive
allometry, the only exception was the quadrate diameter (QD), which scaled isometrically (Fig. 6b,
Table 2b).
Page 8/30Table 2
Results from RMA regression of all log-transformed of dugite (Pseudonaja affinis)
trophic bone dimensions against log-transformed (a) snout-to-vent length and (b)
head length. Showing the R2 value, y-intercept, the slope (allometric coefficient)
along with the 95% confidence intervals, and whether there is positive allometry (P),
negative allometry (N) or no allometry (isometry, I). Ectopterygoid height (EH)
scaled isometrically while all other measurements scaled with significant negative
allometry against SVL.
Variable R2 y-intercept Slope 95% CI Allometry
a. Snout-to-vent length
JL 0.98 -1.92 0.68 0.65–0.70 N
DQW 0.94 -4.17 0.72 0.67–0.77 N
QD 0.88 -4.67 0.62 0.56–0.69 N
VQW 0.96 -6.22 0.92 0.87–0.98 N
QL 0.98 -4.77 0.89 0.85–0.93 N
ML 0.97 -3.12 0.69 0.66–0.72 N
EL 0.95 -3.06 0.67 0.62–0.72 N
EH 0.92 -7.19 0.93 0.86–1.02 I
PtL 0.98 -2.46 0.67 0.64–0.70 N
PtMW 0.95 -6.04 0.87 0.81–0.93 N
PtPW 0.92 -5.70 0.83 0.76–0.90 N
PL 0.94 -3.34 0.70 0.65–0.75 N
SL 0.97 -3.54 0.71 0.67–0.75 N
SH 0.92 -5.21 0.76 0.70–0.83 N
b. Head length
JL 0.99 -0.31 1.16 1.15–1.19 P
DQW 0.96 -2.47 1.23 1.16–1.31 P
QD 0.90 -3.18 1.08 0.98–1.18 I
VQW 0.97 -4.03 1.59 1.52–1.66 P
QL 0.99 -2.66 1.53 1.49–1.58 P
ML 0.99 -1.48 1.19 1.15–1.22 P
EL 0.97 -1.47 1.15 1.09–1.21 P
Page 9/30Variable R2 y-intercept Slope 95% CI Allometry
EH 0.91 -4.97 1.61 1.47–1.76 P
PtL 0.99 -0.86 1.16 1.13–1.19 P
PtMW 0.97 -3.98 1.50 1.43–1.58 P
PtPW 0.92 -3.73 1.42 1.30–1.55 P
PL 0.96 -1.68 1.20 1.13–1.28 P
SL 0.98 -1.85 1.22 1.18–1.27 P
SH 0.93 -3.41 1.31 1.21–1.41 P
The trophic bones changed from being short and slender bones in juveniles to elongate and robust bones
in adults (Fig. 7). Dimensions that had the highest contribution to the multivariate regression score were
jaw length, ectopterygoid height, quadrate diameter, and pterygoid length (Fig. 7), revealing that these
dimensions experienced the most dramatic change with increasing body size, relative to all other
dimensions. Jaw length had the most positive regression score, indicating that the lower jaw increased to
the greatest degree during development relative to the other trophic bones (Fig. 7). Conversely, the
ectopterygoid height had the most negative regression score, indicating that the height of the
ectopterygoid grew at a lower rate relative to the other trophic bones (Fig. 7). Additionally, there was a
gradual backwards rotation of the quadrate bone.
Is there a change in skull morphology coinciding with an
ontogenetic shift in diet?
For cranium shape, the interaction term between SVL and diet category was marginally significant
(MANCOVA, F1,46 = 1.81, p = 0.015), indicating a slight difference in regression slopes between smaller
snakes (< 0.8 m) and larger snakes (> 0.8m) (Table 3a). This suggests weak support for the hypothesis
that there was a morphological shift in cranium shape associated with a shift in diet at around this body
size. For trophic bone dimensions, the interaction term was not significant (F1,46 = 1.77, p = 0.089),
indicating that the smaller snakes (< 0.8 m) did not differ in their slope gradient in comparison to the
larger snakes (> 0.8 m) (Table 3b), rejecting the hypothesis of a distinct morphological shift with the
ontogenetic diet shift.
Page 10/30Table 3
Results from MANCOVA diet slopes tests for dugite (Pseudonaja affinis) a)
cranium shape and b) trophic bone dimensions compared with SVL and between
smaller (< 0.8 m SVL) and larger (> 0.8 m SVL) groups (‘diet’).
Term DF SS MS R2 F p
a. Cranium shape
SVL 1 0.039 0.039 0.44 35.81 0.001
Diet group 1 0.002 0.002 0.03 2.23 0.008
SVL x diet group 1 0.002 0.002 0.02 1.81 0.015
Total 45
b. Trophic bone dimensions
SVL 1 1.486 1.486 0.37 26.99 0.001
Diet group 1 0.168 0.168 0.04 3.05 0.006
SVL x diet group 1 0.098 0.097 0.02 1.77 0.089
Total 45
Discussion
Dugites demonstrate both a change in prey size and prey type as snakes grew larger, shifting from
autotomised reptile tails to small reptiles, and later to mammals and larger reptiles at 0.6–0.8 m SVL.
This ontogenetic change in diet would result in different challenges in terms of prey handling. We also
quantified significant changes in both the cranium and trophic bones of dugites during ontogeny. A
significant proportion of variation in cranium shape (44%) and relative dimensions of trophic bones
(37%) was associated with increasing body size in dugites. There was also significant positive allometry
of trophic bone dimensions with head size, indicating that these bones grow relatively larger as head size
increases. These morphological changes were consistent with the ontogenetic change in diet in dugites.
Ontogenetic Shift in Diet
Rather than a distinct shift in diet, we found a gradual change in the proportions of prey items taken by
dugites as they grow larger. Autotomised reptile tails and small reptiles were the main prey items of
juveniles and small adults (< 0.8 m SVL), but the proportion of these two prey types decreased with dugite
increasing body size. Conversely, the proportion of mammals and larger reptiles in the diet of dugites
increased with body size, becoming the primary prey of large adults (> 0.8 m SVL). Notably, reptile prey
remained in the diet in even the largest animals, albeit in small proportions, rather than a complete prey-
type switch.
Page 11/30A gradual shift in diet to increasing prey size and/or diversity, rather than a complete prey switch, is the
norm for most snakes as they grow (e.g. Bryant et al., 2012; de Queiroz et al., 2001; Hampton, 2011;
Shine, 1989; Shine, 1991; Vincent et al., 2004) (Table 4). Less frequently, species of snakes have a distinct
shift in prey type as they grow (Table 4). For example, the green tree python (Morelia viridis) exhibits a
shift from reptiles to birds and mammals, with individuals > 0.75 m SVL almost exclusively feeding on
mammals (Natusch & Lyons, 2012). Similarly, some colubrid watersnakes (e.g., Nerodia erythrogaster and
N. fasciata) switch their diet quite abruptly from small fish to large frogs once they reach a particular
body size (> 0.5 m SVL) (Mushinsky et al., 1982; Vincent et al., 2007).
Page 12/30Table 4
Examples of ontogenetic shifts in diet and skull shape in the Macrostomata.
Ontogenetic diet Ontogenetic skull morphology change Species Reference
change
General increase No significant change in relative skull Agkistrodon Vincent et
in prey size and dimensions piscivorous al. (2004)
diversity
Morelia Shine
spilota (1991)
Distinct shift Not examined Nerodia Mushinsky
(increase) in prey rhombifera et al.
size with SVL (1982)
Nerodia
cyclopion Mushinsky
et al.
Morelia s. (1982)
imbricata
Bryant et
al. (2012)
Positive allometry of trophic bones, jaw muscles Nerodia Vincent et
and gape relative to head length fasciata al. (2007)
Distinct shift in Not examined Nerodia Mushinsky
prey size and type erythrogaster et al.
with SVL (1982)
Thamnophis
validus de Queiroz
et al.
Pseudonaja (2001)
textilis
Shine
(1989)
Positive allometry of trophic bones and gape Morelia Natusch
relative to head length viridis and Lyons
(2012)
Cranium shape change from smooth surfaces to Pseudonaja Present
rugose bones with additional surface area for affinis study
muscle attachment.
Increasing robustness and positive allometry of
trophic bones relative to head length; rotation of
quadrate.
Change in prey size and type, be it gradual or abrupt, can require changes in hunting behaviour and/or
prey handling. Species that completely shift their prey type must often develop a new feeding strategy or
behaviour to suit the different prey type (Eskew et al., 2009; Lind & Welsh Jr., 1994). Even where the
change in diet is gradual, a change in behaviour may be advantageous. As prey get larger, they often
become bulkier and therefore require different handling to manipulate and ingest. Prey may also become
physically stronger or more robust, which can incur more risk of damage to the predator. From our sample
of gut contents in dugites, as well as prey selection, there was evidence of a change in prey handling
Page 13/30technique/feeding behaviour during ontogeny. Smaller dugites swallowed reptile prey tail-first, while
larger snakes swallowed reptiles head-first. This indicates that small snakes may fail to take lizards
before they effectively autotomise their tail (Bateman & Fleming, 2009), while larger and older snakes
have learned how to better handle prey.
Allometric change in skull morphology
Many previous studies of snake diet have inferred changes in skull morphology, such as larger trophic
bones, gape size, jaw mobility and muscular strength, as a requirement for handling and ingesting the
larger prey items as the snakes grow (Bryant et al., 2012; de Queiroz et al., 2001; Mushinsky et al., 1982;
Shine, 1989; Shine, 1991). Very few studies have quantified changes in skull morphology. Those studies
that have demonstrated ontogenetic shifts in both diet and skull morphology predominantly examined
scaling patterns and changes in trophic morphology relative to body size (Hampton, 2011; Natusch &
Lyons, 2012; Vincent et al., 2004; Vincent et al., 2007), but few studies have quantified scaling patterns of
trophic structures relative to head size (Vincent et al., 2007) (Table 4).
In dugites, relative to body size, the shape of the cranium changed as the animals grew. The nasals and
frontals became more elongated and compressed (frontals to a lesser degree), while the braincase
changed from a rounded, smooth and broad form in juveniles to a much more compressed, narrow and
ridged form in adults with a distinct mid-sagittal crest forming on the parietal bone. The posterior section
of the cranium is to where some of the major trophic elements (e.g., quadrate, supratemporal) attach, and
therefore the more obvious changes in shape seen here could reflect the importance of the roles these
bones play in feeding (Vincent et al. 2007). These observations are consistent with previous studies
showing that the general size and shape of back of the cranium is possibly linked to the ingestion of prey
through interactions with these mobile trophic bones (Cundall & Gans, 1979; Dwyer & Kaiser, 1997).
The trophic bone dimensions relative to body size scaled with significant negative allometry, indicating
that juvenile snakes had larger heads relative to their body size when compared with larger, adult snakes.
This negative allometry of head size and trophic elements with body size has been reported in numerous
snake species (King, 2002; King et al., 1999; Vincent et al., 2006a; Vincent et al., 2004), but also more
generally in ectothermic predators such as fish, frogs and lizards (Birch, 1999; Meyers et al., 2018; Richard
& Wainwright, 1995). The skull morphology in smaller (< 0.8 m SVL) dugites is dominated by the relative
size of the braincase and orbits, and thus the negative allometry of the head relative to body size seems
best to reflect constraints imposed by the early development of the brain and sensory organs (Forsman,
1991; King, 2002; Vincent et al., 2006b; Vincent et al., 2006c). Furthermore, juveniles presumably require a
minimum head size to enable feeding.
By contrast to the relationship with overall body size, relative to head length, there was positive allometry
for trophic bones in dugites. This corroborates other studies (Rossman, 1980; Vincent et al., 2007; Vincent
et al., 2006c; Young, 1989). Positive allometry of trophic bones with head size is linked to ontogenetic
shifts in diet found in numerous snake species (Table 4) as larger trophic structures are strongly
correlated with an increase in overall gape size, and the elongation of these bones in particular is
Page 14/30associated with increased mobility (Cundall & Greene, 2000; Scanferla, 2016) and are likely assist with
the capture and ingestion of larger, bulkier prey consumed by larger snakes (Vincent et al., 2006c). In
particular, elongation of the mandible and pterygoid, elongation and rotation of the quadrate, and
extension and enlargement of the supratemporal have been previously linked with the ingestion,
manipulation and processing of large prey in other snake species that have known shifts in diet (Cundall
& Greene, 2000; Hampton, 2011; Scanferla, 2016; Vincent & Mori, 2007).
Ontogenetic allometry is the predictable change in a trait with increasing size during growth - the key
word being predictable - such that a linear regression can estimate this relationship (Huxley, 1932). While
we hypothesised that a distinct shift in diet would coincide in a shift in skull morphology, evidenced by a
change in the allometric relationship (slope), to facilitate feeding on large prey, this was not supported by
our data. Instead, it was positive allometry (‘hyperallometry’) – disproportionate growth rates in particular
dimensions of these bones relative to head size – that facilitates a greater capacity to take larger prey.
While gape is difficult to measure in preserved specimens (Jayne et al., 2018; King, 2002; Vincent et al.,
2007), it can be inferred from positive allometry of these bones that larger snakes have relatively larger
gapes than do smaller snakes, allowing for the ingestion of larger, bulkier prey items. This seems to
coincide with the increased proportion of mammals and large reptiles in the diet of large adult dugites. As
well as the ingestion of prey, gape size is also likely to constrain the size of prey that a snake has the
capacity to envenomate, and thus may also be related to prey choice through this mechanism (Cundall &
Greene, 2000; Hampton, 2011).
The smaller trophic bones (relative to the size of the head) in juveniles limits the maximum prey size that
can be ingested and restricts prey handling ability due to increased handling time to manipulate and
swallow prey items (Shine, 1991; Vincent et al., 2006c; Werner & Gilliam, 1984). Small trophic bones also
impact on the overall skull kinesis, as small bones will have a limited range of movements compared with
longer, more developed jaw bones seen in larger snakes (Cundall & Greene, 2000). This seems to correlate
with the diet of juvenile dugites as they feed almost exclusively on the autonomised tails of skinks and
geckos, prey items that are likely to require very little effort to manipulate and swallow and only simple
snapping action of the jaws would be needed to capture the autonomised tails. A notable finding was
that small dugites had reasonably consistent trophic bone morphology, while larger adults displayed
marked individual variability in trophic bone morphology. The greater variation in trophic bone
dimensions seen in larger adults could be due to greater range of prey sizes and types ingested by larger
snakes and suggests phenotypic (feeding) plasticity (Aubret et al., 2004; Clifton et al., 2020).
Diversity of complex structures, like the skull, is facilitated by their modular structure, where bones can
change in shape and size relatively independently in response to evolutionary selection for different
functions (e.g. Albertson et al., 2005) or developmental plasticity resulting from use (e.g. Aubret et al.,
2004). The kinetic skull of snakes is expected to be especially modular (Andjelković et al., 2017; Rhoda et
al., 2021), with weak statistical covariation between bones. Snakes (along with lizards) display a unique
pattern of modularity in the skull compared with other vertebrates (Watanabe et al., 2019). Diet appears
to be the main factor driving diversity in skull morphology among snakes and other squamates
Page 15/30(Watanabe et al., 2019). Furthermore, differential growth pattern of skull bones, resulting in allometric
shape changes of the skull, is the mechanism by which much of this variation is attained (Da Silva et al.,
2018; Sherratt et al., 2019). Therefore, since many ecological attributes of snakes are intrinsically linked
to body size (Shine 1994a), studies of allometry are powerful in understanding the ecological success
and evolutionary diversity of snakes.
Declarations
Acknowledgements
Thanks to the Western Australian Museum for access to specimens, assistance of the Terrestrial
Collections Officer Rebecca Bray and Herpetology Curator Dr. Paul Doughty, and Anatomy staff at
Murdoch University for their assistance with the storage and preparation of specimens. We acknowledge
the facilities and scientific and technical assistance offered by Ms. Diana Patalwala and Dr Jeremy Shaw
of the National Imaging Facility, at the Centre for Microscopy, Characterisation & Analysis, The University
of Western Australia, a facility funded by the University, State and Commonwealth Governments. Thanks
to Mike Lee for insightful feedback on early versions of the written work. Funding for this study was
provided by the School of Veterinary and Life Sciences, Murdoch University and the Loneragan Family
Scholarship.
Funding
The funding for this study was provided by the School of Veterinary and Life Sciences, Murdoch
University. Additional funds came from the 2017 Loneragan Family Scholarship.
Conflicts of Interest
The authors have no conflict of interest to declare.
Ethics Approval
This study used data that came from road-killed specimens collected from roads in Western Australia
under the Department of Parks and Wildlife’s Regulation 17 license (#SF009895).
Consent to participate
Not Applicable
Consent for Publication
Page 16/30All authors have read and commented on the final version of this manuscript and consent to publication
in its present form.
Availability of Data and Material
Not Applicable
Code Availability
Not Applicable
Authors’ Contributions
M.P. performed data collection for the skull morphology and led writing of the manuscript. A.W.
performed data collection for the diet analysis. All authors conceived the idea of the study and
contributed critically to the drafts and gave final approval for publication.
References
Adams, D.C., Collyer, M.L., Kaliontzopoulou, A. and Sherratt, E. 2018. Geomorph: software for geometric
morphometric analyses, R package v. 3.0. 6: Vienna, Austria: R Foundation.
Adams, D.C. and Nistri, A. 2010. Ontogenetic convergence and evolution of foot morphology in European
cave salamanders (Family: Plethodontidae). BMC Evolutionary Biology, 10: 1-10.
Adams, D.C., Rohlf, F.J. and Slice, D.E. 2013. A field comes of age: geometric morphometrics in the 21st
century. Hystrix, 24: 7-14.
Albertson, R.C., Streelman, J.T., Kocher, T.D. and Yelick, P.C. 2005. Integration and evolution of the cichlid
mandible: the molecular basis of alternate feeding strategies. Proceedings of the National Academy of
Sciences, 102: 16287-16292.
Andjelković, M., Tomović, L. and Ivanović, A. 2016. Variation in skull size and shape of two snake species
(Natrix natrix and Natrix tessellata). Zoomorphology, 135: 243-253.
Andjelković, M., Tomović, L. and Ivanović, A. 2017. Morphological integration of the kinetic skull in
Natrix snakes. Journal of Zoology, 303: 188-198.
Aubret, F., Shine, R. and Bonnet, X. 2004. Adaptive developmental plasticity in snakes. Nature, 431: 261-
262.
Page 17/30Bateman, P.W. and Fleming, P.A. 2009. To cut a long tail short: a review of lizard caudal autotomy studies
carried out over the last twenty years. Journal of Zoology, 277: 1-14.
Bellairs, A. 1968. Reptiles. London UK: Hutchinson and Co.
Bellairs, A. 1969. Feeding and cranial mechanics. In The Life of Reptiles (A. Bellairs, ed), pp. 116-184.
London: Weidenfeld and Nicolson.
Birch, J.M. 1999. Skull allometry in the marine toad, Bufo marinus. Journal of Morphology, 241: 115-126.
Bloom, W. and Fawcett, D.W. 1975. A textbook of histology. Philadelphia: W. B. Saunders Company.
Bryant, G.L., De Tores, P.J., Warren, K.A. and Fleming, P.A. 2012. Does body size influence thermal biology
and diet of a python (Morelia spilota imbricata)? Austral Ecology, 37: 583-591.
Bush, B., Maryan, B., Browne-Cooper, R. and Robinson, D. 2010. Field guide to the reptiles and frogs of the
Perth region. Perth, Western AUstralia: Western Australian Museum.
Camilleri, C. and Shine, R. 1990. Sexual dimorphism and dietary divergence: differences in trophic
morphology between male and female snakes. Copeia, 1990: 649-658.
Cignoni, P., Callieri, M., Corsini, M., Dellepiane, M., Ganovelli, F. and Ranzuglia, G. 2008. Meshlab: an Open-
Source Mesh Processing Tool. Paper presented at the 6th Eurographics Italian Chapter Conference,
Salerno, Italy, 2008.
Clifton, I.A., Chamberlain, J.D. and Gifford, M.E. 2020. Role of phenotypic plasticity in morphological
differentiation between watersnake populations. Integrative Zoology, 15: 329-337.
Collyer, M.L., Sekora, D.J. and Adams, D.C. 2015. A method for analysis of phenotypic change for
phenotypes described by high-dimensional data. Heredity, 115: 357-365.
Cundall, D. and Gans, C. 1979. Feeding in water snakes: an electromyographic study. Journal of
Experimental Zoology 209: 189-207.
Cundall, D. and Greene, H.W. 2000. Feeding in snakes. In Feeding: Form, Function and Evolution in
Tetrapod Vertebrates (K. Schwenk, ed), pp. 293-333. San Diego, CA: Academic Press.
Cundall, D. and Rossman, D.A. 1984. Quantitative comparisons of skull form in the colubrid snake genera
Farancia and Pseudoeryx. Herpetologica, 40: 388-405.
Da Silva, F.O., Fabre, A.-C., Savriama, Y., Ollonen, J., Mahlow, K., Herrel, A., Müller, J. and Di-Poï, N. 2018.
The ecological origins of snakes as revealed by skull evolution. Nature Comm., 9: 1-11.
de Queiroz, A., Henke, C., Smith, H.M. and Guyer, C. 2001. Geographic variation and ontogenetic change in
the diet of the Mexican Pacific lowlands garter snake, Thamnophis validus. Copeia, 2001: 1034-1042.
Page 18/30Dellmann, H.D. 2006. Dellmann's Textbook of Veterinary Histology. Iowa USA: Blackwell Publishing.
Drake, A.G. and Klingenberg, C.P. 2008. The pace of morphological change: historical transformation of
skull shape in St Bernard dogs. Proceedings of the Royal Society B: Biological Sciences, 275: 71-76.
Dwyer, C.M. and Kaiser, H. 1997. Relationship between skull form and prey selection in the thamnophiine
snake genera Nerodia and Regina. Journal of Herpetology, 31: 463-475.
Eskew, E.A., Willson, J.D. and Winne, C.T. 2009. Ambush site selection and ontogenetic shifts in foraging
strategy in a semi‐aquatic pit viper, the Eastern cottonmouth. Journal of Zoology, 277: 179-186.
Forsman, A. 1991. Adaptive variation in head size in Vipera berus L. populations. biological Journal of the
Linnean Society, 43: 281-296.
Hampton, P.M. 2011. Comparison of cranial form and function in association with diet in natricine
snakes. Journal of Morphology, 272: 1435-1443.
Huxley, J.S. 1932. Problems of Relative Growth. London, UK: Methuen & Co. Ltd.
Jacobson, E.R. 2007. Infectious Diseases and Pathology of Reptiles: Color atlas and text. Boca Raton, FL:
CRC Press.
Jayne, B.C., Voris, H.K. and Ng, P.K.L. 2018. How big is too big? Using crustacean-eating snakes
(Homalopsidae) to test how anatomy and behaviour affect prey size and feeding performance. Biological
Journal of the Linnean Society, 123: 636-650.
Kardong, K.V. 2012. Vertebrates: Comparative Anatomy, Function, Evolution. New York: McGraw-Hill.
King, R.B. 2002. Predicted and observed maximum prey size–snake size allometry. Functional Ecology,
16: 766-772.
King, R.B., Bittner, T.D., Queral‐Regil, A. and Cline, J.H. 1999. Sexual dimorphism in neonate and adult
snakes. Journal of Zoology, 247: 19-28.
Klingenberg, C.P. 2016. Size, shape, and form: concepts of allometry in geometric morphometrics.
Development Genes and Evolution, 226: 113-137.
Klingenberg, C.P., Barluenga, M. and Meyer, A. 2002. Shape analysis of symmetric structures: quantifying
variation among individuals and asymmetry. Evolution, 56: 1909-1920.
Legendre, P. 2008. Model II Regression User Guide, R Edition, 2008.
Lind, A.J. and Welsh Jr., H.H. 1994. Ontogenetic changes in foraging behaviour and habitat use by the
Oregon garter snake, Thamnophis atratus hydrophilus. Animal Behaviour, 48: 1261-1273.
Page 19/30Maryan, B. and Bush, B. 1996. The dugite or spotted brown snake (Pseudonaja affinis). Herpetofauna, 26:
22-34.
Meyers, J.J., Nishikawa, K.C. and Herrel, A. 2018. The evolution of bite force in horned lizards: the
influence of dietary specialization. Journal of Anatomy, 232: 214-226.
Mosimann, J.E. and James, F.C. 1979. New statistical methods for allometry with application to Florida
red‐winged blackbirds. Evolution, 33: 444-459.
Mushinsky, H.R., Hebrard, J.J. and Vodopich, D.S. 1982. Ontogeny of water snake foraging ecology.
Ecology, 63: 1624-1629.
Natusch, D.J. and Lyons, J.A. 2012. Relationships between ontogenetic changes in prey selection, head
shape, sexual maturity, and colour in an Australasian python (Morelia viridis). Biological Journal of the
Linnean Society, 107: 269-276.
O'Malley, B. 2005. Snakes In Clinical Anatomy and Physiology of Exotic Species: structure and function of
mammals, birds, reptiles and amphibians, pp. 77-93. Edinburgh, New York: Elsevier Saunders.
Palci, A., Lee, M.S.Y. and Hutchinson, M.N. 2016. Patterns of postnatal ontogeny of the skull and lower
jaw of snakes as revealed by micro-CT scan data and three-dimensional geometric morphometrics.
Journal of Anatomy, 229: 723-754.
R Core Team. 2018. R: A language and environment for statistical computing.
Rhoda, D., Polly, P.D., Raxworthy, C. and Segall, M. 2021. Morphological integration and modularity in the
hyperkinetic feeding system of aquatic‐foraging snakes. Evolution, 75: 56-72.
Richard, B. and Wainwright, P. 1995. Scaling the feeding mechanism of largemouth bass (Micropterus
salmoides): kinematics of prey capture. Journal of Experimental Biology, 198: 419-433.
Rohlf, F.J. and Slice, D. 1990. Extensions of the Procrustes method for the optimal superimposition of
landmarks. Systematic Biology, 39: 40-59.
Romer, A.S. and Parsons, T.S. 1986. The Vertebrate Body. Florida: Saunders College Publishing.
Rossman, C.E. 1980. Ontogenetic changes in skull proportions of the diamondback water snake, Nerodia
rhombifera. Herpetologica, 36: 42-46.
Scanferla, A. 2016. Postnatal ontogeny and the evolution of macrostomy in snakes. Royal Society Open
Science, 3.
Sherratt, E., Sanders, K.L., Watson, A., Hutchinson, M.N., Lee, M.S.Y. and Palci, A. 2019. Heterochronic
shifts mediate ecomorphological convergence in skull shape of microcephalic sea snakes. Integrated
Comparative Biology, 59: 616-624.
Page 20/30Shine, R. 1989. Constraints, allometry, and adaptation: Food habits and reproductive biology of Australian
brownsnakes (Psuedonaja: Elapidae). Herpetologica, 45: 195-207.
Shine, R. 1991. Why do larger snakes eat larger prey items? Functional Ecology, 5: 493-502.
Shine, R. 1994a. Allometric patterns in the ecology of Australian snakes. Copeia, 1994: 851-867.
Shine, R. 1994b. Sexual size dimorphism in snakes revisited. Copeia, 1994: 326-346.
Shine, R. and Schwaner, T. 1985. Prey constriction by venomous snakes: a review, and new data on
Australian species. Copeia, 1985: 1067-1071.
StatSoft Inc. 2007. Statistica (data analysis software system), version 8.0. www.statsoft.com. . Tulsa OK,
USA.
Vincent, S., Dang, P., Herrel, A. and Kley, N. 2006a. Morphological integration and adaptation in the snake
feeding system: a comparative phylogenetic study. Journal of Evolutionary Biology, 19: 1545-1554.
Vincent, S.E., Herrel, A. and Irschick, D.J. 2004. Ontogeny of intersexual head shape and prey selection in
the pitviper Agkistrodon piscivorus. Biological Journal of the Linnean Society, 81: 151-159.
Vincent, S.E., Moon, B.R., Herrel, A. and Kley, N.J. 2007. Are ontogenetic shifts in diet linked to shifts in
feeding mechanics? Scaling of the feeding apparatus in the banded watersnake Nerodia fasciata.
Journal of Experimental Biology, 210: 2057-2069.
Vincent, S.E., Moon, B.R., Shine, R. and Herrel, A. 2006b. The functional meaning of “prey size” in water
snakes (Nerodia fasciata, Colubridae). Oecologia, 147: 204-211.
Vincent, S.E. and Mori, A. 2007. Determinants of feeding performance in free-ranging pit-vipers (Viperidae:
Ovophis okinavensis): key roles for head size and body temperature. Biological Journal of the Linnean
Society, 93: 53-62.
Vincent, S.E., Vincent, P.D., Irschick, D.J. and Rossell, J.M. 2006c. Do juvenile gape‐limited predators
compensate for their small size when feeding? Journal of Zoology, 268: 279-284.
Watanabe, A., Fabre, A.-C., Felice, R.N., Maisano, J.A., Müller, J., Herrel, A. and Goswami, A. 2019.
Ecomorphological diversification in squamates from conserved pattern of cranial integration.
Proceedings of the National Academy of Sciences, 116: 14688-14697.
Werner, E.E. and Gilliam, J.F. 1984. The ontogenetic niche and species interactions in size-structured
populations. Annual Review of Ecology and Systematics, 15: 393-425.
Wiley, D.F., Amenta, N., Alcantara, D.A., Ghosh, D., Kil, Y.J., Delson, E., Harcourt‐Smith, W., Rohlf, F.J., St.
John, K., Hamann, B., Motani, R., Frost, S., Rosenberger, A.L., Tallman, L., Disotell, T. and O'Neill, R. 2007.
University of California, Davis: Institute for Data Analysis and Visualization.
Page 21/30Wolfe, A.K., Bateman, P.W. and Fleming, P.A. 2017. Does urbanization influence the diet of a large snake.
Current Zoology, 64: 311-318.
Young, B.A. 1989. Ontogenetic changes in the feeding system of the red‐sided garter snake, Thamnophis
sirtalis parietalis. I. Allometric analysis. Journal of Zoology, 218: 365-381.
Appendices
Detailed Micro-CT scanning conditions
The following are the main conditions set in the Skyscanner Micro-CT used for all specimens.
Two main stages were involved in getting from raw x-ray images to a 3D model of the skull. The first
stage was reconstructing the raw x-ray images into cross section images that make up a 3D volume
(tomograph). The reconstruction program used for this first step was NRecon v1.7.1.0, which takes the
raw x-ray projection images and produces a dataset of cross section slices which can then be assembled
together as a whole 3D volume. The second stage involved visualising the NRecon slices and producing
the 3D surface model of the skull and for the unstained bone scan data, this was done using CT-Analyser
v1.17.7.2. Details for the processing steps followed for each of these programs are as follows:
NRecon Processing:
1. Raw x-ray projection images are imported into NRecon
2. Adjust start and end points of dataset to exclude any slices that lie outside of sample
3. Preview a slice and adjust size of Region of Interest around sample (choosing slices where sample is
widest to ensure all of sample is contained within)
4. Manually adjust the reconstruction parameters such as misalignment compensation and ring
artefact reduction (keep parameter values as consistent as possible across scans) to improve
contrast and remove artefacts.
5. In Output window, set minimum image range to 0, select desired destination folder and save files as
16-bit TIFF format
6. Begin reconstruction of single dataset or add dataset to batch and reconstruct multiple datasets at
once.
CT-An Processing: The program is divided into a 5-page structure but only 4 pages of this structure were
needed for processing the dugite skull datasets and these were the steps followed:
1. NRecon dataset imported into CT-An
2. In the first page, Raw Images, unnecessary slices are removed by selecting the top and bottom slices
to be used in the vertical range of interest in the dataset
Page 22/303. The second page, the ROI (region of interest) page- allows you to free-hand draw or adjust a fixed
shape around the selected region want to focus on, exclude unnecessary space/areas of slice don’t
want to include in 3D model.
4. Once finalised an ROI, save the ROI files and load as new dataset so only working from selected
region in next steps.
5. In the third page, Binary Selection, binary images are displayed on a Histogram and the maximum
and minimum threshold values can be selected to obtain best contrast level, can preview what pixels
removed at different ranges of threshold values.
6. The fifth page, which is the Custom Processing page allows you to apply multiple operations from a
number of different analysis modules (called plug-ins) to a dataset.
7. For the dugite skull dataset, 3 plug-ins were used- Thresholding, Despeckle and 3D Model.
8. Thresholding plug-in: Following values chosen in Binary Selection page, select upper and lower
threshold values as well as the thresholding method. E.g. global thresholding (which was used for
dugite datasets) involves setting fixed range of greyscales for white pixels.
9. Despeckle: allows for various processing options to select or reject certain objects based on their
size. The “remove white speckles” option was used to remove any white objects (created from
thresholding) above or below a specified number of voxels. This helped to remove dirt particles, food
items or other elements not connected to the skull.
10. 3D model: creates a 3D surface-rendered model of the thresholded dataset. The double time cubes
algorithm was chosen to create the 3D models and files were saved in the stanford triangle format
(PLY).
11. Once the options within these plug-ins were set, they were applied to the data (separately to each
specimen dataset or to multiple datasets using the batch mode option) and the 3D surface models
of the skulls were produced for each specimen.
Figures
Page 23/30Figure 1
3D models of dugite (Pseudonaja affinis) skulls in (a, d) dorsal, (b, e) lateral, and (c, f) ventral views
showing landmark locations and linear measurements taken. Models a-c depict the locations of the 61
landmarks used for examining cranium shape. Models d-f depict the locations of the linear
measurements taken on trophic bones (plus head length) and landmarks placed there (see Table 1 for
descriptions of each linear measurement).
Page 24/30Figure 2
Diet composition for n = 161 dugites (Pseudonaja affinis) with food present in their stomachs. The
barplots show the proportions of total prey mass in individuals of (a) autotomised reptile tails, (b) small
reptiles (100mm SVL) against snake’s body size (snout-
vent length; SVL).
Page 25/30Figure 3 The orientation of reptile prey taken by dugites (Pseudonaja affinis) grouped into three size categories (n of snakes shown in brackets). Asterisks indicate level of significance ** p
Figure 4

Multivariate Regressions demonstrating ontogenetic allometry of the skull against body size (log10-
transformed SVL; m) for n=46 dugites (Pseudonaja affinis). (a) Regression scores for cranium shape
(Procrustes residuals), (b) Regression scores for trophic bone dimensions (log-shape ratios). Filled grey
squares are males, filled black dots are females and unfilled points are those whose sex was
undetermined.

                                                 Page 27/30
Figure 5
Changes in cranium shape through ontogenetic growth for n=46 dugites (Pseudonaja affinis) relative to
body size (SVL). Lollipop diagrams show landmark positional changes representing change in cranium
morphology from a juvenile shape (red dot) to adult shape (end of yellow lollipop tail) presented in (a)
dorsal, (b) lateral and (c) ventral views. Length of lollipop tail indicates the magnitude of change, and
angle indicates direction of change. For reference, layered underneath is an image of the smallest juvenile
Page 28/30specimen (landmark positions approximate). The largest magnitude of change that can be seen is medial
translation of the posterior-dorsal landmarks indicating the negative allometry of the size of the cranium
relative to the trophic regions of the skull.
Figure 6
Slope estimates from RMA regressions of trophic bone dimensions against log10-transformed (a) SVL
and (b) head length for n=46 dugites (Pseudonaja affinis), showing the slope (allometric coefficient) and
95% confidence intervals. Colours show isometry (light grey symbols) and negative (blue) or positive (red)
allometry. Abbreviations are indicated in Table 1. Further details of these regressions are shown in
supplementary material Table 2.
Page 29/30Figure 7
Changes in linear dimensions of the trophic bones through ontogenetic growth for n=46 dugites
(Pseudonaja affinis) relative to body size (SVL), as given by their regression score. The main trophic
bones of the skull are illustrated on a (a) juvenile and (b) adult. (c) A barplot of the regression scores for
the log-shape ratios of the trophic bones, coloured as in (a) and (b), illustrates how each measurement
changes relative to all others, and with body size (log-transformed SVL).
Page 30/30You can also read