Phyllotaxis: is the golden angle optimal for light capture?
←
→
Page content transcription
If your browser does not render page correctly, please read the page content below
Research

Phyllotaxis: is the golden angle optimal for light capture?
 oren Strauss1*
S€                            , Janne Lempe1*                 , Przemyslaw Prusinkiewicz2, Miltos Tsiantis1 and Richard S. Smith1,3
1
Department of Comparative Development and Genetics, Max Planck Institute for Plant Breeding Research, Cologne 50829, Germany; 2Department of Computer Science, University of
Calgary, Calgary, AB T2N 1N4, Canada; 3Present address: Cell and Developmental Biology Department, John Innes Centre, Norwich Research Park, Norwich, NR4 7UH, UK

                                                            Summary
Author for correspondence:                                   Phyllotactic patterns are some of the most conspicuous in nature. To create these patterns
Richard S. Smith                                            plants must control the divergence angle between the appearance of successive organs,
Tel: +49 221 5062 130
                                                            sometimes to within a fraction of a degree. The most common angle is the Fibonacci or golden
Email: smith@mpipz.mpg.de
                                                            angle, and its prevalence has led to the hypothesis that it has been selected by evolution as
Received: 7 May 2019                                        optimal for plants with respect to some fitness benefits, such as light capture.
Accepted: 24 June 2019
                                                             We explore arguments for and against this idea with computer models. We have used both
                                                            idealized and scanned leaves from Arabidopsis thaliana and Cardamine hirsuta to measure
New Phytologist (2020) 225: 499–510                         the overlapping leaf area of simulated plants after varying parameters such as leaf shape, inci-
doi: 10.1111/nph.16040                                      dent light angles, and other leaf traits.
                                                             We find that other angles generated by Fibonacci-like series found in nature are equally

Key words: computer simulation,                             optimal for light capture, and therefore should be under similar evolutionary pressure.
heteroblasty, light capture, phyllotaxis, plant              Our findings suggest that the iterative mechanism for organ positioning itself is a more
fitness.                                                    likely target for evolutionary pressure, rather than a specific divergence angle, and our model
                                                            demonstrates that the heteroblastic progression of leaf shape in A. thaliana can provide a
                                                            potential fitness benefit via light capture.

                                                                                                  several other divergence angles associated with Fibonacci-like
Introduction
                                                                                                  sequences, albeit not as prevalent, such as the Lucas angle of
Two key questions in biology are to understand how biological                                     c. 99.5° and the first anomalous sequence angle of c. 151.14°
patterns emerge and what their physiological functions are. Phyl-                                 (Jean, 1994). Additionally, other spiral patterns have been
lotaxis, the arrangement of plant organs around a central axis, is                                observed, where organs initiate in pairs or triplets and the diver-
an example of a highly structured pattern that has fascinated biol-                               gence angle is a half or a third of the golden angle. Light harvest-
ogists and mathematicians for centuries; for a review, see Adler                                  ing is also modulated independent of organ divergence angle.
et al. (1997). This fascination is largely attributable to the obser-                             Many plants exhibit substantial genetically programmed age-de-
vation that emerging organs are often arranged into a spiral, with                                pendent variation in leaf shape that could conceivably influence
the divergence angle between consecutive organs close to the                                      light capture. Environmental fluctuations in light quality play a
Fibonacci or golden angle of c. 137.5°. Though there has been                                     role as well, with many plants responding rapidly by altering their
considerable progress in understanding the morphogenetic basis                                    leaf and shoot growth to avoid shade (Novoplansky et al., 1990;
of this geometrically conspicuous pattern (Reinhardt et al., 2003;                                Smith & Whitelam, 1997; Franklin, 2008; Fankhauser &
J€onsson et al., 2006; Smith et al., 2006a; Besnard et al., 2014),                                Christie, 2015). The multitude of phyllotactic patterns seen in
the physiological functions or consequences of phyllotaxis, and                                   nature, together with evidence that other factors, both genetic
how those might have influenced its evolution, are poorly under-                                  and environmental, can affect light capture, challenges the idea
stood. One hypothesis is that spiral phyllotaxis evolved to opti-                                 that the golden angle represents a fundamental light-harvesting
mize leaf spacing on the growing apex, thereby maximizing                                         optimum constraining evolution of phyllotactic patterns, as
interception of light for photosynthesis, and by implication                                      favored by Niklas (1998) and Valladares & Brites (2004). To
thereby maximizing plant fitness (Niklas, 1998; Pearcy & Yang,                                    evaluate the hypothesis that selection for maximizing light cap-
1998; King et al., 2004).                                                                         ture has underpinned the evolution of the golden or other diver-
   This idea is appealing; and if true, the prevalence of the golden                              gence angles, we have developed a computer simulation model of
angle in nature could be attributed to optimal light capture.                                     plant light capture.
However, there are several indications that optimal light capture                                    Several methods have been used in this context to assess the
is unlikely to be the predominant driver for the evolution of the                                 light-harvesting ability of plants with simulation models. For
golden angle. First, spiral phyllotaxis can also develop from                                     example, Niklas (1988, 1998) developed a model in which light
                                                                                                  arriving at different angles was simulated to account for the dif-
*These authors contributed equally to this work.                                                  ferent positions of the sun. Although he found a global maximum

Ó 2019 The Authors                                                                                                                     New Phytologist (2020) 225: 499–510     499
New Phytologist Ó 2019 New Phytologist Trust                                                                                                   www.newphytologist.com
This is an open access article under the terms of the Creative Commons Attribution License, which permits use,
distribution and reproduction in any medium, provided the original work is properly cited.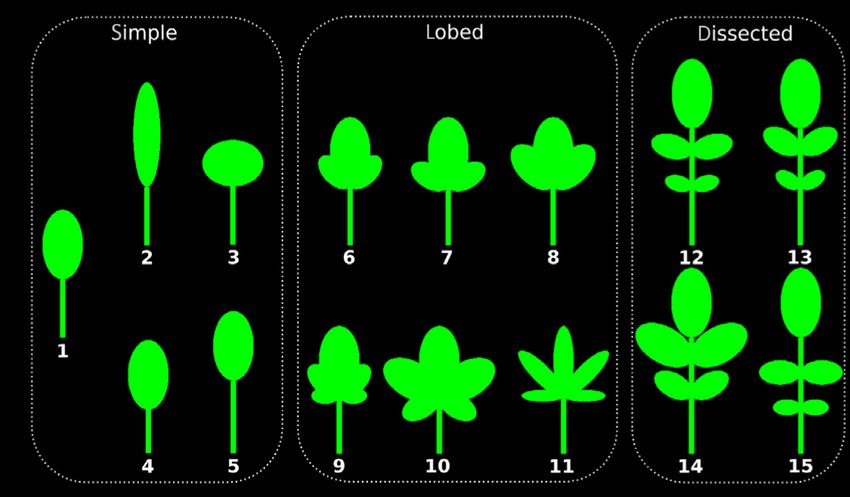
New
500 Research                                                                                                                           Phytologist

    of light capture when leaves were placed at the golden angle, he        successive leaves were placed at a fixed divergence angle h around
    argued that other morphological features not correlated with the        the central axis. Most of the simulations considered only direct
    divergence angle, such as leaf shape and petiole length, could          light. The total light capture was calculated by using a parallel
    compensate for less than ideal angles. Pearcy & Yang (1998) ana-        projection of the leaves onto a plane orthogonal to the direction
    lyzed the light capture of Adenocaulon bicolor, a redwood forest        of the incoming light. If the viewing direction was considered to
    understory plant. They used an elaborate method based on                be the position of the light source, then the resulting image gave
    canopy photographs, taking into account diffuse light combined          a two-dimensional projection of the leaves as seen from the light
    with occasional direct light coming from gaps in the forest             source. The projection plane was then divided into pixels, and
    canopy. They also found a global maximum for light capture              the pixels covered by the leaf in the frame buffer were summed
    close to the golden angle, suggesting it is optimal. King et al.        up to determine the total light capture (Takenaka, 1994). This
    (2004) defined a shadow function for each leaf, which was used          made it straightforward to calculate light capture when parame-
    to approximate the shading effects of upper leaves on the lower         ters such as divergence angle, angle between the leaf petiole and
    ones, taking into account a decrease in the shading effect with         stem, leaf shape, and the angle of incoming light are changed. A
    distance. They compared their model with the empirical results          further advantage of the method was visual verification, since the
    presented by Pearcy & Yang (1998) and reported a good fit to            actual projection used for calculating the light capture model
    the data. They also suggested that the golden angle was selected        could be monitored as the simulation progressed (Fig. 1b). In our
    by evolution as ideal for light capture. By contrast, Valladares &      simulation, we used OPENGL (v.3.0) renderings of the images
    Brites (2004) suggested that the divergence angle had little influ-     with an orthographic projection and a frame buffer resolution of
    ence on light capture compared with other morphological traits,         1600 9 1600.
    except in the case of opposite phyllotaxis, where it would be               Idealized A. thaliana leaves were composed using a rectangle as
    detrimental by increasing leaf overlap. Sarlikioti et al. (2011)        the petiole with a length of 1.0 and a width of 0.1 in arbitrary
    reported a similar result by modeling tomato plants, where leaf         units. Attached to this rectangle was an ellipse simulating the leaf
    angle or leaf length influenced light capture but the divergence        lamina. The length of the leaf was defined by the (major) radius
    angle had little effect.                                                of 0.6 and the width by the (minor) radius of 0.35. These pro-
       An alternative explanation for the prevalence of the golden          portions closely resemble the actual leaf shape of an adult
    angle might be developmental constraints, if, for example, it           A. thaliana leaf (see Fig. 1a). For the simulations we used ideal-
    arises as part of a favorable mechanism for organ packing at the        ized plants with up to 30 leaves. In order to simulate the develop-
    shoot apex (Maynard Smith et al., 1985; Beldade & Brakefield,           mental change in leaf size at different nodes, the size of the
    2002). Further, though the idea that leaf spacing can help opti-        idealized leaves in the model increased linearly, whereas the shape
    mize light capture is intuitive, the fitness consequences of            remained unchanged (Fig. 1b). As the idealized leaves do not cap-
    increased light capture in field conditions are not always clear.       ture heteroblasty, which is the change in leaf shape over develop-
    For example, excess light can cause stress by overheating or pho-       mental time (Poethig, 1990, 2013; Willmann & Poethig, 2011),
    totoxicity, suggesting that any potential beneficial effects of organ   we used scanned leaves in some of our simulations.
    spacing on light capture are likely to be conditional rather than           We defined two unitless measures for quantifying light cap-
    universal (Osmond et al., 1987).                                        ture. To visualize the progression of light capture with increasing
       Here, we re-examine the effect of leaf divergence angle on light     number of leaves, we defined the light capture area (LCA), which
    capture by employing a computational model to examine the effi-         is the ratio of leaf area exposed to the light source to the total area
    ciency of light capture for all of the common and the not-so-           of all of the leaves at the final stage of the simulation (with the
    common angles observed in nature. We use simulations of plants          maximum number of leaves). We also used the light capture effi-
    bearing idealized leaves of different shapes, such as simple, lobed,    ciency (LCE), which is defined as the ratio of the leaf area
    and dissected, as well as leaf scans of Arabidopsis thaliana, which     exposed to the light to the current total leaf area of the plant at a
    has simple leaves, and Cardamine hirsuta, which has dissected           given stage. Note that the two measures are the same for the full
    leaves with leaflets. With the models, we tested the interplay          number of leaves in a given simulation.
    between leaf shape variation and light capture under different
    developmental and environmental circumstances.
                                                                            Plant growth conditions and leaf image acquisition
                                                                            We used scanned leaves of A. thaliana Col FRI flc-3 (Michaels &
    Materials and Methods
                                                                            Amasino, 1999) and C. hirsuta NILOx (Cartolano et al., 2015)
                                                                            plants as input for computer simulations. Plants were grown in
    Computer simulation model of light capture
                                                                            Hettich ESP PRC1700 growth cabinets under short-day condi-
    A simulation model of plant light capture was developed using           tions (8 h : 16 h, light : dark cycles) at a light intensity of
    both idealized leaves and digitized A. thaliana and C. hirsuta          180 lmol m 2 s 1, at 20°C during day and 18°C during night.
    leaves. The model was programmed in C++ using vertex–vertex                They were harvested when they reached a comparable develop-
    systems (Smith et al., 2003) within the VLAB modeling environ-          mental stage with 30  2 leaves visible by eye. Leaves were
    ment (Federl & Prusinkiewicz, 1999). Plant models were gener-           mounted on white paper using spray glue and digitized with an
    ated by using images of idealized or scanned leaf shapes, where         Epson V700 Photo scanner at 600 dpi (Hettich Benelux B.V.,

    New Phytologist (2020) 225: 499–510                                                                                           Ó 2019 The Authors
    www.newphytologist.com                                                                                New Phytologist Ó 2019 New Phytologist Trust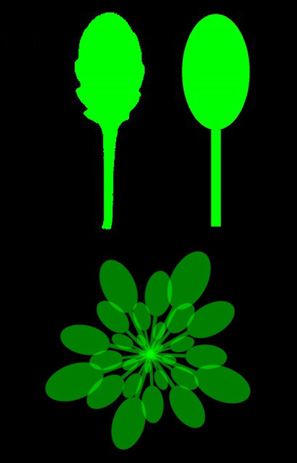
New
Phytologist                                                                                                                                                        Research 501

                             (a)                             (c)                    Light capture
                                                                                     1
                                                                                    0.9
                                                                                    0.8

                                                               Light capture area
                                                                                    0.7
                                                                                    0.6
                                                                                    0.5
                                                                                    0.4
                             (b)
                                                                                    0.3
                                                                                    0.2
                                                                                    0.1
                                                                                     0
                                                                                          0   20     40    60   80    100    120   140   160   180
                                                                                                          Divergence angle (deg)
Fig. 1 (a) Scanned adult Arabidopsis thaliana leaf 13 compared with our idealized model leaf. (b) Simulated plant with idealized leaves. The leaves increase
linearly in size and were rendered with transparency to visualize the overlapping leaf areas. (c) The light capture curve shows the light capture area (LCA)
of simulated idealized plants with two (light green curve) to 30 (darkest green) leaves with different divergence angles. This measure is normalized by the
total leaf area of the plant with 30 leaves; therefore, the LCA increases for plants with more leaves. The graph for angles between 180° and 360° would be
a mirror image, but otherwise identical. In plants with a higher leaf number, the divergence angle becomes more important to avoid overlapping leaves and
thus a loss in light capture. The graph shows very distinct minima at angles of common fractions (e.g. 120° = ⅓) and maxima at angles produced by the
irrational fractions of the golden angle of 137.5° or related angles such at the Lucas angle of 99.5°, the second and third accessory angles of 77.96° and
64.08°, and the first and second anomalous angles of 151.14° and 158.14° (see red markers). For a complete overview of all maxima and minima, see
Supporting Information Tables S1 and S2; see also Marzec & Kappraff (1983) and Jean (1994).

Geldermalsen, Netherlands). Obvious artifacts, like bending or                                         The light capture curve showed that the golden angle of
ruptures in leaves, were removed from leaf images using Adobe                                       137.5° indeed optimizes the LCE of the idealized plant. How-
PHOTOSHOP. One representative sample per species was used for                                       ever, our model identified many other maxima that provide an
the comparison of the computer simulations of idealized leaves                                      equally good LCE. The shape of the curves in Fig. 1(c) is qualita-
with actual leaves from Arabidopsis and Cardamine. For the heter-                                   tively similar to the effect of the divergence angle on the packing
oblasty simulations, we used the leaves of all eight Arabidopsis                                    efficiency of a regular lattice (Marzec & Kappraff, 1983). The
replicates.                                                                                         maxima correspond to divergence angles associated with other
                                                                                                    Fibonacci-like sequences generated by beginning the sequence
                                                                                                    with different starting pairs of integers. Examples are the Lucas
Results
                                                                                                    sequence at 99.5°, which starts with (1, 3), or the first anomalous
                                                                                                    sequence of 151.14°, which begins with (2, 5) (see Table S1).
Effects of phyllotaxis on light capture
                                                                                                    Although not as common as 137.5°, the Lucas and first anoma-
To investigate the light capture potential of plants with all theo-                                 lous divergence angles do appear relatively frequently in nature
retically possible divergence angles, we developed a computa-                                       (Jean, 1994). Our simulations confirm that the golden angle of
tional model that allows the simulation of plants with 1–30                                         137.5° is indeed an optimal angle; however, there are many other
idealized leaves (Fig. 1a,b) with divergence angles from 0° to                                      angles that can be generated by Fibonacci-like sequences that are
180° in steps of 0.25° (Supporting Information Video S1). The                                       also optimal with respect to light capture. Note that the positions
leaf size was linearly increased over time; and since the light                                     of minima in the graphs are associated with angles represented by
source was placed directly above the plant, internode length was                                    fractions of the full angle with small denominators (less than leaf
neglected. We next plotted the LCA of the simulated plant                                           number); for example, ½ 9 360° = 180° or ⅓ 9 360° = 120°
against the divergence angle, generating a ‘light capture curve’                                    (Table S2). The common property of all the optimal angles is
(Fig. 1c). Note that the light capture curve only measures the leaf                                 that they are not close to angles made by fractions with small
area exposed to the light as an approximation for the ability of                                    denominators, which cause leaves to shade each other.
different phenotypes to capture light and is not intended to
express fitness in the broad sense. As leaves were added to the                                     Light capture of plants with bijugate phyllotaxis Plants that
simulation, the graph showed an increase in LCA and also                                            show multijugate patterns of phyllotaxis initiate more than one
became more complex, which can also be seen when normalizing                                        organ at a time in whorls of equally spaced organs. In bijugate
the light capture leaf area to the total area, plotted as LCE                                       patterns, opposite pairs of organs are initiated simultaneously.
(Fig. S1A). This can be explained by a higher importance of the                                     The simplest example of this is decussate phyllotaxis, as is
divergence angle in plants with higher leaf numbers, as the poten-                                  observed in the vegetative shoot of Antirrhinum, where successive
tial loss from a nonoptimal angle becomes higher due to an                                          pairs of leaves are placed in the center between the previous pair;
increase in leaf overlap.                                                                           that is, with a divergence angle of 90°. However, spiral bijugate

Ó 2019 The Authors                                                                                                                        New Phytologist (2020) 225: 499–510
New Phytologist Ó 2019 New Phytologist Trust                                                                                                     www.newphytologist.com
New
502 Research Phytologist
patterns also exist, with successive whorls placed at a fixed diver- Reorientation of leaves is also observed as a reaction to shading
gence angle (< 90°) from the previous pair. The most common by competing plants (Franklin, 2008). Nevertheless, in environ-
spiral bijugate pattern is Fibonacci spiral bijugate phyllotaxis, ments with very diffuse light, plants often have horizontal leaves
where pairs of organs appear at the divergence angle of c. 68.75°, (Givnish, 1988) and even distichous phyllotaxis (Givnish, 1995),
which is approximately half the golden angle (Jean, 1994). In the suggesting that these traits may be of less importance when direct
subsequent series of simulations we examined how the divergence light is not in abundance. The subsequent simulations explored
angle influences the light capture in such plants. The simulation the influence of the light angle and of traits such as leaf shape and
setup was identical, but instead of placing one leaf at a time we petiole length on the light capture ability (Niklas, 1998).
placed a pair of opposite leaves up to the total number of 30
leaves (or 15 pairs). The light capture curve was generated by Angle of incident light The sun moves across the sky during the
varying the divergence angle between the pairs from 0° to 90°. course of a day. Hence, the area of the plant that is directly
The shape of the resulting light capture curve looked almost exposed to the sun changes significantly. We simulated this effect
identical to the single organ, with all angles divided by 2 by changing the location of the light source in our model, by
(Fig. S1B). Significant minima could be found at 60° and 90°, placing it at angles of 30°, 45° and 60° from the vertical axis.
and maxima at 50.25° (approximately half of Lucas) and 68.75° Then we simulated an idealized plant with 30 leaves and diver-
(approximately half of Fibonacci). Similar to the previous simula- gence angles ranging from 0° to 180° and compared the resulting
tions, the halved golden angle was just one out of many angles that light capture curves with the one from the first simulation.
maximized the LCE, and again the minima generated by low-de- The results showed that plants received less light with higher
nominator fractional angles dominated the light capture curve. angles but that the overall shape of the light capture curve was
Similar results were obtained with higher whorl sizes, such as for independent of the incident light angle (Fig. 2a). The different
trijugate phyllotaxy, where the extrema in the divergence angles values for the angle of the incoming light simply act as a scaling
have a third of the values of the original light capture curve. factor for the light capture ability and efficiency and do not influ-
ence the relative optimality of the divergence angles, as all values
are scaled equally by a factor < 1.
Leaf traits affecting light capture
The simulations so far considered only horizontal leaves with the Leaf angle In addition to the angle of incident light, the angle
light source directly above the plant. In nature the angle of inci- between the leaves and the stem can vary. In previous simulations
dent light and the angle between the leaf and the stem vary. this angle was set to 90° (i.e. the leaves were placed flat around
(a)
Angle of incident light
1.0
BL (0°)
0.8
30°
0.6
LCE
45°
0.4
60°
0.2
0.0 Fig. 2 The influence of geometric parameters
0 20 40 60 80 100 120 140 160 180 on light capture on an idealized plant with 30
leaves. The red lines are the results from the
(b) Leaf angle baseline (BL) simulation of Fig. 1 using 30
1.0 leaves. (a) The influence of the angle of
BL (90°) incoming light on light capture efficiency
0.8
60° (LCE). The LCE decreases with increasing
0.6
LCE
incident angle; however, the overall shape of
45°
0.4 the graph remains unchanged. (b) The
0.2 30° influence of leaf angle on LCE. With
0.0 decreasing angle between leaves and the
0 20 40 60 80 100 120 140 160 180 stem the LCE decreases globally, becomes
smoother, and shows fewer local maxima
(c) Internode length and minima. (c) The influence of internode
length on the light capture curve. Here, the
1.0
BL* baseline is an idealized plant with 30 leaves
0.8 and an angle of incident light of 15° and a
2x
LCE
0.6 leaf angle of 75° (BL*). The internode length
0.4 4x was constant and equal to two, four, or six
0.2 6x times the length of the smallest leaf, resulting
0.0 in a stem size of almost two, four, or six times
0 20 40 60 80 100 120 140 160 180 the length of the largest leaf, respectively.
The divergence angle becomes less important
Divergence angle (deg) with increasing internode length.
New Phytologist (2020) 225: 499–510 Ó 2019 The Authors
www.newphytologist.com New Phytologist Ó 2019 New Phytologist TrustNew
Phytologist Research 503
the stem). In this simulation, we tested the influence of leaf incli- becoming smoother with less minima and maxima as the con-
nation by placing the leaves at angles of 60°, 45° and 30° from tribution from older leaves is diminished (compare Figs 1c,
the stem, with the light source placed directly overhead. S2B).
The light capture curve again showed characteristics similar
to when the angle of the incident light was varied. Increasing
Effect of leaf shape on light capture
the leaf angle caused the LCE to decrease globally (Fig. 2b),
confirming previous results (Falster et al., 2003; Bongers et al., It is expected that leaf shape would also have an influence on the
2014). Moreover, the curve became smoother, leading to a light capture ability of a plant. For instance, broader leaf blades
reduction in the number of maxima and minima for a given and shorter petioles should lead to an increased leaf overlap and
number of leaves. Nevertheless, the frequency and size of the therefore to smaller LCE (Takenaka, 1994; Niklas, 1998). To
optimal divergence angles with ideal light capture fitness was test the influence of these traits, we simulated idealized plants
unaltered. with varying leaf shapes, complexity, and petiole length while
other simulation parameters were unchanged.
Internode length Another parameter is the length of the stem
between successive leaves; that is, the internode length. With a Leaf shape and petiole length We changed the parameters of
light source placed directly above the plant, the internode length the ellipse that define the leaf blade to manipulate the overall leaf
does not have an effect on the leaf area directly exposed to light. shape while keeping the leaf complexity low. Multiplying the
Thus, in order to test the influence of the internode length in a long axis by a factor of 3/2 and the short axis by 2/3, relative to
situation where light is not directly overhead, we set the angle of our default idealized leaf, led to elongated, slimmer leaf blades,
incoming light to 15° and the leaf angle to 75°. We simulated whereas the opposite led to shorter, broader leaf blades (see
three different internode length settings between successive Fig. 3a1–3). For the simulation with varying petiole lengths we
leaves: constant, linearly increasing, and increasing following a used idealized leaves with identical simple leaf shapes as in the
logistic function. The differences between the three different set- first simulation, and factors for the petiole lengths of 1.25, 0.75,
tings were negligible (see Fig. S2C). When the internode length and 0.50 (see Fig. 3a4,5).
was small, there was only a minor influence on the overall light The resulting light capture curve of simulated plants with
capture curve, creating a curve with slightly higher minima and different simple leaf shapes is again influenced mainly by the
lower maxima (Fig. 2c). With longer internodes the light capture angles at small fractions, where local minima could be found
curve was ‘equalized’: minima became less deep and maxima (Fig. 3b). However, there are some noteworthy differences
decreased, so that the overall importance of the divergence angle between the results produced with different leaf shapes. Slim-
decreased. mer leaf blades yield narrower ‘valleys’ in the curve. Their
local minima are lower and their maxima are higher than the
Translucency When simulating translucency by using a standard leaf, and they show a lower total overlapping area.
blending function, we found that the effect of translucent This suggests that plants with slimmer leaf blades have a
leaves was negligible and had little influence on the overall potential gain due to a leaf shape that prevents overlap. By
shape of the light capture curve, and the minima and max- contrast, plants with broader leaf blades have an overall lower
ima angles remained the same (see Fig. S2A). With the curve, but it is much smoother as it increases the minima
LCE normalized to the total area times the transparency fac- and decreases the maxima. For such plants, the light capture
tor, the LCE was increased as additional light from overlap- stays more or less stable around their maxima.
ping leaves was harvested. If the LCE was normalized to the The results for different petiole lengths were comparable to
total area assuming full light capture, then the LCE was the previous simulation that varied leaf shape. A longer peti-
greatly reduced except in the areas of significant overlap, ole led to lower overall overlapping area and more pro-
where it almost approaches the nontransparent values. The nounced maxima and minima (Fig. 3c). By contrast,
former case would correspond to the situation where the simulations with a shorter petiole showed a smoother light
photosynthetic capacity of translucent leaves is saturated, so capture curve with fewer local maxima and minima and
that light passing through is not a loss, whereas in the latter strongly increased overlap; thus, it is not surprising that this
case any light passing through the leaf is lost. In nature, it trait is strongly regulated by the light environment in many
is likely that the plant operates somewhere between these species (Bongers et al., 2014; Pierik & de Wit, 2014). In con-
two extremes. trast to simulations with varying simple leaf shapes, a longer
petiole was always beneficial in terms of LCE, when com-
Photosynthetic decrease Leaves of different ages do not nec- pared with a shorter petiole, as the leaf is placed further away
essarily contribute equally to photosynthesis and carbon gain from the stem and is less likely to overlap with other leaves.
(Thomas, 2013). We simulated the effect of aging in our An interesting comparison with the leaf angle simulations can
model by linearly reducing the photosynthetic capacity in be made. A change in the leaf angle ‘virtually’ decreases the
older leaves while keeping the youngest leaves at full capacity. petiole length and changes the aspect ratio of the leaf. Thus,
We found that this had a similar effect to the plant having a the results from the leaf angle simulation can be explained by
smaller number of leaves, with the light capture curve a combination of these two factors.
Ó 2019 The Authors New Phytologist (2020) 225: 499–510
New Phytologist Ó 2019 New Phytologist Trust www.newphytologist.comNew
504 Research Phytologist
(a)
(b) Simple leaf shape (c) Simple leaf petiole length
BL (a1) Narrow (a2) Broad (a3) BL (a1) +25% (a5) -25% (a4) -50%
1.0 1.0
0.8 0.8
0.6 0.6
LCE
LCE
0.4 0.4
0.2 0.2
0.0 0.0
0 20 40 60 80 100 120 140 160 180 0 20 40 60 80 100 120 140 160 180
(d) Leaf complexity (e) Leaflet size
Simple (a1) Lobed (a6) Dissected (a12) BL* (a12) +50% +25% -25%
1.0 1.0
0.8 0.8
0.6 0.6
LCE
LCE
0.4 0.4
0.2 0.2
0.0 0.0
0 20 40 60 80 100 120 140 160 180 0 20 40 60 80 100 120 140 160 180
(f) Lobe angle (g) Lobe size
No Lobes (BL/a1) 30° 45° 60° No Lobes (BL/a1) Small Large
1.0 1.0
0.8 0.8
0.6 0.6
LCE
LCE
0.4 0.4
0.2 0.2
0.0 0.0
0 20 40 60 80 100 120 140 160 180 0 20 40 60 80 100 120 140 160 180
Divergence angle (deg) Divergence angle (deg)
Although it might be beneficial for LCE to increase petiole might negatively influence photosynthetic surface area. Neverthe-
length and decrease leaf width, both traits could affect the overall less, overall, it is reasonable to expect that diversification of these
plant fitness in a negative way. For instance, an excessively long leaf traits in natural environments might have conditionally con-
petiole might reduce mechanical stability, and a too narrow leaf tributed to plant fitness (Takenaka, 1994).
New Phytologist (2020) 225: 499–510 Ó 2019 The Authors
www.newphytologist.com New Phytologist Ó 2019 New Phytologist TrustNew
Phytologist Research 505
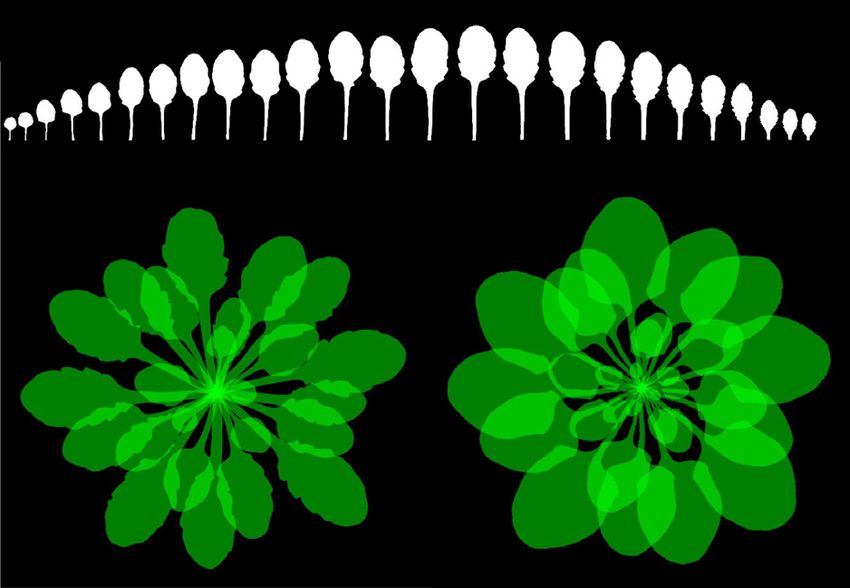
Fig. 3 The influence of leaf shape on light capture. (a) Examples of model leaves used in the simulation. In comparison with the baseline leaf from Fig. 1
(a1, red line in all graphs), we altered leaf length and width (a2, a3) and petiole length (a4, a5). To produce more complex leaf shapes we added one pair
of lobes (a6–a8), two pairs of lobes (a9–a11), and leaflets (a12–a15) with different sizes and angles. (b) When changing the simple leaf shape, the light
capture efficiency (LCE) plot for a narrower leaf (a2) shows more detail and lower minima but higher maxima, whereas for a broader leaf (a3) the opposite
was observed. (c) Longer petioles (a5) globally improved the LCE, whereas a shorter petiole (a4) significantly increased the overlapping leaf area, and the
curve becomes smoother. (d) Comparison of leaves with different complexity: simple (a1), lobed (a6), and dissected (a12). Leaf complexity itself had only a
minor effect on the light capture curve. (e) Effect of leaflet size on dissected leaves. Indicated values are changes in the ellipse axes lengths of the leaflets.
Larger leaflets lower the achievable maximum LCE and also equalize the maxima, whereas the minima are not affected. (f) The effect of the lobe angle of a
leaf with two pairs of lobes which had sizes of 60% and 40% of the size of the central ellipse. Indicated angles are the ones of the first lobe pair with
double the value for the second lobe pair. With increasing angle, the LCE is decreased and maximum values are smoothed out. (g) Here, the angles were
held constant (at 45°) and the sizes of the lobes varied (small: similar to (f); large: + 50% ellipse axes of lobes). This had a similar effect as increasing the
angles: larger lobes decreased and smoothed the LCE curve.
Overall, we concluded that variation in leaf shape from lobes
Complex leaf shapes The leaf blade of simple leaf shapes can be
or leaflets did not play a significant role in optimizing the diver-
approximated with a single ellipse; however, in nature,
gence angle for light capture.
more complex leaf shapes with serrations, lobes, and leaflets are
common. To test whether our previous simulation results were
Examining the effect of leaf heteroblasty
representative for such leaf shapes, we studied more complex ide-
alized leaf shapes composed of several ellipses that were acting as The idealized simple leaves used thus far in our models were
lobes when attached at the base of the leaf blade and overlapping designed to look similar to adult A. thaliana leaves, with a simple
with the central ellipse, thus forming a larger lobed leaf. Dis- linear size scaling. Though these capture the simple geometric
sected leaves were created by extending the petiole and adding leaf shape of A. thaliana well, they do not take into account the
leaflets by attaching additional ellipses further down the petiole leaf shape change due to heteroblasty. To assess how heteroblastic
not connected to the central ellipse. By varying these ellipses in shape changes affect light capture, we used scans of entire sets of
number, size, and angle we were able to cover a large range of leaves of A. thaliana as input for our model (see Fig. 4a; Video
possible leaf shapes from complex to dissected leaves (see Fig. 3a). S2).
Since the LCE and LCA are normalized by total area, and the We compared the LCE of a simulated plant without shape
increase in leaf size in the simulations is linear, differences in leaf change and continuous increase in leaf size with digitized leaves
area for the various shapes do not affect the results. Note that the with heteroblastic shape and size change (Figs 1b, 4b). For both
simulated dissected leaf shapes closely resemble the leaf shape of models, we used the same number of leaves. The light capture
C. hirsuta, a relative of A. thaliana that is an attractive model for curve with digitized leaves was almost the same as for idealized
comparative development studies (Fig. 3a12; Hay & Tsiantis, leaves (Fig. S4A). This supports the idea that the general shape of
2006; Vlad et al., 2014; Gan et al., 2016). the graph – more specifically, the locations of the minima and
The results of the simulations are shown in Figs 3 and S3. maxima – is not sensitive to heteroblastic changes in leaf shape.
Complex leaves with larger lobes or leaflets broaden the leaf, However, one difference was that the idealized plant reached
which leads to an increase in overlap and a significantly lower higher LCE values for optimal divergence angles, which was
achievable LCE, similar to the effect observed in simple broad caused by its linearly increasing leaf size. In comparison the later
leaves (Fig. 3d). For leaves with large lobes, the light capture leaves from the scans were smaller as they were not fully
curve was smoothened for angles that are close to a maximum, expanded. This was also true when comparing idealized dissected
but minima were unaffected (Fig. 3g). We observed a similar leaves (Fig. 3a12) with scanned leaves of C. hirsuta (Fig. S4b,c).
effect when the angle between main axis of the leaf and the axis In the heteroblastic shape, the first leaves referred to as juvenile
of the lobe ellipse (‘lobe angle’, Fig. 3f) was increased. These are smaller and rounder than later adult leaves (Fig. 4a; Will-
results were slightly more pronounced when two pairs of ellipses mann & Poethig, 2011). The physiological relevance of these leaf
were added than for a simpler leaf shape with only one pair of form differences is unclear, but one possibility is that they help to
ellipses (Fig. S3A,B). If the width of all leaf ellipses was scaled by maximize light capture at different stages of the plant’s develop-
a factor of 0.5 (‘slim lobes’) the pattern in the light capture curve ment. Motivated by this hypothesis, we explored how the shapes
was more noisy for different sizes and angles of lobes (Fig. S3C, observed at different developmental times might influence light
D). capture in our computational framework. Using scanned leaf
In dissected leaves, we also explored the effect of leaflet size, images of eight biological replicates, we simulated plants by tak-
angle, and position. Increasing the leaflet size yielded a ing the leaf shape of one particular leaf, replicated it 30 times,
smoothened light capture curve around maxima but did not and scaled it to the actual leaf length. An example is shown in
affect minima (Fig. 3e). Changing the angle of the petiole or Fig. 4(c) for leaf 3. This scenario would be equivalent to a plant
the position of the leaflets along the petiole had very minor regulating only the size of the leaf and not the shape. Comparing
effects (Fig. S3E,F). Notably, leaflet placement further away those simulated plants, we found that plants that are entirely
from the center of the plant appeared to positively influence made of juvenile leaves or very late leaves have a poor LCE com-
LCE. pared with plants with mature leaves. Plants composed of adult
Ó 2019 The Authors New Phytologist (2020) 225: 499–510
New Phytologist Ó 2019 New Phytologist Trust www.newphytologist.comNew
506 Research Phytologist
(a)
(b) (c)
Fig. 4 The influence of heteroblasty on the
light capture efficiency (LCE) of Arabidopsis
thaliana. (a) Digitized leaves of an
A. thaliana plant used for light capture
simulation. (b) Model output using digitized
A. thaliana leaves placed at a divergence
angle of 137.5°. The simulated plant is
shown with transparent leaves in order to
highlight the overlapping area. (c) Simulated
plant consisting of leaves with the shape of
digitized leaf 3 from the same plant scaled to
the actual leaf length. (d) LCE of simulated
A. thaliana plants consisting of only one leaf
type (blue bars represent average values of
eight plants with their SE) compared with the
(d) * * * (e) 0.07
average value of the same wild-type plants
with heteroblasty (dashed red line). The
0.90 0.06 single-leaf-type plants show reduced LCE for
0.85 0.05 juvenile and very late leaves, but improved
0.04 light capture for adult leaves 13–19 (*,
LCA
LCE
0.80 P < 0.05 using a t-test comparing the results
0.03 of the single-leaf-type plants and the wild-
0.75
0.02 type plants). (e) The heteroblasty yielded a
0.70 0.01 larger light capture area (LCA) for the first
0.65 few leaves (red line) compared with the
0.00
1 3 5 7 9 11 13 15 17 19 21 23 25 1 2 3 4 5 single-leaf-type plants (green line, difference
in orange), possibly giving the young plants
Leaf number used for simulation Number of leaves an advantage.
leaves (leaves 10–22), however, show similar or improved light five leaves and shows that plants consisting of only one leaf
capture compared with the full heteroblastic series (Fig. 4d). type have practically identical values of LCA, which is a result
Juvenile leaves are rounder and very late leaves have a short peti- of the scaling of those leaves and the absence of leaf overlap.
ole, both traits that increase the overlap (as also confirmed in the The values for the full heteroblastic series are considerably
earlier simulations). By contrast, the shape of adult leaves yields higher, showing an average increase of 32% in LCA for the
excellent LCE, with later leaves fitting almost perfectly into the first five leaves and 24% for the first 10 leaves.
gaps in between earlier leaves, which shows that there is a high The effects of heteroblastic progression for A. thaliana light
variability in LCE between the different leaf shapes of the heter- capture appear to be two-fold: First, the broader, rounder juve-
oblastic series of A. thaliana. nile leaves fill up available space quicker than their adult counter-
This observation begs the question as to why, from a light parts, thus increasing light capture at early stages of plant
capture perspective, A. thaliana does not just make adult- development. Second, as leaf number increases, the progression
shaped leaves from the start. To explore this issue, we consid- towards the narrower and more elongate adult shape helps
ered how the light capture ability changes over developmental A. thaliana to reduce leaf overlap and consequent self-shading.
time. We analyzed the LCA of the previously simulated plants Later in development, leaves become smaller as the plant transi-
consisting of only a single leaf shape of the heteroblastic tions to flowering (Willmann & Poethig, 2011), although a por-
series. We observed that differences between the simulated tion of the effect in the later leaves shown in Fig. 4(a) is due to
plants only occurred for c. 15 or more leaves (Fig. S5), as with the staging of the samples.
fewer leaves there was almost no overlapping leaf area. More-
over, we found that the last leaves to be added did not con-
Effect of noise in phyllotactic patterns on light capture
tribute much to the total LCA, as these latest leaves almost
entirely overlapped earlier leaves. This was particularly notice- In nature, the mechanisms generating leaf phyllotaxis are subject
able for the leaf shapes with the lowest LCE (juvenile and to noise from a variety of sources. For example, in A. thaliana, c.
very late). Fig. 4(e) shows the graph zoomed in on the first 20% of the leaves deviate at least 15° from the default divergence
New Phytologist (2020) 225: 499–510 Ó 2019 The Authors
www.newphytologist.com New Phytologist Ó 2019 New Phytologist TrustNew
Phytologist Research 507
(a)
LCE under noise (b) LCE change under noise
0.95 N0 N1 N3 N5 N10 N20 N30 N40 N50
0
0.90
–5
0.85
LCE change (%)
–10
LCE
0.80
–15
0.75
–20
0.70
–25
0.65
N0 N1 N3 N5 N10 N20 N30 N40 N50 –30
Simple Dissected
Simple Dissected
Fig. 5 The influence of noise in the divergence angle on the light capture efficiency (LCE) of the idealized simple-leaved plant (light red bars, leaf from
Fig 3a1) compared with the idealized dissected-leaved plant (dark green, leaf from Fig. 3a12). (a) The results in the different conditions. (b) The difference
to the no noise condition. The different simulations are named Nx, where x stands for the SD of the normally distributed noise that was added to the
divergence angle of 137.5°. We simulated 1000 plants in each condition, and the mean results and their SDs are displayed.
angle of 137.5° (Peaucelle et al., 2007). Consequently, in our of noise and subsequently lost more LCE in high noise condi-
next simulation, we tested how noise affects leaf overlap. tions. However, the simple-leaved plant has a much higher LCE
We simulated plants consisting of the previously tested simple, under the no noise condition (Fig. 5a).
lobed and dissected leaf shapes (see Fig. 3a) for their sensitivity It is likely that the high resistance to noise observed in dis-
towards noise. In each condition we conducted 1000 simulations sected leaves is caused by the overall smoother light capture curve
using the golden angle (137.5°) and applied normally distributed that they showed compared with simple leaves (Fig. 3d). This
noise with a mean of zero and different standard deviations (up smoother curve has two effects. First, it leads to a reduced effect
to 50), which was added as deviation from the default final diver- of angle deviations on LCE. Second, there is a lower potential to
gence angle for each leaf. All of the leaf positions in a simulation lose light capture since the distance between maxima and minima
were first calculated and then noise applied, so that noise in the is smaller than the one found in LCE curves of simple leaves.
divergence for one leaf did not affect subsequent leaves. In our
comparison of simple (Fig. 3a1) vs dissected (Fig. 3a12) leaf
Conclusion
blades, we also tested the most common divergence angles other
than the golden angle (99.5° and 151.1°). We found that the dif- In our first simulations we used virtual rosette plants with a leaf
ferent angles had no effect, so we only show the results for the shape idealized from A. thaliana to gain insight into the nature of
golden angle of 137.5°. the light capture ability of plants in relation to the divergence
Overall, increasing noise resulted in a worse LCE across all the angle and leaf shape. Our simulations confirmed previous results
different conditions. The results showed only a small influence by showing that the golden angle of 137.5° is indeed optimal for
for most leaf parameters (see Fig. S6A,B) except simple vs dis- light capture and that morphological traits can influence the light
sected leaves, which showed a substantial difference (Fig. 5). capture curve. However, with a finer sampling of angles from 0°
Moreover, we found similar results for simulations using scanned to 180° (resolution of 0.25°) our results also showed that there
leaves of A. thaliana and C. hirsuta (see Fig. S6C,D). Within our are many other divergence angles with comparable fitness based
parameter space tested, we found only minor differences in how on light capture ability. Thus, the golden angle cannot really be
plants with different simple leaves are affected by noise. Plants seen as ‘the’ global maximum in terms of LCE, but is rather one
with broader leaf blades showed a lower loss for small values of of many optimal angles.
noise, which might be due to the fact that in those plants leaves Traits such as petiole length, leaf shape, leaf complexity, and
already show significant overlap without noise and their light leaf angle all quantitatively change the effective light capture;
capture curve is smoother around maxima. Plants with narrower however, the overall shape of the curve largely remains
leaf blades or longer petioles showed slightly less relative LCE loss unchanged. This is also true for varying environmental condi-
in the high noise conditions. tions, such as the angle of incident light. A notable exception is
Plants with lobed and dissected leaves were more resistant to the internode length. Long internodes can substantially alter the
noise, with only minor losses up to the N10 condition, whereas light capture curve and enable plants to achieve little leaf overlap
plants with simple leaves showed higher losses as soon as at N5 with nonoptimal angles, such as those associated with smaller
(Fig. 5b). Plants with simple leaves showed significantly more leaf fractions, such as ½ = 90° or ⅓ = 120°. The low LCE of those
overlap than their dissected leaf counterparts under the influence angles for plants with short internodes, however, might explain
Ó 2019 The Authors New Phytologist (2020) 225: 499–510
New Phytologist Ó 2019 New Phytologist Trust www.newphytologist.comNew
508 Research Phytologist
the scarcity of rosette plants with decussate patterns. Hence, our morphogens (Thornley, 1975; Veen & Lindenmayer, 1977;
results for the divergence angle remain valid mainly for rosette Mitchison, 1981), contact pressure (Adler, 1974), or polar auxin
plants, such as A. thaliana, or plants with short stems (Bell & transport (J€onsson et al., 2006; Smith et al., 2006a; Heisler et al.,
Bryan, 1991). 2010). All of these models share the central principle that spiral
In nature, the divergence angle in plants is prone to noise (Bes- phyllotaxis results from a spacing mechanism superimposed on a
nard et al., 2014). Our results demonstrate that this noise affects radially symmetric growing domain (Heisler & J€onsson, 2006).
the leaf overlap, and therefore the light capture ability. We also This simple idea, along with a few variations, is able to produce
showed that leaf shape can influence a plant’s robustness to noise. almost all of the phyllotactic patterns observed in nature (Douady
Plants with simple leaves, like A. thaliana, that produce very little & Couder, 1992; Yotsumoto, 1993; Smith et al., 2006b).
overlap and show very distinct maxima in the light capture curve Since phyllotaxis results from spacing organs on a growing
need better control of the divergence angle or any advantage is domain, the patterning process is intimately connected to the
lost. By contrast, dissected leaves, such as in C. hirsuta, have a dynamic nature of plant organ development. As plants are sessile,
higher leaf overlap but were more robust to noise. they must adapt their body plan to their surroundings. Instead of
The similarity in the light capture curve between a real specifying the body plan in the embryo, plants are producing
A. thaliana plant and our idealized model plant suggests that organs from growing shoot tips throughout their life. Operating
minor differences in leaf shape have little impact on overall light on this domain, a simple spacing mechanism often self-organizes
capture. Nonetheless, we found that the heteroblastic leaf shape organ positioning into phyllotactic spirals, with the specific angle
change in A. thaliana has an effect on the LCE. It appears to be chosen likely related to conditions when the pattern is first estab-
beneficial for A. thaliana to make initial leaves broader, rounder lished (Douady & Couder, 1992; Smith et al., 2006b). Thus, a
in shape, and with a shorter petiole in order to quickly achieve a more appropriate way to frame the question of what evolutionary
large leaf area as the plant is being established. Later in develop- forces shape phyllotaxis might be to focus on why spiral phyl-
ment the leaf shape progresses to an elongated form with longer lotaxis rather than on the particular case of why 137.5°. One pos-
petioles, likely in order to minimize the overlapping leaf area and sibility is that the mechanism under selection is able to produce
thus maximize light capture. Similar observations were made by approximately optimal light capture (or packing) with a simple
Zotz et al. (2002) with the tropical plant Vriesea sanguinolenta. spacing mechanism from a growing plant tip. Even though this
Their simulations of adult plants with juvenile leaves also led to may lead to several possibilities for the divergence angle, the fit-
an increased leaf overlap. These results are not specific to the par- ness outcome is similar, as simulations with the various spiral
ticular divergence angle that is typical for A. thaliana, and this phyllotaxis angles all had relatively equal light capture. Thus, our
also holds for other optimal angles related to other Fibonacci-like data are consistent with the idea that the mechanism of iterative
sequences. organ initiation, which yields spiral phyllotaxis, might be preva-
Previous studies explored the question of whether the golden lent owing to developmental accessibility and stability rather than
angle was optimal for light capture (Jean, 1994; Niklas, 1998; reflecting optimization of a particular divergence angle (Good-
King et al., 2004). However, most previous studies and simula- win, 2009). Overall, our findings highlight the importance of
tions did not cover the whole range of possible divergence angles, considering the interplay of developmental constraints and
so their conclusions are in that sense incomplete (e.g. Takenaka, potential fitness benefits for the emergence of developmental pat-
1994; Niklas, 1998; Pearcy & Yang, 1998). Here, we have shown terns or complex traits (Gould, 2002; Sorrells et al., 2015).
that many divergence angles are just as efficient for light capture;
for example, the relatively common Lucas angle of 99.5° or the
Acknowledgements
angle associated with the anomalous sequence of 151.14° (Jean,
1994). For LCE, the most important characteristic of the diver- We thank Adam Runions, Burghard Herrmann, and Sheila
gence angle seems to be to simply avoid suboptimal regions, such McCormick for discussions and critical reading and comments
as the minima around angles generated by low denominator frac- on the manuscript. Funding for this research is gratefully
tions, such as 90° or 120°. Although this might explain why dif- acknowledged from the Swiss National Science Foundation
ferent plants have different divergence angles, the appearance of Interdisciplinary Grant CR3213_143833 and SystemsX.ch
different angles on the same plant raises the question as to how ‘Plant Growth’ Research and Technology Development Grant to
any specific angle could be optimized in response to selective RSS, Human Frontier Science Program grant RGP0008/2013 to
pressures. To answer this question, it is important to consider RSS, Natural Sciences and Engineering Research Council of
how phyllotactic patterns are formed. Canada Discovery Grant RGPIN-2014-05325 to PP, and a core
Theories for how phyllotaxis patterning occurs date back to grant by the Max Planck Society to MT.
Hofmeister (1868), who proposed that new plant organ primor-
dia appear as far away as possible from the boundaries of existing
Author contributions
primordia. Since then, numerous simulation models of phyl-
lotaxis have been proposed that are based on different levels of PP, MT, and RSS planned and designed the research. JL per-
abstraction of this idea. These models range from very general formed experiments. SS performed computational simulations.
inhibition models (Douady & Couder, 1992; Smith et al., SS, JL, and RSS wrote the manuscript with input from the other
2006b) to more mechanistic models based on diffusible authors. SS and JL contributed equally to this work.
New Phytologist (2020) 225: 499–510 Ó 2019 The Authors
www.newphytologist.com New Phytologist Ó 2019 New Phytologist TrustNew
Phytologist Research 509
J€onsson H, Heisler MG, Shapiro BE, Meyerowitz EM, Mjolsness E. 2006. An
ORCID auxin-driven polarized transport model for phyllotaxis. Proceedings of the
National Academy of Sciences, USA 103: 1633–1638.
Janne Lempe https://orcid.org/0000-0002-3890-6997 King S, Beck F, L€ uttge U. 2004. On the mystery of the golden angle in
Richard S. Smith https://orcid.org/0000-0001-9220-0787 phyllotaxis. Plant, Cell & Environment 27: 685–695.
S€oren Strauss https://orcid.org/0000-0002-1825-0097 Marzec C, Kappraff J. 1983. Properties of maximal spacing on a circle related to
phyllotaxis and to the golden mean. Journal of Theoretical Biology 103: 201–
226.
Maynard Smith J, Burian R, Kauffman S, Alberch P, Campbell J, Goodwin B,
References Lande R, Raup D, Wolpert L. 1985. Developmental constraints and
evolution: a perspective from the Mountain Lake Conference on Development
Adler I. 1974. A model of contact pressure in phyllotaxis. Journal of Theoretical and Evolution. Quarterly Review of Biology 60: 265–287.
Biology 45: 1–79. Michaels SD, Amasino RM. 1999. FLOWERING LOCUS C encodes a novel
Adler I, Barabe D, Jean RV. 1997. A history of the study of phyllotaxis. Annals of MADS domain protein that acts as a repressor of flowering. Plant Cell 11: 949–
Botany 80: 231–244. 956.
Beldade P, Brakefield PM. 2002. The genetics and evo–devo of butterfly wing Mitchison GJ. 1981. Theories of biological pattern formation – the polar
patterns. Nature 3: 442–452. transport of auxin and vein patterns in plants. Philosophical Transactions of the
Bell AD, Bryan A. 1991. Plant form: an illustrated guide to flowering plant Royal Society of London B: Biological Sciences 295: 461–471.
morphology. New York, NY, USA: Oxford University Press. Niklas KJ. 1988. The role of phyllotactic pattern as a ‘developmental constraint’
Besnard F, Refahi Y, Morin V, Marteaux B, Brunoud G, Chambrier P, Rozier on the interception of light by leaf surfaces. Evolution 42: 1–16.
F, Mirabet V, Legrand J, Laine S et al. 2014. Cytokinin signalling inhibitory Niklas KJ. 1998. Light harvesting ‘fitness landscapes’ for vertical shoots with different
fields provide robustness to phyllotaxis. Nature 505: 417–421. phyllotactic patterns. In: Jean RV, Barabe D, eds. Symmetry in plants. Singapore:
Bongers FJ, Evers JB, Anten NPR, Pierik R. 2014. From shade avoidance World Scientific Publishing, 759–773.
responses to plant performance at vegetation level: using virtual plant Novoplansky A, Cohen D, Sachs T. 1990. How portulaca seedlings avoid their
modelling as a tool. New Phytologist 204: 268–272. neighbours. Oecologia 82: 490–493.
Cartolano M, Pieper B, Lempe J, Tattersall A, Huijser P, Tresch A, Darrah PR, Osmond CB, Austin MP, Berry JA, Billings WD, Boyer JS, Dacey JWH, Nobel
Hay A, Tsiantis M. 2015. Heterochrony underpins natural variation in PS, Smith SD, Winner WE. 1987. Stress physiology and the distribution of
Cardamine hirsuta leaf form. Proceedings of the National Academy of Sciences, plants. BioScience 37: 38–48.
USA 112: 10539–10544. Pearcy RW, Yang W. 1998. The functional morphology of light capture and
Douady S, Couder Y. 1992. Phyllotaxis as a physical self-organized growth carbon gain in the redwood forest understorey plant, Adenocaulon bicolor
process. Physical Review Letters 68: 2098. Hook. Functional Ecology 12: 543–552.
Falster DS, Westoby M, Falster DS. 2003. Leaf size and angle vary widely across Peaucelle A, Morin H, Traas J, Laufs P. 2007. Plants expressing a miR164-
species: what consequences for light interception? New Phytologist 158: 509–525. resistant CUC2 gene reveal the importance of post-meristematic maintenance
Fankhauser C, Christie JM. 2015. Plant phototropic growth. Current Biology 25: of phyllotaxy in Arabidopsis. Development 134: 1045–1050.
R384–R389. Pierik R, de Wit M. 2014. Shade avoidance: phytochrome signalling and other
Federl P, Prusinkiewicz P. 1999. VIRTUAL LABORATORY: an interactive software aboveground neighbour detection cues. Journal of Experimental Biology 65:
environment for computer graphics. Proceedings of Computer Graphics 2815–2824.
International 242: 93–100. Poethig RS. 1990. Phase change and the regulation of shoot morphogenesis in
Franklin KA. 2008. Shade avoidance. New Phytologist 179: 930–944. plants. Science 250: 923–930.
Gan X, Hay A, Kwantes M, Haberer G, Hallab A, Dello Ioio R, Hofhuis H, Poethig RS. 2013. Vegetative phase change and shoot maturation in plants.
Pieper B, Cartolano M, Neumann U et al. 2016. The Cardamine hirsuta Current Topics in Developmental Biology 105: 125–152.
genome offers insight into the evolution of morphological diversity. Nature Reinhardt D, Pesce E-R, Stieger P, Mandel T, Baltensperger K, Bennett M,
Plants 2: 16167. Traas J, Friml J, Kuhlemeier C. 2003. Regulation of phyllotaxis by polar auxin
Givnish TJ. 1988. Adaptation to sun and shade: a whole-plant perspective. transport. Nature 426: 255–260.
Australian Journal of Plant Physiology 15: 63–92. Sarlikioti V, De Visser PHB, Marcelis LFM. 2011. How plant architecture
Givnish TJ. 1995. Plant stems: biomechanical adaptation for energy capture and affects light absorption and photosynthesis in tomato: towards an ideotype for
influence on species. In: Gartner BL, ed. Plant stems: physiology and functional plant architecture using a functional–structural plant model. Annals of Botany
morphology. San Diego, CA, USA: Academic Press, 3–49. 108: 1065–1073.
Goodwin B. 2009. Beyond the Darwinian paradigm: understanding biological Smith C, Prusinkiewicz P, Samavati F. 2003. Local specification of surface
forms. In: Ruse M, Travis J, eds. Evolution: the first four billion years. subdivision algorithms. Applications of Graph Transformations with Industrial
Cambridge, MA, USA: Harvard University Press, 299–312. Relevance: Second International Workshop, AGTIVE 2003, vol. 3062 of
Gould SJ. 2002. The structure of evolutionary theory. Cambridge, MA, USA: Lecture Notes in Computer Science. Berlin, Germany: Springer-Verlag, 313–
Harvard University Press. 327.
Hay A, Tsiantis M. 2006. The genetic basis for differences in leaf form between Smith H, Whitelam GC. 1997. The shade avoidance syndrome: multiple
Arabidopsis thaliana and its wild relative Cardamine hirsuta. Nature Genetics 38: responses mediated by multiple phytochromes. Plant, Cell & Environment 20:
942–947. 840–844.
Heisler MG, Hamant O, Krupinski P, Uyttewaal M, Ohno C. 2010. Alignment Smith RS, Guyomarc’h S, Mandel T, Reinhardt D, Kuhlemeier C,
between PIN1 polarity and microtubule orientation in the shoot apical Prusinkiewicz P. 2006a. A plausible model of phyllotaxis. Proceedings of the
meristem reveals a tight coupling between morphogenesis and auxin transport. National Academy of Sciences, USA 103: 1301–1306.
PLoS Biology 8: e1000516. Smith RS, Kuhlemeier C, Prusinkiewicz P. 2006b. Inhibition fields for
Heisler MG, J€ onsson H. 2006. Modeling auxin transport and plant phyllotactic pattern formation: a simulation study. Canadian Journal of Botany
development. Journal of Plant Growth Regulation 25: 302–312. 84: 1635–1649.
Hofmeister WFB. 1868. Allgemeine Morphologie der Gew€a chse, Handbuch der Sorrells TR, Booth LN, Tuch BB, Johnson AD. 2015. Intersecting transcription
Physiologischen Botanik (W Engelmann, Ed.). Leipzig, Germany: W. networks constrain gene regulatory evolution. Nature 523: 361.
Engelmann. Takenaka A. 1994. Effects of leaf blade narrowness and petiole length on the light
Jean RV. 1994. Phyllotaxis: a systemic study in plant morphogenesis. Cambridge, capture efficiency of a shoot. Ecological Research 9: 109–114.
UK: Cambridge University Press.
Ó 2019 The Authors New Phytologist (2020) 225: 499–510
New Phytologist Ó 2019 New Phytologist Trust www.newphytologist.comYou can also read