Ontogenetic origins of cranial convergence between the extinct marsupial thylacine and placental gray wolf
←
→
Page content transcription
If your browser does not render page correctly, please read the page content below
ARTICLE
                  https://doi.org/10.1038/s42003-020-01569-x                OPEN

                  Ontogenetic origins of cranial convergence
                  between the extinct marsupial thylacine and
                  placental gray wolf
1234567890():,;

                  Axel H. Newton            1,2,3 ✉,   Vera Weisbecker           4,   Andrew J. Pask2,3,5 & Christy A. Hipsley                  2,3,5 ✉

                  Phenotypic convergence, describing the independent evolution of similar characteristics,
                  offers unique insights into how natural selection influences developmental and molecular
                  processes to generate shared adaptations. The extinct marsupial thylacine and placental gray
                  wolf represent one of the most extraordinary cases of convergent evolution in mammals,
                  sharing striking cranial similarities despite 160 million years of independent evolution. We
                  digitally reconstructed their cranial ontogeny from birth to adulthood to examine how and
                  when convergence arises through patterns of allometry, mosaicism, modularity, and inte-
                  gration. We find the thylacine and wolf crania develop along nearly parallel growth trajec-
                  tories, despite lineage-specific constraints and heterochrony in timing of ossification. These
                  constraints were found to enforce distinct cranial modularity and integration patterns during
                  development, which were unable to explain their adult convergence. Instead, we identify a
                  developmental origin for their convergent cranial morphologies through patterns of mosaic
                  evolution, occurring within bone groups sharing conserved embryonic tissue origins. Inter-
                  estingly, these patterns are accompanied by homoplasy in gene regulatory networks asso-
                  ciated with neural crest cells, critical for skull patterning. Together, our findings establish
                  empirical links between adaptive phenotypic and genotypic convergence and provides a
                  digital resource for further investigations into the developmental basis of mammalian
                  evolution.

                  1 School of Biomedical Sciences, Monash University, Melbourne, VIC, Australia. 2 School of BioSciences, The University of Melbourne, Melbourne, VIC,

                  Australia. 3 Department of Sciences, Museums Victoria, Melbourne, VIC, Australia. 4 College of Science and Engineering, Flinders University, Adelaide, SA,
                  Australia. 5These authors contributed equally: Andrew J. Pask, Christy A. Hipsley. ✉email: axel.newton@monash.edu; christy.hipsley@unimelb.edu.au

                  COMMUNICATIONS BIOLOGY | (2021)4:51 | https://doi.org/10.1038/s42003-020-01569-x | www.nature.com/commsbio                                              1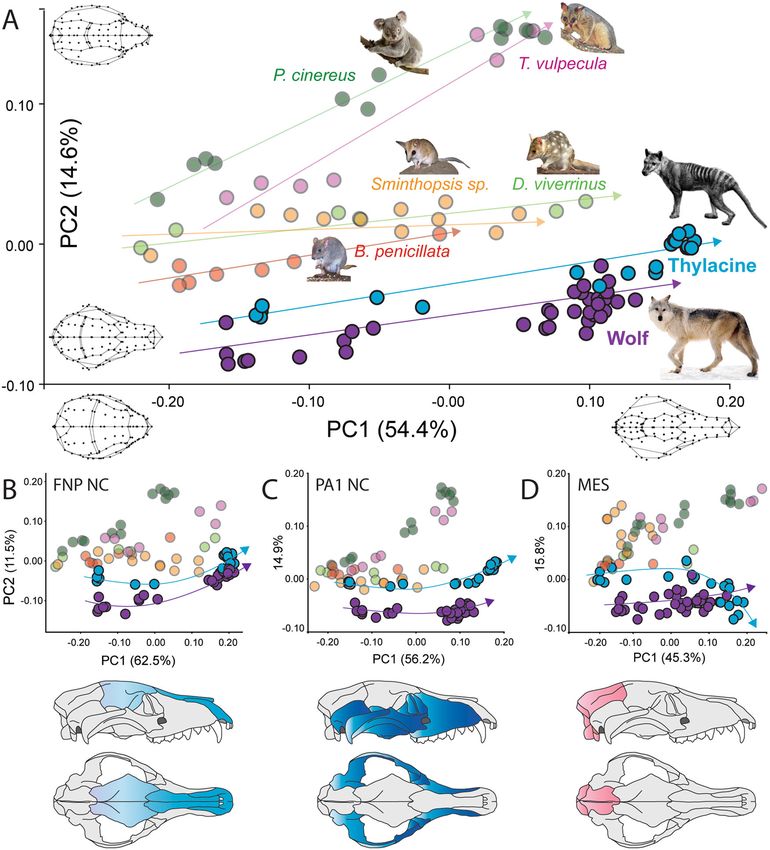
ARTICLE                                                               COMMUNICATIONS BIOLOGY | https://doi.org/10.1038/s42003-020-01569-x

W
            hen the first European settlers arrived on the remote             bones16,43, which has been suggested to limit marsupial cranial
            Australian island state of Tasmania, they were aston-            disparity38 and integration of the developing oral region41. How-
            ished to find a large, striped dog-like animal which,             ever, the existence of marsupial “developmental constraint” has
unlike other canids, had an abdominal pouch where it reared its              been challenged because marsupials have not always possessed
young. Appropriately named Thylacinus cynocephalus, translating              limited diversity compared with placental mammals44, and do not
to “pouched-dog dog-headed”1,2, the marsupial thylacine displayed            appear to exhibit adaptive constraints on forelimb45,46 or skull
remarkable similarities to placental canids3–5, despite last sharing a       shape variation47. Nevertheless, despite these differences, the
common ancestor over 160 million years ago6. The thylacine and               remarkable convergence of cranial shape between adult thylacines
gray wolf (Canis lupus) are considered one of the most striking              and wolves suggest the independent evolution of similar underlying
cases of convergent evolution in mammals, independently evolving             developmental processes.
nearly identical skull shapes7 in response to shared carnivorous and            Recent comparisons between the thylacine and wolf genomes7
predatory ecologies8–11, despite differences in their post-cranial           revealed extensive homoplasy in regulatory regions controlling
anatomy11,12. This example of convergent evolution offers an                 craniofacial development48, suggesting the evolution of shared
opportunity to determine how natural selection influences devel-              molecular pathways underlying their convergence. In this study, we
opmental and molecular processes to generate similar                         further examine the developmental processes that have led to the
characteristics13,14. Comparative studies of mammalian ontogeny              extraordinary cranial convergence between the extinct thylacine and
have provided important insights into differences underlying mar-            gray wolf3,7, building on a rare developmental series of thylacine
supial and placental development15–18 and how developmental                  pouch young49. By applying X-ray computed tomography (CT) to
mode can impact early cranial ontogeny19. Building on these                  preserved museum specimens, we describe the cranial ontogeny of
comparisons, we can explicitly test whether distantly related species        the thylacine and wolf from birth to adulthood, drawing compar-
with convergent morphologies have evolved homoplasy in devel-                isons with five extant marsupial species. Using 3D landmark and
opmental and molecular pathways to establish similarities in skull           point cloud-based geometric morphometric analyses, we examine
shape.                                                                       the onset and extent of cranial similarity in ontogenetic and allo-
   Development of the vertebrate skull is a deeply conserved process         metric growth patterns to determine how these are correlated
achieved through defined genetic cascades and cellular behaviors              throughout development. We specifically examine whether there is
during early embryogenesis20. The cranial bones arise from three             greater similarity between cranial regions with conserved embryonic
distinct embryological origins: the frontonasal process (FNP), first          tissue origins, linking phenotypic convergence with genetic homo-
pharyngeal arch (PA), and paraxial mesoderm (MES). The FNP                   plasy in craniofacial tissues48. In addition, we examine module
and PA are generated from independent streams of ectoderm-                   covariation patterns between the thylacine and wolf throughout key
derived neural crest cells (NC) and form the bones of the anterior           stages of development, to determine whether their adaptive cranial
facial skeleton, whereas cells from the paraxial head mesoderm               shapes arise through homoplasious modularity and integration
(MES) form the bones of the posterior neurocranium20–22. Each                patterns. Our findings offer novel insights into the mechanisms
stream of cranial mesenchymal cells possesses their own intrinsic            underlying mammalian evolution and provide new information on
genetic programming, which directs specific patterns of cellular              the cranial ontogeny of an extinct species.
migration, proliferation, and ossification to form individual bone
groups20,23,24. These cranial precursors form discrete develop-
mental modules, where each cranial region can evolve and respond             Results
to selection independently, known as mosaicism (or modularity)25.            Ontogenetic allometry. We sampled crania covering the complete
However, modularity patterns can also shift throughout ontogeny26.           developmental trajectories for the wolf, thylacine, and five addi-
During growth and maturation, bones arising from discrete devel-             tional extant marsupials, where specimens were available. These
opmental modules can group into larger, integrated (co-varied)               included the brush-tail possum (Trichosurus vulpecula), koala
traits27 in response to changing selective pressures28. As such,             (Phascolarctos cinereus), woylie (Bettongia penicillata), Eastern quoll
modularity and integration are important drivers of phenotypic               (Dasyurus viverrinus), and dunnart (Sminthopsis sp.). Crania were
evolution, where modules with shared developmental or functional             sampled to cover growth from earliest neonatal stages with nearly
associations can be uniquely shaped by selection25,29–31. Evolu-             completely closed cranial sutures, to full-grown adults. The thyla-
tionary shifts in modularity have been shown to facilitate or con-           cine and wolf exhibit lineage-specific developmental patterns,
strain morphological variation28,31,32, or when selection favors             exhibiting distinct heterochrony in their cranial ontogeny. Wolves
similar trait integration patterns among species, can promote the            are born after a gestation of ~ 65 days in a relatively altricial state
evolution of convergent phenotypes3,26,33,34.                                but possess a largely ossified skull50,51 (mean skull length 54.3 mm;
   The homologous organization and modular hierarchy of the                  n = 4, Supplementary data 1), with closure of all major cranial
mammalian skull provides an ideal system for examining the                   sutures except between the parietal and occipital, which remains
influence of functional, developmental, and genetic associations              partially open. At birth the wolf is substantially larger and more
underlying convergent phenotypes. Therian (marsupial and pla-                developed than the hyper-altricial thylacine, which by 1.5 weeks
cental) mammals display a remarkably conserved pattern of six                after its ~21–35 day gestation52 had a total skull length of 12 mm
cranial modules, recovered from both fossil and extant species35.            (n = 1, Supplementary data 1) and retained open sutures between
However, integration, or between-module covariation patterns,                all major cranial bones49. By ~1.25-months-old, the thylacine
differ between marsupials and placentals, likely in response to their        showed equivalence in skull length (~31 mm) and development to a
dichotomous modes of reproduction36,37. Placental mammals                    fetal wolf (36 mm; Fig. 1A) but did not appear morphologically
typically develop through an extended intra-uterine gestation and            similar to a newborn wolf until 2.5 months after birth (~75 days;
are born in a relatively advanced (precocial) state compared with            skull length 58 mm; Fig. 1A, Supplementary data 1). As the 1.5-
marsupials. In contrast, marsupials are born after a short gestation         week-old thylacine cranium resembled an early embryonic
in a hyper-altricial state (resembling a placental fetus38), after which     state with open cranial sutures, we omitted it from further analyses.
they crawl into the mother’s pouch to continue development                      Using landmark-based morphometrics of ontogenetic cranial
through extended lactation and suckling39. The marsupial mode of             shape (Fig. 1B), we examined cranial growth patterns between our
reproduction requires accelerated morphogenesis and hetero-                  sampled taxa. We found that each species displayed significant
chronic gene expression in the forelimbs40–42 and cranial                    allometric growth, meaning that cranial shape was strongly

2                          COMMUNICATIONS BIOLOGY | (2021)4:51 | https://doi.org/10.1038/s42003-020-01569-x | www.nature.com/commsbio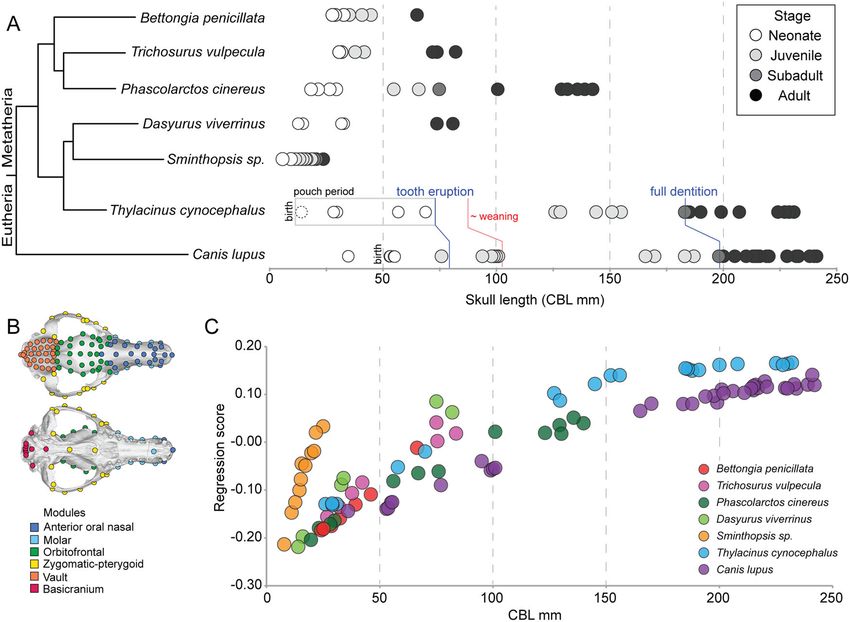
COMMUNICATIONS BIOLOGY | https://doi.org/10.1038/s42003-020-01569-x                                                                                ARTICLE

Fig. 1 Taxa sampling, landmark and module locations, ontogenetic allometry. A Crania were sampled from neonatal (white), juvenile (light gray), sub-adult
(dark gray), and adult (black) individuals, from the marsupial thylacine (Thylacinus cynocephalus) and placental gray wolf (Canis lupus), and five additional
marsupial species: the woylie (Bettongia penicillata), brush-tail possum (Trichosurus vulpecula), koala (Phascolarctos cinereus), Eastern quoll (Dasyurus viverrinus),
and dunnart (Sminthopsis sp.). Crania were sampled to cover the complete developmental trajectory of each species. Skull lengths (CBL) for each sampled
specimen are shown in millimetres. B Landmark locations (described in Supplementary data 2) used in the study, shown on an adult thylacine skull. Landmarks
are colored by functional groups used in modularity analyses. C Ontogenetic allometry of sampled taxa revealed variation between developmental trajectories,
though the thylacine and wolf displayed similar gradual patterns of shape change.

dependent on size (Table S1). The Procrustes analysis of variance                   shape change per unit size, were significant for all but four species
(ANOVA) rejected the null hypothesis of common slopes (F = 7.97,                    pairs, usually involving smaller taxa (i.e., Sminthopsis; Table 1). The
Z = 20.13, p = 0.001), indicating that covariation of size and shape                largest angular differences, and hence lowest slope vector correla-
during postnatal ontogeny is not the same for all taxa. Allometric                  tions (r), were between Trichosurus, Phascolarctos, and all other
patterns were visualized as a scatter plot of individual regression                 species (angular differences 35–48°, p ≤ 0.004 for each), and
scores, calculated as standardized shape scores from the regression                 Thylacinus vs Bettongia (37°, p = 0.005). The slope vector
of shape on size53, against condylobasal length (CBL) (Fig. 1C) and                 correlation between thylacine and wolf was close to 1 (r = 0.91,
centroid size (Fig S1), which were highly correlated (r2 = 0.99; p <                p = 0.001), indicating nearly parallel slopes. The only stronger
0.0001; Fig S2). This revealed substantial variation among                          angular correlations in the data set were between closely related
ontogenetic trajectories, with some species reaching maturity over                  carnivorous dasyuromorphs, Dasyurus vs Thylacinus, and
a shorter range of skull lengths (e.g., Sminthopsis sp.). These smaller             Sminthopsis vs Dasyurus.
marsupials are characterized by tubular snouts, flat heads, smooth
parietal bones (i.e., little to no sagittal crest) and a more bulbous
cranium posteriorly than the larger-bodied carnivores. The                          Cranial disparity and convergence. We next measured ontoge-
thylacine and wolf display slightly more gradual shape change                       netic variation in cranial shape using principal component analysis
along the length of their trajectories (Fig. 1C), which cover roughly               (PCA). Over three quarters (77%) of the total shape variation was
the same size range in our sample (thylacine CBL 29–232 mm, wolf                    contained in the first three axes, with 54% explained by PC1 alone.
CBL 36–242 mm). This is largely observed through parallel                           PC1 describes the development from a bulbous and short-faced
development of an elongated snout, widened zygomatic arches,                        neonate (PC1−) to a mature adult skull shape with narrowing of
and pronunciation of the sagittal crest.                                            the brain case and elongation of the snout (PC1+ ; Fig. 2A). PC1
   Pairwise comparisons of slope vector lengths (magnitude)                         was strongly positively correlated with log-transformed skull length
showed significant differences in the amount of shape change per                     (logCBL: CBL; Pearson’s correlation r = 0.84, p < 0.00001)
unit size for 13 of the 21 species pairs (Table 1). The difference                  suggesting it is reasonable proxy for age-related changes in cranial
between thylacine and wolf was relatively small but significant (p =                 shape50,54. PC2 (15%) separated taxa based on feeding ecology,
0.003). In contrast, large comparative differences were observed                    describing widening of the cranial vault and zygomatic arches, as
between herbivorous and carnivorous taxa (p ≤ 0.003 for each),                      well as blunting of the snout (Fig. 2A, Fig S3). Carnivorous taxa and
such as Phascolarctos (koala) vs Dasyurus (quoll). Pairwise                         the primarily fungivorous Bettongia exhibited parallel growth tra-
comparisons of slope vector angles, indicating the direction of                     jectories, whereas herbivorous taxa displayed divergent patterns of

COMMUNICATIONS BIOLOGY | (2021)4:51 | https://doi.org/10.1038/s42003-020-01569-x | www.nature.com/commsbio                                                          3
ARTICLE COMMUNICATIONS BIOLOGY | https://doi.org/10.1038/s42003-020-01569-x
Table 1 Ontogenetic allometry — differences in slope vector length and angle between sampled species pairs.
Species pair Slope vector length P value Slope vector correlation (r) Slope vector angle (degrees) P value
Bettongia–Canis 0.0341 0.174 0.834 33.467 0.026
Bettongia–Dasyurus 0.0345 0.172 0.853 31.428 0.125
Bettongia–Phascolarctos 0.0533 0.038 0.697 45.828 0.001
Bettongia–Sminthopsis 0.0350 0.186 0.819 34.998 0.147
Bettongia–Thylacinus 0.0606 0.019 0.796 37.209 0.005
Bettongia–Trichosurus 0.0275 0.325 0.673 47.697 0.004
Canis–Dasyurus 0.0004 0.973 0.903 25.429 0.002
Canis–Phascolarctos 0.0192 0.042 0.817 35.206 0.001
Canis–Sminthopsis 0.0691 0.001 0.845 32.317 0.006
Canis–Thylacinus 0.0265 0.003 0.911 24.402 0.001
Canis–Trichosurus 0.0616 0.001 0.742 42.124 0.001
Dasyurus–Phascolarctos 0.0189 0.177 0.806 36.269 0.001
Dasyurus–Sminthopsis 0.0695 0.001 0.927 21.982 0.536
Dasyurus–Thylacinus 0.0261 0.048 0.917 23.452 0.003
Dasyurus–Trichosurus 0.0619 0.003 0.764 40.155 0.001
Phascolarctos–Sminthopsis 0.0883 0.001 0.732 42.938 0.001
Phascolarctos–Thylacinus 0.0072 0.431 0.816 35.277 0.001
Phascolarctos–Trichosurus 0.0808 0.001 0.779 38.857 0.001
Sminthopsis–Thylacinus 0.0956 0.001 0.894 26.557 0.055
Sminthopsis–Trichosurus 0.0075 0.744 0.760 40.568 0.009
Thylacinus–Trichosurus 0.0880 0.001 0.797 37.123 0.001
Significant P values are in bold.
development (Fig. 2A, Fig S3). PC3 (8% of variation) separated the sphenoid, palatine), which retained distinct shapes between the
wolf from the carnivorous marsupials, reflecting its robust skull thylacine and wolf throughout ontogeny (Fig. 2C). Together, these
including widening of the molar row and pronunciation of the data suggest that cranial convergence may be mosaic, with homo-
interparietal process (Fig S3). plasy arising specifically within FNP-NC and MES developmental
Given the dichotomous life histories and reproductive strategies modules25.
of marsupials and placental mammals15,39, we hypothesized that
the thylacine and wolf would display disparate early cranial shapes, Point cloud visualization of cranial convergence. To further
only to converge later in their juvenile to adult stages of visualize regions of the crania that displayed the greatest variation
development. Instead, the thylacine and wolf displayed parallel, during ontogeny, we generated point cloud comparisons of similar
nearly overlapping, patterns of PC1–2 shape similarity throughout sized and stage-matched thylacine and wolf skulls. Regions with
ontogeny (Fig. 2a), reflecting their allometric growth patterns small cloud-to-cloud distances are shown as cool colors (blue and
(Fig. 1c, Table 1). Furthermore, the thylacine displayed greater green) while large distances are expressed as warm colors (red and
ontogenetic similarities to the wolf than to any of its close marsupial purple). Stage-matched comparisons were found to complement the
relatives (Fig. 2a). The fetal wolf (36 mm) nearly overlapped in ontogenetic cranial morphospace (Fig. 2), where the thylacine and
cranial shape with the 1-month-old thylacine (31 mm), indicating wolf crania show strong similarity during the neonatal, juvenile,
both species established similar skull morphologies (i.e., a bulbous and adult stages of ontogeny (Fig. 3). The largest overall differences
cranium with a short snout) at the earliest stages of ontogeny, were observed in the basicranium, particularly the occipital con-
despite their developmental heterochrony. These similarities dyles, basioccipital, and auditory bulla (Fig. 3A, B). During
persisted through to their adult cranial shape3,7, as seen by the maturation, shape disparity arose around the nasal aperture and
homoplasious development of a long, narrow snout and dorsally braincase, with larger differences occurring in the positioning of the
expanded skull roof forming a pronounced sagittal crest. molar row and pronunciation of the interparietal process (Fig. 3C).
However, these adult cranial differences were relatively minor,
Convergence in cranial regions with shared embryological highlighted by similar-scaled comparisons with the thylacine’s close
origins. To investigate the extent to which genetic convergence relative, the Eastern quoll (Dasyurus viverrinus) (Fig. 3D), showing
between the thylacine and wolf may be reflected in cranial growth overall dissimilarity particularly in the size and shape of the anterior
patterns, we examined morphological variation in cranial sub- rostrum.
regions arising from discrete embryological tissue origins. Cranial
landmarks were subsampled into three datasets55 with landmarks Cranial modularity and integration. Finally, we investigated
covering cranial regions arising from distinct tissue origins—bones ontogenetic patterns of cranial modularity and integration (covar-
of the NC-derived FNP (Fig. 3C) or first PA (Fig. 3D), or bones of iation). We compared thylacine and wolf module covariation
paraxial head MES (Fig. 3E)20. Each subsampled dataset reflec- patterns using covariance ratio analysis (CR)56 of the three
ted similar patterns observed in the complete morphospace, with- embryonic tissue origins (FNP-NC, PA-NC, MES) and an estab-
over three quarters of the total shape variance held in PC1–3 lished, mammalian six functional module model35. Pairwise CR
(FNP = 80%; PA = 80%; MES = 72%). However, we detected comparisons between each cranial module in the neonatal and
strong ontogenetic similarity and adult convergence in thylacine juvenile thylacine and wolf stages were similarly large (CR > 0.85),
and wolf bones arising from FNP NC (i.e., frontal, nasal, and suggesting all cranial functional modules remain integrated during
premaxilla bones; Fig. 2B) and mesodermal origins (i.e., parietal the early patterning and remodelling of the cranial bones (Fig. 4,
and occipital bones; Fig. 2D). This similarity was not observed in Table S2). However, these differed markedly in adults (Fig. 4,
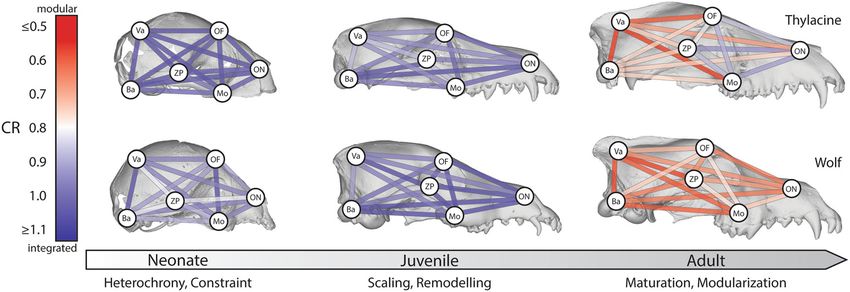
bones of PA origin (i.e., zygomatic, maxilla, lacrimal, temporal, Table S2). Adult wolves possess low CR values (CR ≤ 0.85) for
4 COMMUNICATIONS BIOLOGY | (2021)4:51 | https://doi.org/10.1038/s42003-020-01569-x | www.nature.com/commsbioCOMMUNICATIONS BIOLOGY | https://doi.org/10.1038/s42003-020-01569-x ARTICLE Fig. 2 Ontogenetic cranial variation and mosaic evolution. A Principal component analysis of ontogenetic cranial shape for each species included in the study. PC1 represents age-related shape change (left to right), whereas PC2 separates herbivorous and carnivorous taxa. The thylacine and wolf display parallel similarities throughout ontogeny, compared with other marsupials. B–D Subsampling of cranial shape into bone groups with shared embryonic tissue origins. The thylacine and wolf show shape overlap between bones of B FNP and D MES origin, but not in bones of C PA origin. Animal images were used under CC BY 4.0 open licence. each cranial module comparison, suggesting the adult wolf Discussion skull becomes more modular during maturation55,57. In contrast, The extinct thylacine and gray wolf present an exceptional model of adult thylacines returned low CR values for cranial regions asso- convergent evolution, with recent studies supporting extreme phe- ciated with the neurocranium (basicranium & cranial vault; CR < notypic similarity in the skull7,9 and accompanying genomic 0.85) but expressed large values (CR > 0.85) between the facial homoplasy in craniofacial gene-regulatory elements48. However, the regions (orbitofrontal, oral-nasal, molar, zygomatic-pterygoid; underlying developmental processes that link these homoplasies are FNP, PA). Together this suggests that while the thylacine neuro- not well understood. Using detailed taxonomic, landmark, and cranium becomes more modular, the facial bones remain highly point cloud-based comparisons, we demonstrate that the thylacine integrated throughout ontogeny55,57. CR analysis of the allometry- displays a departure from the tightly constrained marsupial corrected residuals yielded largely similar modularization of the pattern3,7,58, instead sharing parallel similarities in cranial devel- crania across development, but with slightly greater modularity opment (Figs. 2, 3) and allometric growth patterns (Table 1) with (CR < 0.8) between four partitions at the juvenile stage the wolf, instead of its close marsupial relatives, across its entire (orbitofrontal–cranial vault and cranial vault-basicranium in the postnatal ontogeny. The inclusion of additional taxa representing thylacine, molar-cranial vault, and cranial vault-basicranium in the broader sources of cranial variation (i.e., placental herbivores and wolf; Table S3). carnivores), or larger-bodied carnivorous marsupials such as the COMMUNICATIONS BIOLOGY | (2021)4:51 | https://doi.org/10.1038/s42003-020-01569-x | www.nature.com/commsbio 5
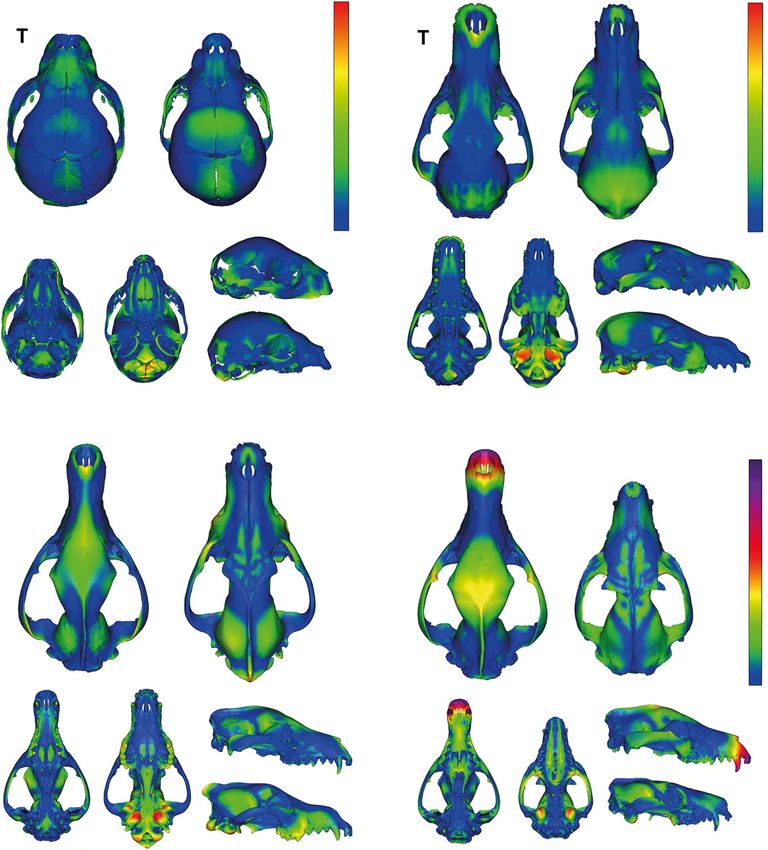
ARTICLE                                                                 COMMUNICATIONS BIOLOGY | https://doi.org/10.1038/s42003-020-01569-x

Fig. 3 Point cloud comparisons of thylacine and wolf ontogenetic cranial shape. Small point-to-point differences are expressed as cool colors (blue/green)
while large differences are observed as warm colors (red/purple). Warmer colors denote greater Euclidean distances between point clouds. Minor shape
differences are observed between thylacine (T) and wolf (W) crania at A neonatal, B juvenile, and C adult stages. Similarities become apparent when the
thylacine is compared with its extant relative, d the Eastern quoll.

Fig. 4 Network diagrams of module covariation patterns during ontogeny. Pairwise covariance ratio (CR) coefficients between cranial landmark modules
(see Table S2) for thylacine and wolf on neonate, juvenile, and adult 3D rendered skulls. Low CR values are expressed by warm colors, indicating modularity,
whereas cool colors represent high CR values, suggesting integration. Neonatal and juvenile modules show high CR ratios (integration). The adult thylacine
retains an integrated facial skeleton, while the adult wolf skull becomes modular. Ba basicranium, Mo molar, OF orbitofrontal, ON oral-nasal, Va vault, ZP
zygomatic-pterygoid.

6                           COMMUNICATIONS BIOLOGY | (2021)4:51 | https://doi.org/10.1038/s42003-020-01569-x | www.nature.com/commsbio
COMMUNICATIONS BIOLOGY | https://doi.org/10.1038/s42003-020-01569-x                                                                                ARTICLE

Tasmanian devil—Sarcophilus harrisii, or tiger quoll—Dasyurus                  previous vertebrate studies have shown that selection can favor
maculatus3,5,58, may reveal more subtle homoplasious growth pat-               modularity and integration patterns to promote morphological
terns. However, the broad similarities observed between the thyla-             convergence between closely related taxa33,66,67, our results
cine and wolf are nonetheless remarkable given their 160 million               demonstrate that convergent phenotypes may not always be gen-
year divergence6, dichotomous reproductive strategies, and                     erated through homoplasious patterns of functional integration,
observed developmental heterochrony (Fig. 1)15,36,58,59.                       instead arising through alternate developmental pathways.
   The parallel development of the thylacine and wolf crania com-                 The ontogenetic thylacine-wolf comparisons presented in this
plement post-cranial skeletal growth patterns in which the thylacine           study provide unique and novel insights into the developmental
also develops with greater similarity to other large placental carni-          processes underlying morphological convergence and evolution in
vores than to marsupials49, irrespective of the differences in their           mammals. Although mammalian lineage-specific constraints influ-
forelimb anatomy12,60. These similar developmental trajectories are            ence embryonic and neonatal stages of development, our data suggest
likely an adaptive response to shared ecological niches and bio-               that these constraints can be rapidly overcome, likely as an adaptive
mechanical demands of predation, i.e., the development of                      response to shared ecological niches9,10. We show that the cranial
robust cranial bones and musculature to generate high bite force               similarities between the thylacine and wolf are in fact mosaic25, where
quotients8–11. Importantly, the thylacine appears to have evolved              cranial bone groups with strong shape similarity arise from conserved
unique developmental mechanisms to facilitate its adaptive con-                embryological origins. Strikingly, these patterns are accompanied by
vergence, making this comparison an extraordinary evolutionary                 genomic homoplasy within these key embryonic cell populations48,
model to scrutinize the developmental processes underlying con-                providing strong empirical links between phenotypic and genotypic
vergent evolution.                                                             homoplasy. These findings prompt exciting new research avenues to
   To better understand the ontogenetic origins of the thylacine-wolf          examine how molecular changes within tissue-specific regulatory
convergence, we subsampled cranial shape data into bone groups                 networks may influence craniofacial shape disparity and convergence.
arising from discrete embryological tissues. This revealed disparate           The identification of these developmental similarities and differences
patterns of ontogenetic shape between the FNP, PA, and MES                     provides a novel framework for defining the causative factors
groups, suggesting they are mosaic and able to evolve and adapt                underpinning skull evolution and the remarkable cranial convergence
semi-independently25. PA-FNP and MES bones converged between                   seen between the thylacine and wolf7.
the thylacine and wolf, whereas bones of PA-NC origin were distinct,
instead showing signatures of constrained shape between marsupials             Methods
(Fig. 2). PA-NC cells migrate and ossify to establish the bones of the         Sampling. Three-dimensional digital cranial models for seven species of mammals,
masticatory (oral) apparatus, which in marsupials, is accelerated to           including the thylacine and gray wolf, were acquired from published studies7,49–51,62,68,
facilitate the functional demands of altricial suckling36,59,61,62. These      public repositories (Digimorph, MorphoSource, Digital Morphology Museum), or
                                                                               newly generated using X-ray CT on museum specimens (Supplementary data 1). Five
constraints may produce stabilizing selection and reduced shape                marsupial species were chosen for comparison with the thylacine, subject to their
evolvability of the oral bones within marsupial taxa34, thus restricting       availability. We sampled crania from the dunnart (Sminthopsis sp.) and eastern quoll
homoplasy with placental mammals. In contrast, the observed con-               (Dasyurus viverrinus), which belong to the same carnivorous order as the thylacine
vergence of FNP-NC and MES bone groups between thylacine and                   (Dasyuromorphia) and show similarities in adult cranial morphologies (e.g., long and
wolf suggests their similarities stem from a common developmental              narrow snouts)7, but have different body sizes and life histories. We were unable,
                                                                               however, to sample the larger-bodied Tasmanian devil (Sarcophilus harrisii) or tiger
origin. Here, adaptive molecular evolution may arise within FNP-NC             quoll (Dasyurus maculatus) owing to a lack of cataloged postnatal specimens. We also
and MES embryonic cell lineages, regulating the convergent devel-              included divergent taxa belonging to the distantly related order Diprotodontia, which
opment of these bone groups. This hypothesis is supported by the               display disparate cranial morphologies7, owing to a mainly herbivorous diet (koala,
recent identification of thylacine-wolf homoplasy in gene-regulatory            Phascolarctos cinereus; brush-tail possum, Trichosurus xvulpecula; and woylie, Bet-
                                                                               tongia penicillata), and unique ecologies (e.g., terrestrial bipedal or arboreal). CT
elements of major patterning genes and developmental pathways                  scanning was performed at the School of Earth Sciences, University of Melbourne, in a
regulating cranial mesenchyme migration, differentiation, and ossi-            GE Phoenix Nanotom M and 3D volumes were reconstructed in datos|x-recon-
fication48. This is further supported where perturbations to pattern-           struction software (GE Sensing & Inspection Technologies GmbH, Wunstorf, Ger-
ing genes within cranial NC cells can directly alter facial                    many). Crania were isolated from the skeleton in VGStudio Max 3.0 (Volume
                                                                               Graphics, Heidelberg, Germany) and exported as surface meshes. The final data set
morphology24. Taken together, these observations establish tangible            consisted of 101 individuals spanning the postnatal growth period of each species
links between phenotypic, developmental, and genomic convergence.              (6–35 individuals/species, average = 14; Fig. 1A). Age class was determined by tooth
That is, homoplasy targeting gene-regulatory networks within cells of          eruption patterns and life history data, where available. Generally, individuals without
FNP-NC or MES origin may drive the development of similar,                     any erupted teeth were considered neonates; individuals with at least one erupted tooth
                                                                               were considered juveniles; individuals with all but one of their adult dentition were
adaptive cranial shapes throughout ontogeny.                                   considered subadults and individuals with all of their teeth were considered adults69,70
   In addition to cranial mosaicism, homoplasious adaptations may              (Supplementary data 1).
arise through selection favoring shared module covariation or
integration patterns3,26,33,34. Surprisingly though, we found that the         Geometric morphometric analyses. Biological shape was captured by 128 land-
thylacine and wolf exhibit distinct patterns of functional modularity          marks placed across the cranial surface in Landmark Editor (Institute of Data
and integration during their development. Although the wolf                    Analysis and Visualization, UC Davis, USA), including 30 anatomical landmarks
showed overall increases in cranial modularity during postnatal                from previous studies3,7 and 98 additional landmarks in the form of points, patches
ontogeny63, the thylacine retained high covariation between facial             and sliding semi-landmarks (Fig. 1B; Supplementary data 2). The final landmark data
                                                                               set can be found in Supplementary data 3–5, and associated cranial CT data and
modules, particularly between bones of PA-NC origin, further                   surface meshes are publicly available on MorphoSource (www.morphosource.org,
reflecting its marsupial biology (Fig. 4)36,49,61. As such, the thylacine       project number P1124). Geometric information was extracted from the landmark co-
and wolf have not evolved their striking cranial convergence                   ordinates by a generalized Procrustes fit in the R package geomorph v3.1.271. The
through homoplasious functional integration patterns, owing to                 resulting Procrustes co-ordinates, representing the symmetric component of shape
                                                                               variation after translating, scaling, and rotating all individuals to a common centroid,
their lineage-specific constraints64. Placental mammals display an              were used as shape variables in all analyses. CBL, measured from the anterior-most tip
incredible range of cranial variation58,59 owing to the relaxed                of the snout to the posterior surface of the occipital condyles, was used to determine
constraints, and increased modularity, associated with their com-              relative cranial size across development (Supplementary data 1). CBL showed a strong
paratively extended gestation65. In comparison, marsupials display             linear relationship with centroid size in the data set (Fig S2) so was used in subsequent
                                                                               analyses. Species ontogenetic allometries were assessed by regression of cranial shape
reduced overall cranial variability and plasticity58, suggested to             on log-transformed CBL and compared using Procrustes ANOVA. Given a significant
occur in response to the developmental and functional constraints              species*size interaction, species pairwise comparisons were performed to identify
associated with their mode of reproduction15,37,58,64. Although                differences in allometric vectors (degree of shape change), including slope vector

COMMUNICATIONS BIOLOGY | (2021)4:51 | https://doi.org/10.1038/s42003-020-01569-x | www.nature.com/commsbio                                                            7
ARTICLE COMMUNICATIONS BIOLOGY | https://doi.org/10.1038/s42003-020-01569-x
length, correlation and angle (in degrees). This was achieved using the pairwise 4. Werdelin, L. Comparison of skull shape in marsupial and placental carnivores.
function on the unique species allometry model in the R package RRPP v0.6.272, Aust. J. Zool. 34, 109–117 (1986).
which compares least-squares (LS) means while accounting for allometry and species 5. Wroe, S. & Milne, N. Convergence and remarkably consistent constraint in
effects. the evolution of carnivore skull shape. Evolution 61, 1251–1260 (2007).
To assess the role of modularity in morphological convergence of thylacine and 6. Bininda-Emonds, O. R. P. et al. The delayed rise of present-day mammals.
wolf, landmarks were partitioned according to two model structures. The embryonic Nature 446, 507–512 (2007).
tissue origin model included three modules based on their derivation from cranial/ 7. Feigin, C. Y. et al. Genome of the Tasmanian tiger provides insights into the
pharyngeal arch neural crest, or paraxial head mesodermal origin (1—FNP and 2— evolution and demography of an extinct marsupial carnivore. Nat. Ecol. Evol. 2,
first PA NC; and 3—head MES). The functional module hypothesis included six 182–192 (2018).
functional groups supported by previous studies on mammals35,73, including four of 8. Attard, M. R. G., Chamoli, U., Ferrara, T. L., Rogers, T. L. & Wroe, S. Skull
the species examined here. These modules were slightly altered to match our mechanics and implications for feeding behaviour in a large marsupial carnivore
landmark placements, so that each module was comprised of sets of individual bones, guild: the thylacine, Tasmanian devil and spotted-tailed quoll. J. Zool. 285,
rather than parts of bones, which corresponded to tissue origin(s), i.e., FNP-NC- 292–300 (2011).
derived frontals, nasals, and premaxilla; PA NC-derived maxilla, zygomatic arch, 9. Wroe, S., Clausen, P., McHenry, C., Moreno, K. & Cunningham, E. Computer
palate, sphenoid, pterygoid, and other small bones; and MES-derived parietals and simulation of feeding behaviour in the thylacine and dingo as a novel test for
occipitals forming part of the neurocranium and cranial base. The resulting modules
convergence and niche overlap. Proc. R. Soc. B Biol. Sci. 274, 2819–2828 (2007).
were 1—oral-nasal (FNP/PA), 2—molar (PA), 3—zygomatic-pterygoid (PA), 4—
10. Wroe, S., McHenry, C. & Thomason, J. Bite club: Comparative bite force in big
orbitofrontal (FNP), 5—cranial vault (MES), and 6—basicranium (MES).
biting mammals and the prediction of predatory behaviour in fossil taxa. Proc. R.
Changes in the degree of cranial modularity during postnatal development were
Soc. B Biol. Sci. 272, 619–625 (2005).
identified using covariance ratio analysis (CR)56, describing the covariation of
landmarks between modules relative to the covariation within them. CR coefficients 11. Jones, M. E. & Michael Stoddart, D. Reconstruction of the predatory behaviour
range from zero to positive values, with values between zero and one indicating of the extinct marsupial thylacine (Thylacinus cynocephalus). J. Zool. 246,
greater covariation within than between modules (i.e., greater modular structure), 239–246 (1998).
whereas values larger than one indicate greater covariation between, than within, 12. Figueirido, B. & Janis, C. M. The predatory behaviour of the thylacine:
modules (i.e., less modular–more integrated structure). A CR coefficient of one is Tasmanian tiger or marsupial wolf? Biol. Lett. 7, 937–940 (2011).
expected for random sets of landmarks, since levels of covariation between and within 13. Stern, D. L. The genetic causes of convergent evolution. Nat. Rev. Genet. 14,
modules should be, on average, the same56. CR was estimated separately for the 751–764 (2013).
neonate, juvenile, and adult stages of the thylacine and wolf for the full landmark data 14. Foote, A. D. et al. Convergent evolution of the genomes of marine mammals.
set and after correcting for allometric effects, using the residuals from the species- Nat. Genet. 47, 272–275 (2015).
specific Procrustes ANOVA. Given the low specimen-to-landmark ratio in our data 15. Goswami, A., Weisbecker, V. & Sánchez-Villagra, M. R. Developmental
set, we also performed a random data simulation for similar module partition sizes at modularity and the marsupial-placental dichotomy. J. Exp. Zool. Part B Mol.
our smallest developmental stage sample (N = 6), which returned reasonable (0.057) Dev. Evol. 312, 186–195 (2009).
type I error rates. 16. Sánchez-Villagra, M. R., Goswami, A., Weisbecker, V., Mock, O. & Kuratani, S.
Cranial shape changes during ontogeny were illustrated by wireframe graphs Conserved relative timing of cranial ossification patterns in early mammalian
showing shifts in landmark positions. For visualization of cranial shape differences evolution. Evol. Dev. 10, 519–530 (2008).
between thylacine and wolf at distinct developmental stages (neonate, juvenile, 17. Sánchez-Villagra, M. R. Comparative patterns of postcranial ontogeny in therian
adult), specimens with similar CBLs were selected for each species and aligned mammals: an analysis of relative timing of ossification events. J. Exp. Zool. 294,
using CloudCompare v2.10.2 (www.cloudcompare.org/). CloudCompare differs 264–273 (2002).
from landmark-based analyses in that it renders the entire cranial mesh as a dense 18. Werneburg, I. et al. Development and embryonic staging in non-model
cloud of equidistantly spaced points. Point clouds for each stage were aligned organisms: the case of an afrotherian mammal. J. Anat. 222, 2–18 (2013).
using the “Align (point pairs picking)“ tool with eight equivalent points on each 19. Li, P. & Smith, K. K. Comparative skeletal anatomy of neonatal ursids and the
skull (considered a rough registration), followed by the “Fine registration” tool, extreme altriciality of the giant panda. J. Anat. 236, 724–736 (2020).
both with thylacine as the reference model and adjust scale selected. Meshes were 20. Santagati, F. & Rijli, F. M. Cranial neural crest and the building of the
subsampled to 10 million points and compared using “Compute cloud/cloud or vertebrate head. Nat. Rev. Neurosci. 4, 806–818 (2003).
cloud/mesh distance”, first with thylacine as the reference and then with wolf. 21. Fish, J. L. Evolvability of the vertebrate craniofacial skeleton. Semin. Cell Dev.
Resulting Euclidean distances between skulls were displayed in color scale, Biol. 91, 13–22 (2019).
reflecting the nearest neighbour distance for each point of the compared clouds. 22. Northcutt, R. G. The new head hypothesis revisited. J. Exp. Zool. Part B Mol.
Dev. Evol. 304, 274–297 (2005).
Statistics and reproducibility. All statistical tests were performed in MorphoJ and 23. Schneider, R. A. Neural crest and the origin of species-specific pattern. Genesis
the R packages geomorph v3.1.271 and RRPP v0.4.2.972, with P values generated from 56, 1–33 (2018).
a randomized residual permutation procedure of 10,000 iterations. No special ethical 24. Hall, J. et al. Evolution of a developmental mechanism: species-specific
considerations were necessary for this study. Taxon sampling was performed in regulation of the cell cycle and the timing of events during craniofacial
accordance with relevant guidelines and regulations. osteogenesis. Dev. Biol. 385, 380–395 (2014).
25. Felice, R. N. & Goswami, A. Developmental origins of mosaic evolution in the
Reporting summary. Further information on research design is available in the Nature avian cranium. Proc. Natl Acad. Sci. USA 115, 555–560 (2018).
Research Reporting Summary linked to this article. 26. Goswami, A., Smaers, J. B., Soligo, C. & Polly, P. D. The macroevolutionary
consequences of phenotypic integration: from development to deep time. Philos.
Trans. R. Soc. B Biol. Sci. 369, 20130254 (2014).
Data availability 27. Olson, E. & Miller, R. Morphological Integration. (The University of Chicago
Detailed specimen information and source is provided in Supplementary Data 1. Raw Press, 1958). https://doi.org/10.2307/2405966
landmark co-ordinates with associated classifier and covariate data is included in 28. Goswami, A., Binder, W. J., Meachen, J. & O’Keefe, F. R. The fossil record of
Supplementary Data files 3–5. CT data and cranial models generated for this study are phenotypic integration and modularity: a deep-time perspective on
publicly available on MorphoSource (www.morphosource.org; project number P1124). developmental and evolutionary dynamics. Proc. Natl Acad. Sci. USA 112,
4891–4896 (2015).
29. Wagner, G. P. & Altenberg, L. Complex adaptations and the evolution of
Received: 17 July 2020; Accepted: 1 December 2020;
evolvability. Evolution 50, 967–976 (1996).
30. Felice, R. N. et al. Evolutionary integration and modularity in the Archosaur
Cranium. Integr. Comp. Biol. 59, 371–382 (2019).
31. Watanabe, A. et al. Ecomorphological diversification in squamates from
conserved pattern of cranial integration. Proc. Natl Acad. Sci. USA 116,
14688–14697 (2019).
References 32. Schluter, D. Adaptive radiation along genetic lines of least resistance. Evolution
1. Harris, G. P. X. I. Description of two new species of Didelphis from Van 50, 1766 (1996).
Diemen’s Land. Trans. Linn. Soc. Lond. 9, 174–178 (1808). 33. Sanger, T. J., Mahler, D. L., Abzhanov, A. & Losos, J. B. Roles for modularity and
2. Temminck, C. J. Monographie de mammalogie. (Paris, 1824). https://doi.org/ constraint in the evolution of cranial diversity among anolis lizards. Evolution
10.5962/bhl.title.125524. (N. Y). 66, 1525–1542 (2012).
3. Goswami, A., Milne, N. & Wroe, S. Biting through constraints: cranial 34. Goswami, A. et al. Do developmental constraints and high integration limit
morphology, disparity and convergence across living and fossil carnivorous the evolution of the marsupial oral apparatus? Integr. Comp. Biol. 56, 404–415
mammals. Proc. R. Soc. B Biol. Sci. 278, 1831–1839 (2011). (2016).
8 COMMUNICATIONS BIOLOGY | (2021)4:51 | https://doi.org/10.1038/s42003-020-01569-x | www.nature.com/commsbioCOMMUNICATIONS BIOLOGY | https://doi.org/10.1038/s42003-020-01569-x ARTICLE
35. Goswami, A. Cranial modularity shifts during mammalian evolution. Am. 64. Porto, A., de Oliveira, F. B., Shirai, L. T., de Conto, V. & Marroig, G. The
Nat. 168, 270–280 (2006). evolution of modularity in the mammalian skull I: morphological integration
36. Smith, K. K. Craniofacial development in marsupial mammals: developmental patterns and magnitudes. Evol. Biol. 36, 118–135 (2009).
origins of evolutionary change. Dev. Dyn. 235, 1181–1193 (2006). 65. Marroig, G., Shirai, L. T., Porto, A., de Oliveira, F. B. & de Conto, V. The
37. Goswami, A., Polly, P. D., Mock, O. B. & Sánchez-Villagra, M. R. Shape, evolution of modularity in the mammalian skull II: evolutionary
variance and integration during craniogenesis: contrasting marsupial and consequences. Evol. Biol. 36, 136–148 (2009).
placental mammals. J. Evol. Biol. 25, 862–872 (2012). 66. Morris, Z. S., Vliet, K. A., Abzhanov, A. & Pierce, S. E. Heterochronic shifts
38. Ferner, K., Schultz, J. A. & Zeller, U. Comparative anatomy of neonates of the and conserved embryonic shape underlie crocodylian craniofacial disparity
three major mammalian groups (monotremes, marsupials, placentals) and and convergence. Proc. R. Soc. B Biol. Sci. 286, 20182389 (2019).
implications for the ancestral mammalian neonate morphotype. J. Anat. 231, 67. Sherratt, E. et al. Heterochronic shifts mediate ecomorphological convergence
798–822 (2017). in skull shape of microcephalic sea snakes. Integr. Comp. Biol. 59, 616–624
39. Tyndale-Biscoe, C. H. & Janssens, P. A. The Developing Marsupial. The British (2019).
Journal of Psychiatry 111, (Springer Berlin Heidelberg, 1988). 68. Ramírez-Chaves, H. E. et al. Mammalian development does not recapitulate
40. Weisbecker, V., Goswami, A., Wroe, S. & Sánchez-Villagra, M. R. Ossification suspected key transformations in the evolutionary detachment of the
heterochrony in the therian postcranial skeleton and the marsupial-placental mammalian middle ear. Proc. R. Soc. B Biol. Sci. 283, 20152606 (2016).
dichotomy. Evolution 62, 2027–2041 (2008). 69. Slaughter, B. H., Pine, R. H. & Pine, N. E. Eruption of cheek teeth in
41. Chew, K. Y., Shaw, G., Yu, H., Pask, A. J. & Renfree, M. B. Heterochrony in the insectivora and carnivora. J. Mammal. 55, 115–125 (1974).
regulation of the developing marsupial limb. Dev. Dyn. 243, 324–338 (2014). 70. Hermanson, J. W., Lahunta, A. de & Evans, H. E. Miller and Evans’ Anatomy
42. Keyte, A. L. & Smith, K. K. Developmental origins of precocial forelimbs in of the Dog. (Elsevier Health Sciences, 2020).
marsupial neonates. Development 137, 4283–4294 (2010). 71. Adams, D. C., Collyer, M. L. & Sherratt, E. geomorph: software for geometric
43. Wakamatsu, Y., Nomura, T., Osumi, N. & Suzuki, K. Comparative gene morphometric analyses. R package version 2.1.6. Available from
expression analyses reveal heterochrony for Sox9 expression in the cranial neural URL http://cran.r-project.org/web/packages/geomorph/index.html. (2016).
crest during marsupial development. Evol. Dev. 16, 197–206 (2014). 72. Collyer, M. L. & Adams, D. C. RRPP: an r package for fitting linear models to
44. Sánchez-Villagra, M. R. Why are there fewer marsupials than placentals? On high-dimensional data using residual randomization. Methods Ecol. Evol. 9,
the relevance of geography and physiology to evolutionary patterns of 1772–1779 (2018).
mammalian diversity and di sparity. J. Mamm. Evol. 20, 279–290 (2013). 73. Goswami, A. & Finarelli, J. A. EMMLi: a maximum likelihood approach to the
45. Martín-Serra, A. & Benson, R. B. J. Developmental constraints do not influence analysis of modularity. Evolution 70, 1622–1637 (2016).
long-term phenotypic evolution of marsupial forelimbs as revealed by
interspecific disparity and integration patterns. Am. Nat. 195, 547–560 (2020).
46. Garland, K., Marcy, A., Sherratt, E. & Weisbecker, V. Out on a limb: Acknowledgements
bandicoot limb co-variation suggests complex impacts of development and We thank Aren Gunderson and Link Olson from the University of Alaska Museum for loan
adaptation on marsupial forelimb evolution. Evol. Dev. 19, 69–84 (2017). of wolf specimens, Katie Smith and Kevin Rowe from Museums Victoria for loan of
47. Weisbecker, V. et al. Individual variation of the masticatory system dominates thylacine specimens; Justin Adams, Allister Evans, and Tahlia Pollock (Monash University)
3D skull shape in the herbivory-adapted marsupial wombats. Front. Zool. 16, for access to juvenile thylacine CT scan data and assistance with specimen aging based on
1–14 (2019). tooth eruption patterns; Stephan Spiekman for access to marsupial pouch young cranial
48. Feigin, C. Y., Newton, A. H. & Pask, A. J. Widespread cis -regulatory models; Sharleen Sakai (National Science Foundation; ISO 1146614) for access to juvenile
convergence between the extinct Tasmanian tiger and gray wolf. Genome Res. and adult wolf cranial models; and Jay Black from the Trace Analysis for Chemical, Earth
29, 1648–1658 (2019). and Environmental Sciences (TrACEES) platform from the Melbourne Collaborative
49. Newton, A. H. et al. Letting the ‘cat’ out of the bag: pouch young development Infrastructure Research Program at the University of Melbourne for CT scanning.
of the extinct tasmanian tiger revealed by X-ray computed tomography. R.
Soc. Open Sci. 5, 171914 (2018). Author contributions
50. Geiger, M. et al. Neomorphosis and heterochrony of skull shape in dog A.H.N., C.A.H., and A.J.P. conceived the study. V.W. assisted with experimental design.
domestication. Sci. Rep. 7, 1–9 (2017). A.H.N. performed CT data acquisition and reconstruction, meshing, and landmark
51. Sakai, S. T., Whitt, B., Arsznov, B. M. & Lundrigan, B. L. Endocranial acquisition. A.H.N. and C.A.H. performed morphometric analysis. C.A.H. performed sta-
development in the Coyote (Canis latrans) and Gray Wolf (Canis lupus): a tistical testing and modularity analysis. A.H.N. wrote the manuscript with assistance from
computed tomographic study. Brain. Behav. Evol. 91, 65–81 (2018). all co-authors.
52. Sleightholme, S. R. & Campbell, C. R. A retrospective review of the breeding
season of the thylacine; Guiler revisited. Aust. Zool. 37, 238–244 (2014).
53. Drake, A. G. Dispelling dog dogma: an investigation of heterochrony in dogs Competing interests
using 3D 540 geometric morphometric analysis of skull shape. Evol. Dev. 13, The authors declare no competing interests.
204–213 (2011).
54. Drake, A. G. Dispelling dog dogma: an investigation of heterochrony in dogs
using 3D geometric morphometric analysis of skull shape. Evol. Dev. 13,
Additional information
Supplementary information is available for this paper at https://doi.org/10.1038/s42003-
204–213 (2011).
020-01569-x.
55. Bardua, C., Wilkinson, M., Gower, D. J., Sherratt, E. & Goswami, A.
Morphological evolution and modularity of the caecilian skull. BMC Evol.
Correspondence and requests for materials should be addressed to A.H.N. or C.A.H.
Biol. 19, 1–23 (2019).
56. Adams, D. C. Evaluating modularity in morphometric data: challenges with
Reprints and permission information is available at http://www.nature.com/reprints
the RV coefficient and a new test measure. Methods Ecol. Evol. 7, 565–572
(2016).
Publisher’s note Springer Nature remains neutral with regard to jurisdictional claims in
57. Marshall, A. F. et al. High-density three-dimensional morphometric analyses
published maps and institutional affiliations.
support conserved static (intraspecific) modularity in caecilian (Amphibia:
Gymnophiona) crania. Biol. J. Linn. Soc. 126, 721–742 (2019).
58. Bennett, C. V. & Goswami, A. Statistical support for the hypothesis of
developmental constraint in marsupial skull evolution. BMC Biol. 11, 52 (2013). Open Access This article is licensed under a Creative Commons
59. Smith, K. K. Comparative patterns of craniofacial development in eutherian Attribution 4.0 International License, which permits use, sharing,
and metatherian mammals. Evolution 51, 1663 (1997). adaptation, distribution and reproduction in any medium or format, as long as you give
60. Janis, C. M. & Figueirido, B. Forelimb anatomy and the discrimination of the appropriate credit to the original author(s) and the source, provide a link to the Creative
predatory behavior of carnivorous mammals: the thylacine as a case study. J. Commons license, and indicate if changes were made. The images or other third party
Morphol. 275, 1321–1338 (2014). material in this article are included in the article’s Creative Commons license, unless
61. Smith, K. K. Early development of the neural plate, neural crest and facial indicated otherwise in a credit line to the material. If material is not included in the
region of marsupials. J. Anat. 199, 121–131 (2001). article’s Creative Commons license and your intended use is not permitted by statutory
62. Spiekman, S. N. F. & Werneburg, I. Patterns in the bony skull development of regulation or exceeds the permitted use, you will need to obtain permission directly from
marsupials: high variation in onset of ossification and conserved regions of the copyright holder. To view a copy of this license, visit http://creativecommons.org/
bone contact. Sci. Rep. 7, 1–11 (2017). licenses/by/4.0/.
63. Hallgrímsson, B. et al. Deciphering the palimpsest: studying the relationship
between morphological integration and phenotypic covariation. Evol. Biol. 36,
355–376 (2009). © The Author(s) 2021
COMMUNICATIONS BIOLOGY | (2021)4:51 | https://doi.org/10.1038/s42003-020-01569-x | www.nature.com/commsbio 9You can also read