Optical spectroscopy for in vivo medical diagnosis-a review of the state of the art and future perspectives - IOPscience
←
→
Page content transcription
If your browser does not render page correctly, please read the page content below
Progress in Biomedical Engineering

TOPICAL REVIEW

Optical spectroscopy for in vivo medical diagnosis—a review of the state
of the art and future perspectives
To cite this article: Jang Ah Kim et al 2020 Prog. Biomed. Eng. 2 042001

View the article online for updates and enhancements.

                               This content was downloaded from IP address 46.4.80.155 on 25/10/2020 at 02:26
Prog. Biomed. Eng. 2 (2020) 042001 https://doi.org/10.1088/2516-1091/abaaa3
Progress in Biomedical Engineering
TOPICAL REVIEW
Optical spectroscopy for in vivo medical diagnosis—a review of the
OPEN ACCESS
state of the art and future perspectives
RECEIVED
20 February 2020 Jang Ah Kim1,3, Dominic J Wales1,3 and Guang-Zhong Yang1,2
REVISED 1
21 June 2020 The Hamlyn Centre for Robotic Surgery, Imperial College London, London, SW7 2AZ, United Kingdom
2
Institute of Medical Robotics, Shanghai Jiao Tong University, Shanghai 200240, People’s Republic of China
ACCEPTED FOR PUBLICATION 3
29 July 2020
These authors contributed equally.
PUBLISHED
E-mail: j.a.kim@imperial.ac.uk and gzyang@sjtu.edu.cn
26 August 2020
Keywords: optical diagnosis, spectroscopy, fluorescence, Raman scattering, elastic optical scattering
Original content from
this work may be used
under the terms of the
Creative Commons
Abstract
Attribution 4.0 licence. When light is incident to a biological tissue surface, combinations of optical processes occur, such
Any further distribution as reflection, absorption, elastic and non-elastic scattering, and fluorescence. Analysis of these light
of this work must
maintain attribution to interactions with the tissue provides insight into the metabolic and pathological state of the tissue.
the author(s) and the title
of the work, journal Furthermore, in vivo diagnosis of diseases using optical spectroscopy enables in situ rapid clinical
citation and DOI. decisions without invasive biopsies. For in vivo scenarios, incident light can be delivered in a highly
localized manner to tissue via optical fibers, which are placed within the working channels of
minimally invasive clinical tools, such as endoscopes. There has been extensive development in the
accuracy and specificity of these optical spectroscopy techniques since the earliest in vivo examples
were published in the academic literature in the early ‘90s, and there are now commercially
available systems that have undergone medical and clinical trials. In this review, several types of
optical spectroscopy techniques (elastic optical scattering spectroscopy, fluorescence spectroscopy,
Raman spectroscopy, and multimodal spectroscopy) for the diagnosis and monitoring of diseases
states of tissue in an in vivo setting are introduced and explored. Examples of the latest and most
impactful works for each technique are then critically reviewed. Finally, current challenges and
unmet clinical needs are discussed, followed by future opportunities, such as point-based
spectroscopies for robot-guided surgical interventions.
1. Introduction
Tissue-based diagnosis in medicine is the determination of the disease state of tissue/s within the body [1].
Its use during image-guided interventional procedures, such as endoscopy, bronchoscopy or laparoscopy can
be achieved with observation by a trained clinician, although confirmation of diseases states may necessitate
biopsy of the suspect tissue. However, the turnaround time of subsequent histopathological analysis of the
biopsy sample, especially if on the order of days to weeks, can cause delays and complications, contributing
to increased morbidity and mortality rates [2]. An alternative technique is point-based optical diagnosis.
These point-based optical diagnosis techniques are used to measure optical characteristics of tissues in vivo.
Because the optical properties of healthy and diseased tissues differ, this enables determination of the disease
state of the tissue. Therefore, faster analysis and diagnosis of the disease state of the tissue leads to a higher
rate of positive diagnosis and improved patient outcomes due to faster administering of the required
treatment. Furthermore, this approach significantly reduces the trauma to the surrounding tissues as no
invasive tissue biopsy is required. In addition, it is estimated that optical diagnosis will also increase
surveillance intervals and thus reduce associated costs [3].
Consequently, point-based optical diagnosis techniques have enjoyed considerable research and
commercial attention. There have been significant advances in the accuracy and specificity of these
techniques since the earliest in vivo examples were published in the academic literature in the early ‘90s, and
now there are commercially available systems that have undergone medical and clinical trials. However,
optical diagnosis techniques have not fully replaced traditional biopsy techniques due to high cost and the
© 2020 The Author(s). Published by IOP Publishing Ltd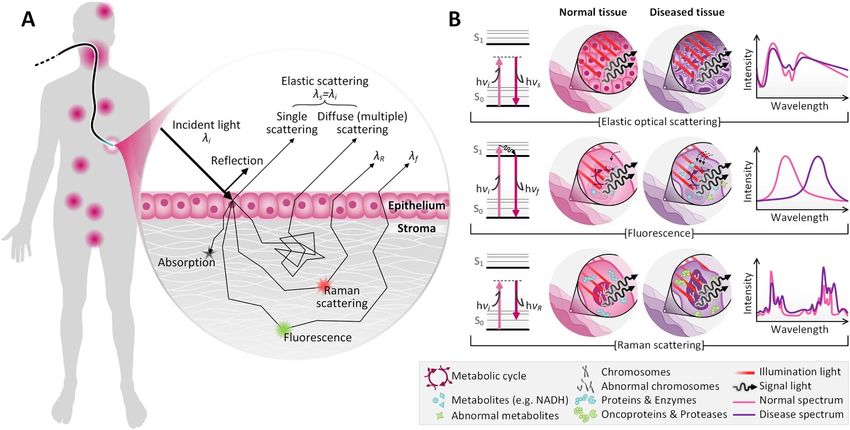
Prog. Biomed. Eng. 2 (2020) 042001                                                                    J A Kim et al

requirement for expert practitioners. Despite this, the future of point-based optical diagnosis systems is
bright as the combination of multiple different techniques could revolutionalize the current clinical
diagnosis paradigm. In addition, optical diagnosis techniques will allow for the advancement of
robot-guided interventions.
    Herein this review, a physical background to optical diagnosis techniques will be given, the state of the art
will be critically assessed and future perspectives and opportunities will be highlighted to enable further
advancements in this continually growing field.

2. Scope of the review

This review will cover deep, in vivo and quasi-real-time point-based spectroscopy, otherwise referred to as
‘optical diagnosis’. In this review, the term ‘deep’ is defined as placement of the optical probe assembly inside
the body either via a natural lumen or a surgical incision/opening. The term ‘in vivo’ in this review refers to
optical measurements of biological tissue (excluding blood) performed on either animal (developmental
work) or human subjects that were not performed ‘ex vivo’ or ‘in vitro’. In addition, we have only included
animal studies where the animal was alive during the measurements. The term quasi-real-time is defined as
optical measurements on a timeframe (ca. microseconds to minutes) that allows for a clinician or surgeon to
make a medical decision during a medical operation or procedure. Finally, point-based spectroscopy is
defined as a spectroscopic optical measurement performed at an individual site on/in biological tissue during
the acquisition of the spectrum or spectra, and is not a wide-area imaging or raster-scanning based
measurement. A ‘site’ is defined by the dimensions of the probe (if the probe is in direct contact with the
tissue) or illumination spot, which is typically a few tens or hundreds of micrometers in diameter. This
approach is in contrast to imaging techniques, which typically illuminate and collect light from much larger
areas, ca. millimeters to centimeters. Therefore, this review does not cover endoscopic imaging measurements
of tissues, but for the interested readers, there are many excellent reviews [4–8]. To achieve medical diagnosis
using optical spectroscopic data, data processing techniques and diagnostic algorithms are crucial.
Substantial research on the development of algorithms is ongoing. The focus of this review is mostly centered
on the hardware of the optical diagnosis systems, since the aim of this review is to introduce the fundamentals
of light-tissue interactions and the latest clinical examples of in vivo optical diagnosis technologies. Further
brief discussion about diagnostic algorithms based on machine learning techniques is given in section 6.
Current status and future perspectives, but for a more complete overview we point interested readers to the
literature [9–13]. Finally, this review focuses on the most recent examples of in vivo use optical diagnosis
techniques, or on the techniques with the highest technical readiness levels. However, it should be noted that
in each section there is a thorough list of references describing previous works for each technique.

3. Theoretical and technical background of real-time in vivo optical diagnosis

When light is incident to a tissue surface, it can result in a combination of various optical processes, such as
reflection, absorption, scattering, and fluorescence (figure 1(A)). Spectroscopic analysis of each of these
optical processes provides various information of the optical properties of tissues that can be diagnostically
meaningful. Among the wide range of available techniques, elastic scattering spectroscopy, fluorescence
spectroscopy, and Raman spectroscopy are the techniques that have been most intensively developed and
implemented for point-based, real-time in vivo optical diagnosis deep inside the body, and therefore, these
three spectroscopic techniques are discussed in this review. Generally, each spectroscopic technique is
applicable to different diagnostic factors of interest. Elastic optical scattering spectroscopies (EOSS) are used
to measure cellular/subcellular morphology of the epithelial layer. Diseased tissues (e.g. inflamed tissues and
tumor tissues) exhibit abnormal cellular/subcellular morphologies, such as loosening of epithelial barrier,
enlarged nucleus, cell crowding and disorganization, etc [14], which induce differences in the EOSS spectra
between normal and diseased tissues (figure 1(B) Elastic optical scattering). Fluorescence spectroscopies
(FS) provide the state of cell metabolism. Metabolic pathways are disrupted in diseased cells, and thus the
redox balance and the concentration of metabolites change as disease progresses. For example, the metabolic
activity of cancerous cells is enhanced as tumors develop, resulting in increased production of NADPH (the
reduced form of nicotinamide adenine dinucleotide phosphate) and metabolites (e.g. lactate) [15]. Changes
in concentration of these cofactors (NADPH) and metabolites upon disease progression can be characterized
with FS using either intrinsically fluorescent endogeneous fluorophores or tagged with exogenous
fluorophores (figure 1(B) Fluorescence). Finally, Raman spectroscopies (RS) are used to interrogate the
molecular signature of the tissue. All the aforementioned pathological features of diseased tissues and cells
also play a role in diagnosis using RS. More specifically, RS provides information on chemical composition
and structure of target analytes. Since fundamentally most biomolecules are Raman active, changes in the

                                             2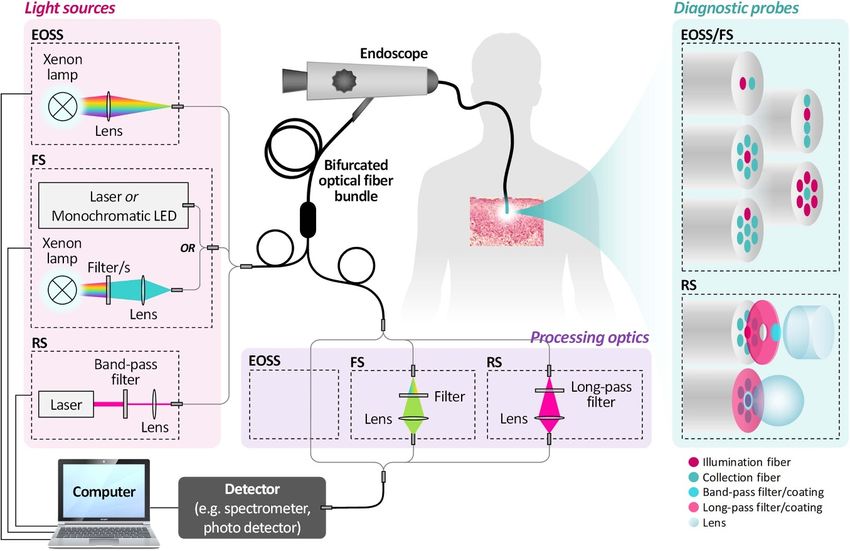
Prog. Biomed. Eng. 2 (2020) 042001                                                                                                J A Kim et al

   Figure 1. Target locations of point-based in vivo optical diagnosis, types of light-tissue interactions and spectroscopic diagnosis
   mechanisms of elastic optical scattering, fluorescence, and Raman scattering. (A) Point-based in vivo diagnosis can be utilized
   where current minimally invasive surgery/intervention, flexible endoscopy, and natural orifice transluminal endoscopic surgery
   can access, e.g. upper/lower gastrointestinal tract, artery, heart, bladder, cervix, etc (left). Several optical processes occur at the
   uppermost layers of tissues (from epithelial layer to stromal layer) as a result of light-tissue interaction; surface specular reflection,
   absorption, elastic optical scattering, fluorescence, and Raman scattering (right). λi , λs , λf , and λR are wavelengths of incident
   light, elastically scattered light, fluorescence, and Raman scattering, respectively. (B) Representative illustrations of Jablonski
   diagrams for each spectroscopic technique, where S0 , S1 , h, and ν represent the ground energy level, the excited energy level,
   Planck’s constant, and frequency of light (left), respectively. The dotted lines in the Jablonski diagrams for elastic scattering and
   Raman scattering represent virtual energy levels. Spectroscopic techniques based on elastic optical scattering, fluorescence, and
   Raman scattering are capable of disease diagnosis by characterizing cellular/subcellular structures, cell metabolism states, and
   molecular signatures of normal and diseased tissues, respectively (middle). Illustrative examples of the differences in
   spectroscopic features between normal and diseased tissues (right).

concentration, deformation and mutation, and production of new compounds due to disease can exhibit
distinctive RS signals (figure 1(B) Raman scattering). Indeed, in cancer progression, quantities and/or
conformation of nucleic acids, proteins, lipids, and carbohydrates change [16]. In this section, the
introductory overview of these three main spectroscopic techniques used for optical diagnosis is addressed.

3.1. Elastic optical scattering spectroscopy (EOSS)
3.1.1. Physical background
Light scatters when encountering any spatial inhomogeneity in refractive index. Micro and nanoscale
particles in gas or liquid media are the simplest scattering models and, in most cases, the process does not
entail changes in photon energy (hν s = hν i , so called ‘elastic’ as shown in figure 1(B) Elastic optical
scattering, cf Raman scattering as an ‘inelastic’ scattering process that entails energy loss or gain. Details in
section 3.2). Scattering in tissue is significantly more complex due to the high sub-microscopic complexity of
tissues, which is interlinked with local refractive index variation. Indeed, the refractive index of tissue (n) can
be defined as n = n0 + αρ, where n0 is the refractive index of the liquid medium (i.e. water), α is the
proportionality coefficient, and ρ is the portion of tissue solids (e.g. proteins, lipids, DNA, etc) by volume, all
of which significantly vary in different tissue types and are difficult to quantify precisely. Overall, size, shape,
refractive index, size distribution, and number density of cellular/subcellular structures determine spectral
features of the scattered light. Measurement of light scattering in tissue can therefore be particularly useful
for diagnosis of disease states that accompany changes in cellular/subcellular morphology and spatial
distribution—i.e. neoplastic development of epithelia from dysplasia to invasive cancer (despite a
dependence on types of epithelia and types of cancer).
    In tissue optics, key parameters that characterize the light scattering are the scattering cross sections, σ s
(describing the total scattering power of a scattering object), the scattering coefficient, µs (the probability of a
photon to be scattered), the anisotropy coefficient, g (the tendency to be scattered forwardly, i.e. forward
scattering g = 1, isotropic scattering g = 0, backscattering g = −1), and the reduced scattering coefficient,
µ’s = µs (1 − g). These parameters can be derived from the scattering matrix, S, which formally should be
obtained by solving Maxwell’s equations. However, solving Maxwell’s equations for scattering in tissue is very
difficult due to the sub-microscopic complexity as mentioned above. Therefore, use of approximations or
numerical methods to calculate the scattering matrix is unavoidable. Although there are several

                                                          3
Prog. Biomed. Eng. 2 (2020) 042001                                                                     J A Kim et al

approximations available to calculate the scattering matrix, such as the Rayleigh scattering model, the
Rayleigh-Gans-Debye (RGD) approximation, the Van de Hulst approximation, etc, none of these approaches
alone can precisely describe scattering events by cellular/subcellular structures in tissue because each
approach is only valid for limited ranges of scatterer size and the relative refractive index. For example, the
Rayleigh scattering model is valid when the scatterer is very small, ka ≪ 1 where k = 2π λ−1 is the
wavenumber of the light, λ is wavelength of the light, a is the scatterer’s radius, which cannot apply to
subcellular organelles greater than 50 nm in visible range (i.e. nucleus—5–10 µm, mitochondria—1–2 µm in
the long axis and 0.2–0.8 µm in the short axis, lysosomes—250–800 nm, peroxisomes—200–1000 nm). RGD
approximation, on the other hand, is valid when ka |n ′ − 1| > 1 where n’ = norganelle /ncytoplasm is the relative
refractive index. Considering that the refractive index of most subcellular organelles ranges from 1.38 to 1.42
and that of the cytoplasm is within 1.34 to 1.36 (thus n’ − 1 ≈ 0.01–0.05), the RGD approximation works
well for describing scattering events by the majority of subcellular organelles except the nucleus [17].
However, it is not sufficient to describe forward scattering that is dominant in scattering events by larger
scatterers (i.e. nuclei). The Van de Hulst approximation can describe forward scattering by larger scatterers
when two conditions are met: ka |n ′ − 1| > 1 and |n ′ − 1| ≪ 1. Nevertheless, backscattering can be easily
neglected by this approach. Approximation of the nucleus as a spherical scatterer, however, enables the exact
solution by the Mie theory. Although the Mie theory is valid for isolated homogeneous spheres, which does
not represent tissue sub-microscopic structures, it has been widely accepted for describing scattering in
tissue. This is partly due to a lack of better alternatives, but, more importantly, because it is still able to
provide an important physical picture of scattering from subcellular organelles of any size. Since the Mie
theory is an exact solution of Maxwell’s equations, numerical methods, such as finite-difference
time-domain (FDTD) calculations, T-matrix, discrete dipole approximation (DDA), etc, are required. Lists
of scattering properties (e.g. µs , g, µ’s , n) of different tissues reported, and details of the approximation
approaches are available in ref [18] and ref [19], respectively.

3.1.2. Technical background
In vivo spectroscopy in general needs three fundamental elements—a light source, a detector, and a
fiber-optic probe that guides source light to analytes and collects and guides back the signal light to the
detector. Selection of appropriate light source, detector, and probe design is essential to facilitate reliable
measurement. Additional optics, such as lenses, filters, polarizers, and beam splitters may also be required for
further treatment of the source/signal light. For EOSS, broadband light sources are used since the scattering
parameters listed in the previous section are functions of wavelength. Xenon lamps, nearly uniformly
emitting from ultraviolet (UV) to near infrared (NIR) range (320 to 900 nm), are generally preferred for
EOSS as shown in figure 2. Other white light sources (e.g. white light LED), of which wavelengths are within
visible range from 500 nm to 700 nm, also perform well for EOSS. This point, along with the fact that EOSS
does not typically require extra optics for light source and detector, permits the measurement system to be
inexpensive and simple. However, absorption by chromophores (e.g. hemoglobin, water, fat, melanin, etc)
interferes the EOSS measurement by adding extra complexity to the resulting spectra in this wavelength
range. Soret band (400 to 440 nm) and Q band (540 to 580 nm) are the most prevalent and intense
absorption features by hemoglobin and its oxygen saturation levels. Although absorption by water molecules
is negligible within the working wavelength range below 900 nm, absorption coefficient of fatty tissues and
melanin may induce unwanted spectral features to the EOSS spectra. Since elimination of the absorption
effect by these existing chromophores, especially in an in vivo environment, is often impossible, an
empirically modeled absorption coefficient of tissue should be taken into account in order to extract a useful
EOSS signal containing information about cellular/subcellular structures of tissues. Monte Carlo simulation
has often been performed prior to practical trials to estimate contributions of both absorption and scattering.
    Specular reflection at the probe-tissue contact and diffuse reflection resulting from multiple scattering
are another concurrent event to be dealt with when measuring backscattered light from a tissue. These events
also add extra background spectral features to the EOSS spectra, leading to difficulties in extraction of
meaningful signal associated with cellular/subcellular structures of tissues. Fortunately, these effects can be
minimized by effective probe designs with appropriate geometries. Bevelled tip-probes [20–22] have been
useful for minimizing reception of specular reflection at the probe-tissue contact through collection fibers.
    Diffuse reflection spectra (DRS) resulting from multiple scattering can be excluded by reducing
separation distance between illumination fiber and collection fiber. Through multiple scattering, the
scattering trajectory is randomized and gets longer (thus reaching laterally far from the illumination fiber)
until when the result scattering signal is collected. Despite varying in different tissue types, this multiple
scattering trajectory can be ranging from a few-hundred-microns to a few millimeters laterally. Therefore,
designing the correct illumination-to-collection fiber separation (Sic ) is important to avoid collecting the
multiple scattering signal. In the working wavelength range from visible to NIR, a rough boundary above

                                              4
Prog. Biomed. Eng. 2 (2020) 042001 J A Kim et al
Figure 2. A comprehensive schematic of implementation settings of the point-based in vivo optical diagnostic techniques; elastic
optical scattering spectroscopy (EOSS), fluorescence spectroscopy (FS), and Raman spectroscopy (RS). In vivo spectroscopy in
general needs three fundamental elements—a light source, a detector, and an optical fiber probe that guides source light to the
tissue and collects and guides back the signal light to the detector. Xenon lamp can be replaced by other broad-band (white) light
sources. Spectrometers are not always preferred, e.g. simple photo detectors can be used for cost-effective and faster FS. Extra
optics for effective light coupling and filtering are sometimes required in front of light sources and detectors (see boxes ‘Light
sources’ and ‘Processing optics’). Typical diagnostic probes contain at least one illumination fiber and one collection fiber,
allowing diverse fiber arrangements (see EOSS/FS section in box ‘Diagnostic probes’). Multiple number of illumination fibers and
collection fibers are used in order to improve signal collection efficiency (1 illumination fiber/6 collection fiber and 6 illumination
fibers/1 collection fiber, the latter is adapted with permission from [23] © The Optical Society). These fibers can be arranged
linearly (1 illumination fiber/3 collection fibers), adapted with permission from [21] © The Optical Society, or off-centered (1
illumination fiber/6 collection fibers), Copyright © 2017, Springer Nature. For RS probes, additional filters and lenses at the distal
end are also favorable to maximize the performance (see RS section in box ‘Diagnostic probes’). The probe schematic with a rod
lens is from [254]. Reprinted with permission from AAAS. The probe schematic with a ball lens is adapted with permission from
[261] © The Optical Society.
which multiple scattering events occur can be designated as Sic ≈ 350 µm (i.e. multiple scattering signal is
collected by a probe with Sic ≥ 350 µm).
An EOSS probe includes at least an illumination optical fiber and a collection optical fiber. Numbers,
diameters, and arrangement of illumination/collection optical fibers may vary depending on applications.
Probe designs with several illumination fibers surrounding a single collection fiber that allow improved
signal collection efficiency have been reported (6 illumination fibers/1 collection fiber [23], 7 illumination
fibers/1 collection fiber [24]). There has been a greater variety of probe designs having a single illumination
fiber but multiple collection fibers (e.g. 1 illumination fiber/2 collection fibers to 10 collection fibers). These
fibers are not always arranged to be axially asymmetric but often linear [21, 25–29] or having an off-centered
illumination fiber [30–32] in order to incorporate various Sic values (thus the scattering angle) within a probe
(see EOSS/FS section in box ‘Diagnostic probes’ in figure 2). These probe configurations allow collecting
both EOSS signal from the uppermost epithelial layer and multiple scattering signal from the deeper tissue as
a background to ultimately enable reliable extraction of EOSS signal from the diffuse reflection signal.
3.2. Fluorescence spectroscopy (FS)
3.2.1. Physical background
Fluorescence is defined as ‘spontaneous emission of radiation (luminescence) from an excited molecular
entity with retention of spin multiplicity’ [33]. A brief overview of the physics of fluorescence will be
discussed here. A detailed explanation of fluorescence is out of the scope of this review, but for the interested
reader a more in depth overview is available here [34–36].
Upon absorption of a photon of the appropriate wavelength in the UV-visible region, an electron within
the ground state (S0 ) of a molecule can be elevated to a higher vibrational state of an excited molecular
5Prog. Biomed. Eng. 2 (2020) 042001 J A Kim et al
singlet state (S1 ), with the electron retaining the same spin as in the ground state. This process occurs in ca.
10–15 s. Then the excited electron most commonly undergoes internal conversion, wherein the electron
relaxes to the lowest vibrational level of S1 and this process occurs in ca. 10–12 s. After internal conversion, the
electron can return to the S0 either radiatively or non-radiatively, depending on the available de-excitation
pathways. The possible non-radiative pathways include quenching, fluorescence resonance energy transfer
(FRET) and other non-radiative decay mechanisms. The radiative pathway is fluorescence. During the
radiative pathway decay to the ground state, the electron releases the excess energy as an emitted photon (ca.
10–8 s, figure 1(B) Fluorescence). In the ideal case, there is a single S1 and a single S0 , thus the mean time
between absorption of a photon and emission of the fluorescence photon is designated as the fluorescence
lifetime, τ. Measurements of absorption and fluorescence (both intensity and lifetimes) of biological tissues
allows for monitoring of changes in electronic energy states of the molecules that comprise the tissue and
thus provides biochemical information for diagnostics.
All biological tissue exhibits endogenous fluorescence, known as autofluorescence, when irradiated with
light of the appropriate wavelength. This is because biological tissues contain many endogenous fluorophores
such as; NADH (the reduced form of nicotinamide adenine dinucleotide), NADPH, flavins, collagen, elastin,
tryptophan, retinol and porphyrins, amongst others [37]. Furthermore, each fluorophore has specific and
characteristic excitation and emission spectra.
The concentration of endogenous fluorophores within biological tissue can change due to metabolic
changes caused by a range of pathological processes, such as inflammation and dysplasia [37]. Therefore, in
an ideal case, a quantitative measurement of the fluorescent intensity of the autofluorescence spectrum of
tissue, or a particular fluorophore, can reveal the pathological state of the biological tissue. However, in
reality, the situation is more complex, as different fluorophores fluoresce at different intensities, different
wavelengths of excitation light penetrate to different depths into the tissue before complete absorption, and
also wavelength dependent scattering or reabsorption occurs as biological tissues are turbid media [38, 39].
Furthermore, the excitation and emission spectra of multiple fluorophores can overlap and thus an
undesirable ‘background fluorescence’ signal can further complicate the deconvolution of tissue fluorescence
spectra for determination of the concentration of the desired tissue components.
Therefore, several correction strategies have been proposed including the use of the ratio of fluorescence
intensity to reflectance intensity [40], a ratio of fluorescence intensities at two different emission wavelengths
[41] and also more complex correction models based on Kubelka-Munk theory [38]. However, each of these
correction strategies has intrinsic advantages and disadvantages and indeed, work continues to develop faster
and/or more precise correction strategies [42]. To overcome the problems of ‘background fluorescence’ there
are two main solutions. The first is the use of exogenous fluorophores. An exogenous fluorophore is an
externally administered fluorophore that can be chosen to have a particularly intense fluorescence emission
and thus this fluorescence emission can be clearly measured above the background. An additional benefit of
exogenous fluorophores is that they can pre-concentrate in neoplastic tissues and thus further improve the
discrimination of ‘abnormal’ tissue from ‘normal’ tissue. The second solution is the use of wavelength and
band-pass filters to remove the rest of the background fluorescence and this is further discussed in the
technical background sub-section below.
3.2.2. Technical background
Here a brief overview of the technical aspects of point-based fluorescence spectroscopy for tissue
measurements will be discussed. For the interested reader a more in depth overview is available here [43].
Typically a light-induced fluorescence spectroscopy (LIFS) system is used to perform point fluorescence
spectroscopy (as opposed to fluorescence endoscopy imaging [5]). A LIFS system (figure 2, see FS sections)
consists of either a broadband white light source or a monochromatic light source (e.g. continuous-wave or
pulsed lasers, LEDs) coupled into a small-diameter probe, which may consist of either one or a bundle of
optical fibers. In the case of a bundle of optical fibers, some of the fibers deliver the excitation light whilst the
surrounding fibers collect the fluorescence emitted light (figure 2, EOSS/FS section in box ‘Diagnostic
probes’). The probe can be placed within the instrument channel of an endoscope or used independently.
During a measurement, the probe is placed in intimate contact with the tissue for a specific and sufficient
amount of time for the particular measurement, allowing for the emitted fluorescence light to be transmitted
back to the detector via optical filters that filter out the background fluorescence. Commonly, LIFS systems
are used without administering exogenous fluorophores, but the use of exogenous fluorophores combined
with use of a point-based LIFS system has also been reported [44–48]. More recently, LIFS systems have
evolved with time and wavelength resolved systems demonstrated. A driving force for the evolution of the
technique is the difficulty to conduct absolute emission intensity measurements in vivo because
measurements are affected by multiple factors. These factors include physical factors such as tissue
movement and surface profile, which may cause a change in light excitation-collection geometry and
6Prog. Biomed. Eng. 2 (2020) 042001 J A Kim et al
non-uniform illumination, respectively. The confounding photochemical factors are photobleaching and the
presence of, and variation in concentration of, endogenous absorbers.
One way to overcome these challenges is by using the alternative method of time-resolved fluorescence
spectroscopy, in which fluorescence excited state decay lifetimes are also measured as an orthogonal variable.
Time-resolved fluorescence spectroscopy affords several advantages. Firstly, fluorescence lifetimes are
independent of fluorescence intensities, which can be affected by non-uniform illumination and tissue
movement. Additionally, biomolecules and tissues will have unique fluorescence decay lifetimes and thus this
allows for spectral resolution of biomolecules that may have overlapping fluorescence emission spectra.
Fluorescence decay lifetimes are also affected by local changes in the local physiochemical and metabolic
environments of the tissue, due to the effect that the local tissue microenvironment has on quenching rates of
biomolecules. Therefore, further biochemical information from the tissue of interest can be gathered. An
excellent in-depth review on time-resolved fluorescence spectroscopy is provided by Marcu [49].
3.3. Raman spectroscopy (RS)
3.3.1. Physical background
Raman scattering is an inelastic scattering process of a photon that either loses or gains a certain amount of
energy as a result of light–matter interaction. The amount of energy difference expressed by the emitted
photon during the Raman scattering process corresponds to specific vibrational modes of chemical bonds in
a molecule (an example of energy loss process, i.e. Stokes Raman scattering, figure 1(B) Raman scattering).
The energy difference appears as a shift in the spectrum (so called ‘Raman shift’) and the technique that
analyses molecular information of substances (i.e. molecular structure, chemical bonding, functional groups,
interaction between molecules and the surrounding environment, and physical state) by measuring the
Raman shift is Raman spectroscopy (RS). It was first experimentally observed by Chandrasekhara Venkata
Raman in 1928 [50]. Since then, Raman spectroscopy has become an essential analytical tool that is vital in
various applications, such as pharmaceutics [51], forensic science [52–54], mineralogy [55], carbon
materials [56–58], semiconductors [59], and life science [12, 60–62]. This is due to its advantages of high
molecular specificity, high resolution, non-destructive and non-contacting measurement, and flexibility in
sample forms and volumes. In particular, RS facilitates detection of aqueous samples without any
interference of water signals due to insensitivity to molecules with large dipoles, and consequently RS is used
in biomedical applications [62].
RS of biological samples (e.g. tissues and biofluids), therefore, enables detection of characteristic spectral
features indicating the pathological state of the samples. Various vibrating modes of chemical bonds in the
backbones and side-chains of lipids, proteins (complicated combination of motions from different parts of
amino acid backbone and secondary structure), and nucleic acids (from O–P–O backbone and individual
nucleotide bases) participate in the Raman spectra of biological samples [62]. These features are generally
observed in the ‘fingerprint region’ which is from 600 to 1800 cm−1 in a very complex superimposed manner
with multiple sharp peaks. Most of the spectral analysis is done within this range for biological samples.
Some features may also be found in much higher energy range above 2500 cm−1 up to 3400 cm−1 (so called
the ‘high wavenumber region’) mostly indicating independently vibrating hydrogen atoms. RS of biological
samples is sensitive to changes in the chemical compositions of these molecules (lipids, proteins, and nucleic
acids), which can be ascribed to disease states, and thus allows for accurate molecular diagnosis of diseases.
Detailed vibrational modes and corresponding wavenumbers of chemical bonds and structures found in
biological molecules are presented elsewhere [60, 62, 63].
3.3.2. Technical background
Despite the exclusive advantages of RS, it is often referred as an insensitive technique because it is an
inherently weak process occurring approximately once in hundred million compared to elastic (Rayleigh)
scattering [61]. Advancement in high power laser sources and precision optics in the past decades has
allowed reliable performance of RS. Essentially, a band-pass filter (or a laser line filter) is used for refining the
excitation laser quality to be sharp and monochrome and a long-pass/notch filter is required to reject the
Rayleigh scattering (figure 2, see RS sections in boxes ‘Light sources’ and ‘Processing optics’). Nevertheless,
better sensitivity and signal-to-noise level are still required especially for practical applications than
laboratory-based situations. To this end, diverse enhancement techniques have been proposed and
developed, for instance, coherent anti-Stokes Raman scattering (CARS), stimulated Raman scattering (SRS),
surface-enhanced Raman scattering (SERS), tip-enhanced Raman spectroscopy (TERS) and more [64, 65].
Moreover, in vivo RS particularly requires additional attention to the control of background signal.
Auto-fluorescence of tissue may also interfere with the Raman spectrum and degrade the signal-to-noise
ratio. Contribution of autofluorescence can be rejected by selecting the appropriate light-source with the
appropriate excitation wavelength. Because autofluorescence of most common biological tissues appears
7Prog. Biomed. Eng. 2 (2020) 042001 J A Kim et al
under visible range excitation shorter than 700 nm, NIR light allows for minimized fluorescence in biological
tissues. Typically, 785 nm, 830 nm, and 1064 nm NIR lasers are used for RS, although 1064 nm is not suitable
for in vivo application because intensity of the radiation drastically drops with the fourth power of incident
wavelength, which results in a poor signal collection efficiency [62]. Other than control of materials and
components, further technical approaches to reject extra fluorescence have also been achieved in diverse
ways, e.g. modulated Raman spectroscopy (MRS) [66], time-gated RS [67], and Fourier transform RS [68].
In addition to the autofluorescence of tissues, silica—a typical material for optical fibers—exhibits a very
strong photoluminescence background appearing as broad humps in Raman spectra. It easily overwhelms
narrow and relatively weak Raman peaks, unless rejected, resulting in deterioration of the signal quality. To
minimize this, various approaches have been proposed. For instance, integration of filtering and beam
steering optics at the distal end of the probes [69–76] (figure 2, see RS section in box ‘Diagnostic probes’)
and using other types of fibers such as hollow-core fiber [77], photonic crystal fiber (PCF), and double-clad
fiber (DCF) [78] have been reported so far. Despite the huge effort, the fluorescence background cannot be
completely removed and generally remains in the collected spectra. Post-processing of the collected signals is,
therefore, always required to minimize both fluorescent artefacts in the final spectra. Polynomial fitting and
subtraction of background are carried out regardless of configuration, with and without additional optics or
different materials as mentioned above [79–82].
3.4. Multimodal spectroscopy
All of the techniques mentioned above have inherent advantages and disadvantages. Therefore, in an attempt
to overcome the drawbacks of each individual technique, and to combine the advantages, there have been
many examples of combining multiple spectroscopic techniques into one device. For example, FS generally
has a high signal strength, but lacks specificity, whereas RS has a high degree of specificity and sensitivity to
chemical/molecular changes in tissue, but has low signal strength. Therefore, a combination of the two
orthogonal modalities allows for the mitigation of the drawbacks of both techniques and allows for more
metabolic and pathological information to be gathered during the optical diagnosis [83].
Combined spectroscopy systems are referred to as multimodal spectroscopy devices and invariably the
light is delivered to the tissue and collected from the tissue through the same probe assembly. Typically, FS is
combined with one or more other techniques, such as FS combined with DRS (FS + DRS) or FS combined
with both RS and DRS (FS + Raman + DRS).
4. Technology readiness levels (TRLs)
A technology readiness level (TRL) is a formal metric-based measurement of the maturity of hardware
and/or software to be used in a system [84]. Therefore, in terms of clinical systems, such as optical diagnosis
systems, TRLs can provide an overview metric on the progress of the system, from an initial concept or idea
(TRL = 1) up to commercially validated and available (TRL = 9). Thus, in table 1, the highest TRLs for each
optical diagnosis system defined in the sections above are given to provide an overview of the maturity of
each technique, when applied to diagnosis within each organ system. We have determined the TRL levels of
the spectroscopic techniques based on the definitions given by the US Department of Defense and Puppels
et al [84, 85].
Typically, TRLs 1 & 2 are assigned to technologies that are at initial conceptual stages and these are not
considered in this review. Here we have reviewed/meta-analyzed technologies that are at a level of maturity
indicated by a TRL of ≥3. Therefore, we have grouped TRLs 3–9 into the following groups; Group A: TRLs
3–4, Group B: 5–7 and Group C: 8–9. Our particular sorting of the TRLs into these groups was guided by the
TRL milestone groups as suggested by the US Department of Defense [86]. Thus, classification Group A
contains technologies/systems that have been demonstrated in preliminary laboratory and/or animal model
experiments, with some degree of analysis development, such as algorithms. Classification Group B contains
technologies/systems that have been demonstrated and tested in clinical environments and trials, preferably
in multiple-center trials. Finally, Group C contains technologies/systems that have been released to end-users
commercially, with TRL = 9 representing a fully distributed and marketed product.
As can be seen in table 1, each technology has a different TRL when taking into account the different
target organ systems that the technology has been used on. One of the main reasons for this is the challenge
of accessibility of each probe design to each particular target organ system, when considering minimally
invasive surgery (MIS) and intervention. For example, the optical diagnosis systems used for diagnostic
measurements in the alimentary tract are generally the most mature. This is due to the easily accessible
lumen (esophagus) and the plethora of available endoscopic devices designed for the alimentary tract, which
can be easily adapted to contain optical diagnosis probes within the endoscope working channel.
8Prog. Biomed. Eng. 2 (2020) 042001 J A Kim et al
Table 1. Spectroscopic techniques categorized by TRL classification groups (Group A: TRLs 3–4, Group B: 5–7 and Group C: 8–9)—a
measure of the maturity of each technology.
Techniques Target organ TRL group
EOSS Alimentary tract B
Brain A
Cervix A
Liver B
Lung B
Pancreas B
FS Alimentary tract C
Arteries & heart C
Bladder B
Brain B
Breast B
Cervix C
Endocrine B
Head & neck B
Liver B
Lungs B
Prostate B
RS Alimentary tract B
Artery B
Bladder A
Brain B
Breast A
Cervix B
Head & neck B
Lung A
FS + Doppler Flowmetry Brain B
FS + DRS Alimentary tract B
Arteries & heart A
Bladder A
Brain B
Cervix C
Head & neck B
Liver B
FS + DRS + EOSS Alimentary tract B
Cervix B
Head & neck B
FS + RS + DRS Alimentary tract A
Arteries & heart A
Brain B
Breast A
Head & neck B
Lung A
FS + RS Breast A
Head & neck B
5. Clinical examples of spectroscopic sensing techniques
For brevity, only the most recent examples in the literature of the different optical diagnosis systems will be
described. In addition, for each technique, the current state-of-the-art in terms of higher TRL groups will be
discussed. However, it should be noted that for each technique there will be a comprehensive list of references
of published deep and in vivo optical diagnosis measurements grouped by organ/disease types for the
reader’s interest, except for the multimodal spectroscopy section, wherein the references are grouped by
spectroscopic technique.
5.1. Examples of EOSS
Examples of EOSS as a tool for diagnosis of disease by measuring different scattering coefficients of normal
and abnormal tissues have been demonstrated for brain [87, 88], cervix [23, 30], gastrointestinal tracts
[11, 28, 89–93], esophagus [94–96], head and neck (larynx, pharynx, oral cavity) [97], and pancreas [29, 32].
9Prog. Biomed. Eng. 2 (2020) 042001 J A Kim et al
There are three representative EOSS probes that are considered as the most mature and have been
demonstrated on patients (figure 3). One was initially developed by, and its diagnostic algorithm for in vivo
colorectal cancer screening was demonstrated by, Bigio and colleagues, in 2011 (elastic scattering
spectroscopy, ESS) [11, 91]. A dual fiber probe (outer diameter of 0.47 mm) comprised of an illumination
fiber and a collection fiber, both having 200 µm core diameter, was integrated within a central lumen of
conventional biopsy forceps. The center-to-center separation, or Sic , between the fibers was 250 µm, which
allows for ESS interrogation of 350 µm in depth which corresponds to a volume smaller than 0.2 mm3 . The
jaws of the forceps were opened and the central optical probe was gently placed in contact with the tissue
surface to take rapid ESS measurements when a polyp or suspicious growth was observed during the
colonoscopy. Cooperative physical biopsy collection was also carried out by closing the jaws of the forceps
once the optical readings were obtained. A compact table-top ESS system was also developed alongside with
the probe. A clinical feasibility of this system was demonstrated for differentiation of neoplastic polyps from
non-plastic polyps from 83 patients [32] (figure 3. I.). From the ESS measurement of 218 polyps (133
non-neoplastic and 85 neoplastic as histopathologically classified) a sensitivity of 91.5%, specificity of 92.2%,
and accuracy of 91.9% with a high-confidence rate of 90.4% was achieved. Importantly, the group
demonstrated that diminutive polyps that are smaller than 5 mm (n = 157) were successfully identified by
ESS with a slightly lower sensitivity, specificity, and accuracy. These results were particularly promising
because screening of neoplasia in polyps smaller than 5 mm directly relates to the American Society for
Gastrointestinal Endoscopy (ASGE) Preservation and Incorporation of Valuable Endoscopic Innovations
(PIVI) guidelines for the real-time endoscopic assessment for the histology of diminutive colorectal polyps.
The other probe was developed by Backman et al in 2012 [21]. The working principle of the
low-coherence enhanced backscattering spectroscopy (LEBS) technique that they developed fundamentally
shares the same physical background with EOSS, but includes extra features of the enhanced backscattering
spectroscopy (EBS) technique. In particular, they took into account enhancement of the backscattered light
around the exact backscattering direction, that is caused by the constructive interference of light waves
propagating along a pair of time-reversal trajectories. This approach allowed EBS to be wavelength-sensitive
and depth-selective so that it was effective for tissue diagnosis. The probe comprised of linear arrangement of
four optical fibers—an illumination fiber and three collection fibers (core/cladding diameter of
50/60 µm)—that allowed for an angle-resolved backscattering measurement facilitating diffuse background
correction (figure 3.II.(A)). Furthermore, a bevelled glass rod with 9.5◦ was placed at the tip of the probe
(outer diameter of 3.4 mm) in order to minimize specular reflection. The researchers demonstrated the LEBS
probe for pancreatic cancer screening by examination of duodenal mucosa during upper endoscopy on 41
patients [29]. By using the probe, test performance with sensitivity of 78%, specificity of 85%, and accuracy
of 81% was achieved for in vivo identification of pancreatic adenocarcinoma. Backman’s group also
demonstrated the LEBS probe for colorectal cancer diagnosis from 619 patients that showed sensitivity of
88% and specificity of 72% for rectal adenoma identification [17].
Finally, Perelman et al developed a spatial gating light scattering spectroscopy (LSS) probe that can
distinguish precancerous pancreas tissue from benign cysts during endoscopic ultrasound-guided
fine-needle aspiration (EUS-FNA) procedures (figure 3.III.) [32]. The 0.45 mm outer diameter spatial gating
probe (figure 3.III. left) consisted of seven 100 µm core diameter fibers. A fiber in the outer ring of the probe
for illumination and three groups of collection fibers provided illumination-collection separations, Sic , of
120, 220 and 240 µm. A probe-latching mechanism enabling precise extension and retraction of the probe
through EUS-FNA needle with position-locking was also developed for improved clinical effectiveness and
practicality. While the collection fiber at Sic = 120 µm collected signal resulting in both single-scattering and
multiple scattering, the other collection fiber at Sic = 240 µm collected multiple scattering signal alone
(figure 3.III. right panel c). This facilitated correction of multiple scattering (diffuse reflection) signal and
allowed effective extraction of single-scattering signal containing meaningful diagnostic information (figure
3.III. right panel d). Perelman and colleagues demonstrated the LSS probe for prediction of the potential
malignancy of pancreatic cystic lesions (e.g. benign, low-grade dysplasia, high-grade dysplasia) during
EUS-FNA procedures on 25 patients. In total, 14 cysts were measured in vivo and 13 postoperatively, and
overall, an accuracy of 95%, a sensitivity of 90%, and a specificity of 100% was achieved.
5.2. Examples of FS
FS can be used to discriminate healthy from diseased biological tissue, with healthy and diseased tissues
possessing different endogenous fluorescent properties, or when fluorescent contrast agents, which are
designed to stain diseased tissues, are used. There have been many examples of the use of fluorescent
spectroscopy to discriminate between healthy and diseased tissues ex vivo published since the earliest report
in the 1940s [98]. There have also been many examples of fluorescent point-based spectroscopy for
diagnostic discrimination of healthy and diseased tissues in many parts of the anatomy, both in
10Prog. Biomed. Eng. 2 (2020) 042001 J A Kim et al
Figure 3. Examples of EOSS probes. I. ESS probe. (A) A photograph of standard biopsy forceps and forceps with an integrated
dual-fiber probe for ESS. (B) Use of ESS integrated forceps for polyp assessment. (C) Representative ESS spectra for neoplastic
polyps (solid line) and non-neoplastic polyps (dashed line). Reprinted from [93], Copyright (2014), with permission from
Elsevier. II. LEBS probe. (A) A schematic of 3.4 mm diameter fiber-optic LEBS probe. (B) A photograph of the LEBS probe
inserted into the accessory channel of an upper endoscope. (C) Portable cart used to house the data acquisition instrumentation
and software for the LEBS probe. (D) Optical properties between control (C) and pancreatic adenocarcinomas (PC) extracted
from the measurement results. Copyright © 2015 Wolters Kluwer Health, Inc. All rights reserved. III. Photographs of the spatial
gating LSS probe inserted in the FNA needle and details of probe end, assembly, and probe latching mechanism (left). In vivo
measurement during the endoscopic ultrasound-guided fine-needle aspiration (EUS-FNA) procedure and typical spectra
collected in the cyst at 120 µm (blue) and 240 µm (green), and the backscattering component extracted from the spectra (red)
(right). Copyright © 2017, Springer Nature.
developmental animal models and in human medical trials, including the alimentary tract [44, 99–130],
heart or major arteries [131–141], bladder [142–149], brain [45–48, 143, 150–175], breast [176], cervix
[177–194], endocrine system [195–201], head and neck [9, 202–213], kidneys [214–216], liver [217–224],
lungs [143, 225–228], mesothelium [229], and the prostate [230].
One example of a fluorescence spectroscopy system in TRL Group C, which was used in a human medical
trial, was the work of Neumann et al in which they assessed whether a commercial laser-induced fluorescence
spectroscopic biopsy system could meet the performance thresholds, set by the ASGE, for accurate real-time
assessment of histology of colorectal polyps [120, 124]. Real-time assessment of the histology of diminutive
colorectal polyps would enable a reduction in the risks to patients, medical time and costs associated with
polyp resection [231]. The commercial system used by Neumann et al was the WavSTAT4 system. The
excitation wavelength was 337 nm. A total of 27 patients underwent screening colonoscopy and the histology
11Prog. Biomed. Eng. 2 (2020) 042001 J A Kim et al
Figure 4. The PG sensor probe developed and tested by Kim et al used for discrimination of the parathyroid glands from the
thyroid during thyroidectomy procedures. The function generator operating at 500 Hz and connected to the light source and
detector enabled the phase-sensitive process. [201] John Wiley & Sons © 2019 WILEY-VCH Verlag GmbH & Co. KGaA,
Weinheim.
of diminutive colorectal polyps (137 total) were determined in vivo and in real time using the light-induced
fluorescence spectroscopy system. Diminutive polyps were determined to be ‘not suspect’ (benign) or
‘suspect’ (cancerous) using the proprietary algorithm in the software and these findings were compared to
the results of the histopathological examination of the biopsied samples. Due to the small sample size in the
study, with only 22 of the 137 polyps being adenomatous, the negative predictive value (NPV) may be
deceptively high and further studies would be needed. In addition, the positive predictive value (PPV) was
only 33% so this technique would not necessarily proclude histology. However, it was determined that the
accuracy for predicting the length of time before another surveillance was needed (known as a surveillance
interval) was nearly met, or even exceeded in some cases, the ASGE recommended thresholds.
Kim et al published a preliminary report on the use of a phase-sensitive NIR autofluorescence detector,
dubbed the ‘PG sensor’ (TRL Group B), during thyroidectomy surgery [201]. The PG sensor probe set-up is
shown in figure 4. The in vivo preliminary trial was operated in a non-contact manner, due to ethical
permission constraints, but nonetheless enabled the surgeon to identify the parathyroid glands from the
thyroid. The probe system managed to detect the weak autofluorescence from the parathyroid glands
(λem = 822 nm) when exposed to the excitation light (λex = 785 nm) and in the presence of bright
fluorescent room lights, the surgeon’s headlight and other surgical lights. This was achieved through use of a
function generator, which modulated the excitation light power frequency output at 500 Hz, and which was
also connected to the lock-in amplifier that was attached to the photomultiplier detector. This ensured that
only light with the power frequency of 500 Hz was detected and other light with different power frequencies
was removed. Subsequently, the lock-in amplifier produced a DC voltage output which was proportional to
the intensity of autofluorescence light received, and this was coupled to a speaker. When a higher
autofluorescence signal was detected, a fast tempo sound was generated, compared to a slow regular interval
sound when no autofluorescence signal was detected. Therefore, based on the output sound, the surgeon
could discriminate the parathyroid gland/s from the thyroid when sweeping the probe over the surgical field.
This probe thus enabled the surgeon to be able to immediately determine the position of the parathyroid
glands without having to pause the operation to use conventional fluorescence imaging techniques to
visualize the parathyroid glands whilst in the dark. Furthermore, the authors of the study proposed in future
work that a co-axial version of this probe with the same optical axis of illumination and detection used in
contact mode could be suitable for MIS using telescopic or robotic endoscopy. It should be noted that a
similar and competing technology for parathyroid gland detection by autofluorescence point spectroscopy,
the PTeye, has also been designed and tested in larger scale initial clinical trials by the group of
Mahadevan-Jansen [195, 197, 199].
Since the earliest human in vivo examples, the fluorescence spectroscopy technique has continued to be
developed and one of the latest iterations of the technique is simultaneous time- and wavelength-resolved
fluorescence spectroscopy (STWRFS). The STWRFS system was reported by Marcu et al and it allows for the
recording of several fluorescence response pulses at selected wavelengths over a period of less than 200 ns
using just a single detector and excitation source [232]. The STWRFS system enables dynamic acquisition of
fluorescence lifetime data over several spectral bands, whilst moving the probe across biological tissue [140].
12You can also read