OPTIMIZE THE FLEXURAL STRENGTH OF CONCRETE
←
→
Page content transcription
If your browser does not render page correctly, please read the page content below
3C Tecnología. Glosas de innovación aplicadas a la pyme. ISSN: 2254 – 4143                Ed. 35 Vol. 9 N.º 3 Septiembre - Diciembre

     MIX DESIGN WITH RESPONSE SURFACE METHODOLOGY TO
     OPTIMIZE THE FLEXURAL STRENGTH OF CONCRETE
                                                                                                Freddy Lizardo Kaseng Solis
                                                                             National University Federico Villarreal, Lima, (Perú).
                                                    E-mail: fkaseng@unfv.edu.pe ORCID: https://orcid.org/0000-0002-2878-9053

                                                                                             Luis Jimmy Clemente Condori
                                                                            National University Federico Villarreal, Lima, (Perú).
                                                   E-mail: kelvin0296@yahoo.es ORCID: https://orcid.org/0000-0002-0250-4363

                                                                                                Ciro Rodriguez Rodriguez
                                                                       National University Mayor de San Marcos, Lima, (Perú).
                                           E-mail: crodriguezro@unmsm.edu.pe ORCID: https://orcid.org/0000-0003-2112-1349

                                                         Recepción: 14/05/2020 Aceptación: 08/07/2020 Publicación: 14/09/2020

        Citación sugerida:
        Kaseng, F.L., Clemente, L.J., y Rodriguez, C. (2020). Mix design with response surface methodology to optimize
        the flexural strength of concrete. 3C Tecnología. Glosas de innovación aplicadas a la pyme, 9(3), 47-57. https://doi.
        org/10.17993/3ctecno/2020.v9n3e35.47-57

47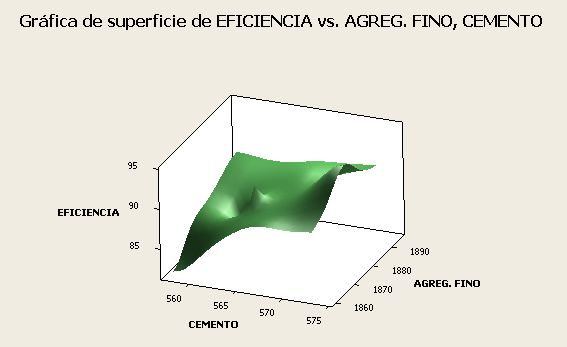
3C Tecnología. Glosas de innovación aplicadas a la pyme. ISSN: 2254 – 4143 Ed. 35 Vol. 9 N.º 3 Septiembre - Diciembre
ABSTRACT
This paper presents a technical proposal for the application of experimental designs in the construction
processes of civil works, specifically in the manufacture of concrete for rigid pavements. Currently is
still does not apply these technological advances, or any application of research methods that allows
optimizing processes to more satisfactory levels, despite the advantages and benefits they provide in
terms of achieving unexpected performance and significant savings of component materials. The
experimental design model is a classic statistical model whose objective is to determine if the independent
factors influence in a variable of interest in this case the modulus of breakage of the concrete or in
another important factor, during the bending test. The answer surface methodology is based on the
experimentation in three stages, the results achieved allow locating an optimal area where the adjusted
values lead
to reduced consumption of them and expanding the strength of the concrete.
KEYWORDS
Concrete, Experimental method, Optimization, Resistance, Flexural strength, Rigid pavements.
48 https://doi.org/10.17993/3ctecno/2020.v9n3e35.47-573C Tecnología. Glosas de innovación aplicadas a la pyme. ISSN: 2254 – 4143 Ed. 35 Vol. 9 N.º 3 Septiembre - Diciembre
1. INTRODUCTION
The rigid pavements made based on concrete, present in their vast majority the presence of structural
and superficial fissures, these have become a problem regarding its functionality and the useful life in
terms of the level of service to the vehicles that circulate in these routes.
The reasons are many; among the most relevant we can name the mix design for concrete, the method
of making the “cloths”, the materials used, the quantity or proportion of the components, etc., the latter
is constitutes the objective of the investigation. It is observed that the method used at the present time are
the conventional ones that do not allow the necessary adjustments to be made to the materials and their
performance in order to achieve optimum levels in terms of dosage and as a product, greater resistance
to bending called the Break Module (MR).
The manufacturing method is frequently that of the American Concrete Institute (ACI), as the dosage
is very rigid and closed, it does not allow modifications to be made to the components, such as cement,
aggregate, water, additives, etc. For this, it is necessary to resort to other methods that give the possibility
of manipulating these independent variables and with the hypothesis of reaching optimum levels of the
mechanical properties of the concrete. For this it is necessary to use the experimental designs (widely used
in other areas of engineering) that, based on a practical methodology and the use of logical reasoning,
it is possible to adjust both the quantity of materials and the resistance to flexion even more optimal, is
possible use algortihms for calculations as Sánchez et al. (2020) and Soto et al. (2020).
Deterministic simulation models have the characteristic of being a technique for solving practical
problems (Levy et al., 2020), such as an overall change of variables over time. Experimental models
are an approximation to the real system. From the above, there is a need to repeat multiple simulation
runs, consequently, its use in an investigation should be planned as a series of experiments that lead to
significant interpretations of the relationships of interest (Huapaya, Rodriguez & Esenarro, 2020).
49 https://doi.org/10.17993/3ctecno/2020.v9n3e35.47-573C Tecnología. Glosas de innovación aplicadas a la pyme. ISSN: 2254 – 4143 Ed. 35 Vol. 9 N.º 3 Septiembre - Diciembre
The response surface methodology (MSR) was used in this investigation. This modeling methodology
is a holistic approach that allows us to postulate the form of the objective function, update and limit the
values of
the parameters, as well as explore and approach the region close to the optimal estimate.
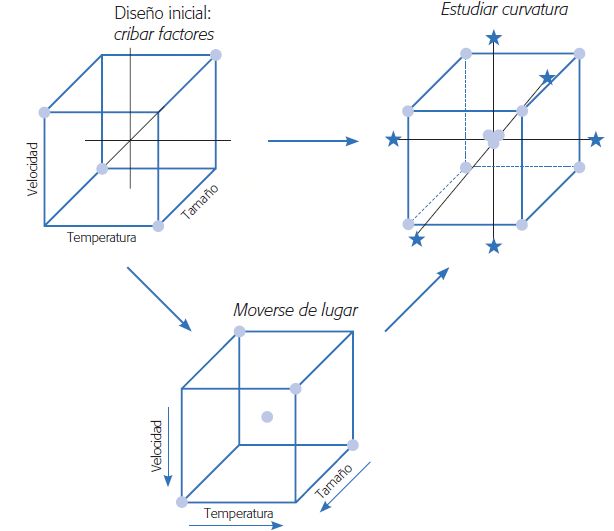
2. METHOD
The Response Surface Methodology (MSR) is the tool used to achieve the proposed objectives, for which
reason it was necessary to experiment sequentially in the stages it comprises until the desired level of
improvement is found. In this case, after a first experimental stage (selection of influential variables) it
was necessary to move the experimental region (move from place) in a suitable direction, or to explore
the initial experimental region in more detail (see Figure 1). The way to do both is part of the so-called
Response Surface Methodology (MSR).
Figure 1. Basic actions of the MSR. Source: (Gutiérrez-Pulido & De la Vara, 2008).
50 https://doi.org/10.17993/3ctecno/2020.v9n3e35.47-573C Tecnología. Glosas de innovación aplicadas a la pyme. ISSN: 2254 – 4143 Ed. 35 Vol. 9 N.º 3 Septiembre - Diciembre
2.1. SIEVING OR CLASSIFICATION
In this first optimization stage, we identify the controllable variables that can significantly influence the
process responses (fine aggregate, cement) and “eliminate” those that were not significant for a good
economic orientation of the process, because it reduces the number of variables and Experimental tests
in the later stages of optimization (Figure 2). When controllable variables range from low to high, they
affect expected responses. For our case, we use the first-order factorial design.
Figure 2. The sequence of the MSR. Source: (Montgomery & Runger, 1996).
2.2. ESCALATION
Having located the optimal region, and observing that it is still far from the initial experiments (sieving),
then was initiated the second stage called “scaling”, which consisted of successively climbing towards
the optimal region until reaching it (Figure 3), to achieve for this objective, we use the indirect method
of ascending slopes in two periods. The method of the steepest ascent is the one that allowed us to go to
the zone of the maximum increase of the response, according to formula (1).
51 https://doi.org/10.17993/3ctecno/2020.v9n3e35.47-573C Tecnología. Glosas de innovación aplicadas a la pyme. ISSN: 2254 – 4143 Ed. 35 Vol. 9 N.º 3 Septiembre - Diciembre
(1)
Figure 3. The sequence of the MSR. Source: (Montgomery & Runger, 1996).
2.3. FINAL OPTIMIZATION
When locating ourselves in the previous stages of the experimental region that contains the optimum, in
this region, the second-order effects were more significant in absolute value than the first-order effects;
this region is appropriately described by second-order mathematical models as shown in equation (2).
In this case, we use the hexagonal design of Figure 4. After closing the optimal region, in this stage, the
second-order effects are more significant, for which we use the formula.
Y=b0+Σbi xi+Σbii xi2+Σ Σ bij xi xj+ε (2)
i=1 i=1 i=1 j=2
j
Response variable Random error
Unknown parameters
52 https://doi.org/10.17993/3ctecno/2020.v9n3e35.47-573C Tecnología. Glosas de innovación aplicadas a la pyme. ISSN: 2254 – 4143 Ed. 35 Vol. 9 N.º 3 Septiembre - Diciembre
Figure 4. Hexagonal design structure with coded values.
3. RESULTS
The beam bending tests carried out at 4, 14, 21, and 28 days provide us with information on the modulus
of rupture. It is observed that the mean (41.37) of the module of the ten designs with variable factors
concerning the mean of the standard design (36.40) differs in 4.97, the design that grants the highest
resistance is the second (44.82) at 28 days of maturation. And for the pattern design, it has a difference
of 8.42.
Table 1. Details of the control.
Beams 30x30x50 Patron
Date Empty 06/01/18 06/01/18 06/01/18 07/01/18 07/01/18 07/01/18 07/01/17 08/01/18 08/01/18 08/01/18 07/01/18 Mean
Breakdate Date 03/02/2018 03/02/2018 03/02/2018 04/02/2018 04/02/2018 04/02/2018 04/02/2017 05/02/2018 05/02/2018 05/02/2018 04/02/2018
READING (Kn / Cm²) 33.73 35.21 32.62 31.07 31.85 35.1 30.59 35.09 30.4 32.05 28.59 32.39
READING P (Kg / Cm²) 3439.45 3590.36 3326.26 3168.21 3247.74 3579.15 3119.26 3578.13 3099.89 3268.14 2915.32 3302.90
FREE LIGHT L (Cm) 45 45 45 45 45 45 45 45 45 45 45 45
AVERAGE WIDTH B (Cm) 15.30 15.40 15.20 15.40 15.50 15.40 15.30 15.50 15.40 15.30 15.60 15.39
AVERAGE HEIGHT D (Cm) 15.50 15.30 15.30 15.50 15.30 15.40 15.20 15.40 15.60 15.30 15.20 15.36
Edge Distance 29 27 17.5 24.8 26.7 24.9 17.7 20.1 29.4 25.5 28 24.6
Distance In middle Third 11.5 9.5 0 7.3 9.2 7.4 0.2 2.6 11.9 8 10.5 7.1
BREAKDOWN M(Kg / Cm²) 42.11 44.82 42.07 38.53 40.28 44.10 39.71 43.80 37.22 41.06 36.40 41.37
Source: authors’ own elaboration.
53 https://doi.org/10.17993/3ctecno/2020.v9n3e35.47-573C Tecnología. Glosas de innovación aplicadas a la pyme. ISSN: 2254 – 4143 Ed. 35 Vol. 9 N.º 3 Septiembre - Diciembre
The optimal conditions of the controllable, independent variables are Cement = 617.95 kg / m³ and the
fine aggregate = 1816.44 kg / m³, replacing these values obtained in the coded mathematical model, the
maximum strength of the concrete is obtained, which would reach 93%. By using the MINITAB version
16 software, we elaborated on the optimization graphs for the flexural resistance of rigid pavement
concrete.
Figure 4. Optimized area for the controlled factors of strength to compressive. Source: authors’ own elaboration.
A curve system is observed in the graph, and due to the color distribution, the maximum efficiency is
achieved with the maximum level of cement and with a standard level of fine aggregate (dark green
color).
Figure 5. The efficiency of the optimization process regarding fine aggregate and cement. Source: authors’ own elaboration.
54 https://doi.org/10.17993/3ctecno/2020.v9n3e35.47-573C Tecnología. Glosas de innovación aplicadas a la pyme. ISSN: 2254 – 4143 Ed. 35 Vol. 9 N.º 3 Septiembre - Diciembre
In the quadratic effect spatial graph, the contour system is notorious, for the levels generated the
maximum efficiency of the concrete resistance is achieved with the maximum levels of cement and the
standard level of fine aggregate.
4. CONCLUSIONS
The ranges considered concerning direct tensile strength with compressive strength for concretes made
with aggregates from the Mantaro river and Portland cement type I were considered between 201 kg /
cm² and 420 kg / cm² and are the ranges of the experiment that they allowed to expand the surface of
optimal levels, in terms of the volumes of the materials. Besides, the extension of the working ranges can
reduce the consumption of materials, achieving the same resistance that was initially reached.
The Response Surface Methodology is an extremely versatile technique that allows the use of different
experimental designs and statistical tools to solve system optimization problems and can be applied to the
optimization of a single response or the simultaneous optimization of several responses.
REFERENCES
Córdova, I. (2012). Proyecto de Investigación Cuantitativa. Editorial San Marcos, p. 77.
Gutiérrez-Pulido, H., & De la Vara, R. (2008). Análisis y Diseño de Experimentos (2ª ed.). McGraw-Hill.
Huapaya, H. D., Rodriguez, C., & Esenarro, D. (2020). Comparative analysis of supervised
machine learning algorithms for heart disease detection. 3C Tecnología. Glosas de innovación
aplicadas a la pyme. Edición Especial, Abril 2020, 233-247. http://doi.org/10.17993/3ctecno.2020.
specialissue5.233-247
55 https://doi.org/10.17993/3ctecno/2020.v9n3e35.47-573C Tecnología. Glosas de innovación aplicadas a la pyme. ISSN: 2254 – 4143 Ed. 35 Vol. 9 N.º 3 Septiembre - Diciembre
Levy, J., Pandey, B., Chowdhry, B., & Rodriguez, C. (2020). Prologue: Recent trends in computer
science and engineering (RTCSE). 3C Tecnología. Glosas de innovación aplicadas a la pyme. Edición
Especial, Abril 2020, 19-25. http://doi.org/10.17993/3ctecno.2020.specialissue5.19-25
Montgomery, D. C., & Runger, G. C. (1996). Probabilidad y estadística aplicadas a la ingeniería. McGraw-
Hill.
Rosental, M. M., & Iudin, P. F. (2008). Diccionario Filosófico. Editora Política. http://www.filosofia.org/
urss/dfi1965.htm
Sabino, C. (1986). El proceso de investigación. Editorial Panapo, p. 53. http://paginas.ufm.edu/sabino/
ingles/book/proceso_investigacion.pdf
Sánchez, J., Vega, H., Guzmán, Y., Rodriguez, C., & Quinto, D. (2020). Data mart design to
improve the decision-making process of the after-sales service. Test Engineering and Management, 83,
15481–15494. http://www.testmagzine.biz/index.php/testmagzine/article/view/6539
Soto, B., Vega, H., Guzmán, Y., Rodriguez, C., & Quinto, D. (2020). Classification algorithm
based on machine learning to optimize athletes talent detection. Test Engineering and Management,
83, 13464–13471. https://testmagzine.biz/index.php/testmagzine/article/view/6067
Torre, C. (2004). Tecnología del concreto para ingenieros civiles. LEM-UNI, p. 74.
56 https://doi.org/10.17993/3ctecno/2020.v9n3e35.47-573C Tecnología. Glosas de innovación aplicadas a la pyme. ISSN: 2254 – 4143 Ed. 35 Vol. 9 N.º 3 Septiembre - Diciembre 57 https://doi.org/10.17993/3ctecno/2020.v9n3e35.47-57
You can also read