Role of weather on the elevated air pollution in Kathmandu Valley on 4th and 5th January
←
→
Page content transcription
If your browser does not render page correctly, please read the page content below
Role of weather on the elevated air pollution in Kathmandu Valley on 4th and 5th January
Authors: Dr. Jagadishwor Karmacharya, Ms. Shanti Kandel, Mr. Sunny Maharjan, Mr. Kamal D Acharya
and Mr. Bikash Nepal, Department of Hydrology and Meteorology

Department of Hydrology and Meteorology

For correspondence: j_karmacharya@yahoo.com

(A slightly revised version of this article has been published in the Nepali Times on February 6, 2021,
which can be viewed at https://www.nepalitimes.com/banner/how‐weather‐elevates‐air‐pollution‐in‐
kathmandu)

We all know that ensuing Air pollution over an area is determined by emission of pollutants and their
transport. Source of pollution can be both local and remote whereas transport of pollution into and out
of the area is governed by its fixed geographical settings and the prevailing atmospheric condition. The
role of geography and seasonal climatic variation in altering air pollution levels in Nepal is generally well
understood. But, understanding the role of weather events in air pollution fluctuation is of key importance
in predicting the pollution level across the country over the next few days. Prediction of pollution levels
few days in advance has practical as well as policy implications. For example, if pollution level can be
predicted a few days in advance, people can plan their activities accordingly and the government can also
introduce temporary restrictions to reduce the severity of pollution during adverse weather conditions.
In this connection, this article looks into a recent episode of high air pollution level in the Kathmandu
Valley and the associated weather conditions.

Hazardous level of air pollution, as measured by Air Quality Index ‐ PM 2.5 (AQI_PM2.5), was recorded at
various air quality monitoring stations in the Kathmandu Valley on 4th and 5th January 2021, while the
pollution level was stable or slightly below the daily average values measured in the preceding days for
stations outside the valley (Figure 1). Serious concerns were raised by all sectors with the sudden rise of
pollution to hazardous levels in the valley. For example, the Department of Environment (DoE) issued a
press release on 5th January urging people to remain indoor as far as possible and refrain from burning
open fires. It was also advised that the high level of pollution could prevail for some time as “air pollution
also depends on weather”. Going by the news coverage, many experts seemingly had similar opinions
citing the bowl shape of the valley and winter season as the major factors. However, the air pollution level
again decreased to pre‐episode level from 6th January onwards, which motivated us to carry out this
analysis.

We analyzed the daily and hourly time series of air pollution level (AQI_PM2.5 and concentration of few
other gases) recorded by some air quality monitoring stations established by DoE and a newly established
station by Department of Hydrology and Meteorology (DHM) at Nagarkot as well as few surface
meteorological variables from the DHM’s recently established meteorological stations in the valley under
PPCR/BRCH project. In addition, we also analyzed the vertical atmospheric profile measured by DHM’s
radiosonde station at Kirtipur, satellite imagery and surface weather charts of the period.

Air quality data analysis

Comparison of time series of high frequency PM2.5 counts shows that high values were recorded in the
stations within the Kathmandu Valley (Bhaisepati, Bhaktapur, Ratnapark) from the afternoon of 4th

                                                                                                  Page 1 of 6
January till the morning of 6th January, whereas such counts were comparable to those recorded before
and after the episode in respective stations outside the values (Nepalgunj, Dang, Pokhara, Hetauda)
except Nagarkot station.
Comparison of AQI_PM2.5 daily average time series shows that their values on 4th and 5th January is
comparable with the values on preceding days for respective stations outside the valley (Nepalgunj, Dang,
Pokhara, Hetauda), whereas it dropped by 30% or more on 6th and 7th for Nepalgunj, Dang, and Pokhara
stations. However, the stations at Ratnapark and Bhaisepati recorded 50% rise on the 4th and 5th, whereas
Bhaktapur station recorded only 15% rise from the preceding day values. In contrast, Nagarkot station
recorded a fall of about 40% or more from 4th to 7th January. Similarly, concentration of Ozone, Nitrogen
oxide, Carbon monoxide and Black Carbon‐8 was also reduced by about 10% or more in Nagarkot during
the period compared to preceding days, which is consistent with the reduction of AQI_PM2.5 there. It is
worth noting that Nagarkot and surrounding regions on the eastern side of the valley is considered as the
primary outflow region for wind blowing over the Kathmandu valley (as westerly is the predominant upper
level wind over Nepal). For this reason, DHM has selected this site for establishing an air quality
monitoring station recently as its main interest is to monitor ambient air quality. Hence, the contrasting
signal in the daily average AQI_PM2.5 count for the stations in the valley and that at Nagarkot is of
particular interest and, as this episode shows, this station could be valuable in enhancing our
understanding on the temporal variation of air quality in the valley and the transport of pollutants in there.
Analysis of vertical atmospheric profile and other meteorological variables
DHM has recently established a Radiosonde station at the premises of Tribhuvan university, Kirtipur and
radiosonde is being released regularly at 5:45 am in the morning from March 2019. The radiosonde
attached to a big balloon filled Hydrogen gas measures the key atmospheric variable (temperature,
relative humidity, wind speed and direction) at different geopotential heights and transmits the data to a
ground station. Globally there are hundreds of such stations that make such measurements once or twice
a day synchronously providing valuable insight of the global weather pattern at different altitudes.
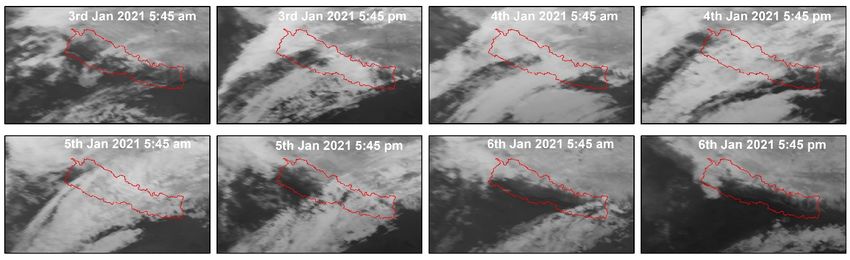
Comparison of the Kirtipur radiosonde data on 1st and 5th January shows that while ground level inversion
was present on both days (ground level inversion occurs almost every day during winter, because of
nocturnal cooling of the surface and the bottom layer of the atmosphere resulting in increase of
temperature with height up to a certainblevel) but the depth of inversion is quite shallow on the 5th (250
m on the 5th but 600 m on the 1st), whereas the vertical temperature gradient (increase in temperature
with height) was much stronger (2.5˚C per 100 m on the 5th, but 1.5˚C per 100 m on the 1st) (Figure 2). On
the early morning of the 5th, the top of ground inversion was at 845.9 hPa (1569 gpm) whereas it was
further higher at 811.9 hPa (1894 gpm) on the 1st. Also, on the 5th, stable condition prevailed up to 800
hPa from the surface, with conditional instability aloft. It is well known that stronger the inversion, and
deeper/stronger the stable layer, the harder it is for a parcel of air to uplift as the lifting parcel will be
relatively more cold, hence denser, than its surrounding. Consequently, it will face stronger downward
force, so the parcel will sink back. Hence, pollutant suspended in the bottom layer of the atmosphere is
pretty much confined within the inversion layer. Now, shallower the depth of inversion, higher will be the
concentration of the air pollutants even with the same amount of emission load as they are confined in a
smaller volume near the ground.
On most days in the winter, ground level inversion is gradually established in the Kathmandu Valley from
the evening and intensifies in the night, but it is gradually weakened by the incoming solar insolation after
Page 2 of 6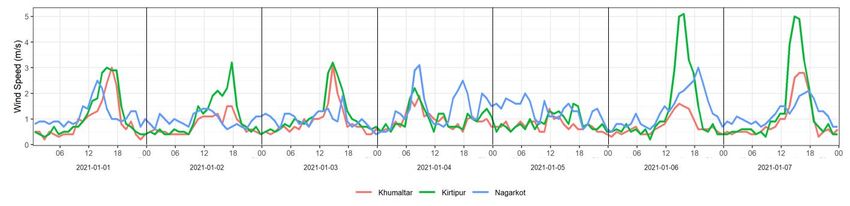
sunrise and disintegrates before noon. Once the inversion decays, mixing of the bottom layer of air into
the higher levels of atmosphere intensifies leading to lowering of air pollution level at the surface. In
addition, prevailing stronger wind at higher levels also transports a sizable amount of air pollution outside
the valley resulting in reduction of concentration of air pollutants in the valley. However, from the
afternoon of 3rd January till the morning of 6th January, Nepal was under the influence of the western
disturbance and the most parts of the country was covered by high clouds (Figure 3) with light scattered
rainfall mainly in the western parts of Nepal. But, the cloudy condition prohibited most of the solar
insolation from reaching the lower atmospheric levels over most parts of Nepal including Kathmandu
Valley. On the 4th and 5th, Automatic Weather Stations (AWS) at Kirtipur and Khumaltar recorded only
about 25% and 30% solar insolation respectively compared to insolation on the preceding days, while the
peak solar irradiation was roughly about 125 and 175 Watt/m2 on those days compared to peak irradiation
of about 500 Watt/m2 on the preceding days. Similarly, AWS at Nagarkot recorded only about 30% and
45% solar insolation on the 4th and 5th respectively compared to insolation on the preceding days, while
the peak irradiation was only about 200 and 325 Watt/m2 on those days compared to irradiation of about
660 Watt/m2 on the preceding days (Figure 4). So, it can be inferred that the surface inversion did not
fully disintegrate on those days though it would have been weakened and lifted slightly higher in the
afternoon. This is also supported by the relatively calm wind recorded in the afternoons of 4th and 5th at
Kirtipur and Khumaltar stations (Figure 5) and the favorable conditions for subsidence of air over the
Central Himalayan region and adjoining areas seen in the surface weather charts of those days.

Further, as described above, daily average AQI_PM2.5 values in the stations outside the Kathmandu valley
remained more or less stable from last week of December to 5 January, so it can be inferred that the
higher level of AQI_PM2.5 in the Kathmandu Valley on 4‐5 January is mostly contributed by the local
sources. Moreover, the relatively lower level of AQI_PM2.5 at Nargarkot station on 4‐5 January, is likely
due to confinement of pollutants within the valley with limited transport outside the valley.

With the passage of western disturbance, the valley sky became clear from the early morning of 6th
January enabling the solar insolation to reach the valley bottom after sunrise. As a result, surface inversion
dissipated enabling mixing of the bottom layer of air with the higher levels and subsequent dissipation of
pollutants from the valley floor much sooner than anticipated.

Conclusion

From the above analysis, we conclude that short term changes in the weather conditions can lead to a
significant variation in the level of air pollution in the Kathmandu Valley, especially during the winter
season. It is interesting to note that adverse weather conditions alone can significantly enhance the
pollution level in the valley even when the socio‐economic activities remain subdued after the onset of
COVID‐19 pandemic in the last spring both domestically as well as regionally/globally.

Hence, this is high time that collaboration among the government agencies engaged in air pollution
monitoring and weather monitoring and forecasting, and even academia is enhanced. Moreover, there is
a need to further strengthen the concerned agencies and build their capacities so that the citizens are
well informed not only about the prevailing pollution level but also advised on the likely scenario over the
next few days in advance. In fact, such endeavour will provide yet another avenue for getting valuable
return on the recent investments made by the government in establishing and maintaining online air
quality monitoring and meteorological stations.

                                                                                                  Page 3 of 6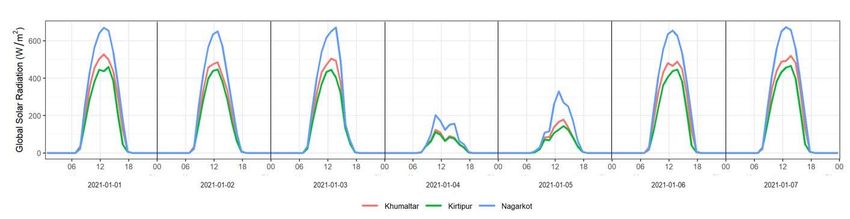
Acknowledgement

We thank the Department of Environment and Department of Hydrology and Meteorology for providing
the air quality and meteorological data used in this study. We acknowledge the JMA Meteorological
Satellite Center and the NOAA/NESDIS/STAR GOES‐R Algorithm Working Group imagery team for the
collaboration and their permission to use the software.

Note

A technical report of analysis used in this article will also be uploaded on the DHM website soon.

© Authors retain the copyright of this article.

Figure 1: Daily average AQI_PM2.5 at Dang, Pokhara, Bhaisepati and Nagarkot stations.

                                                                                               Page 4 of 6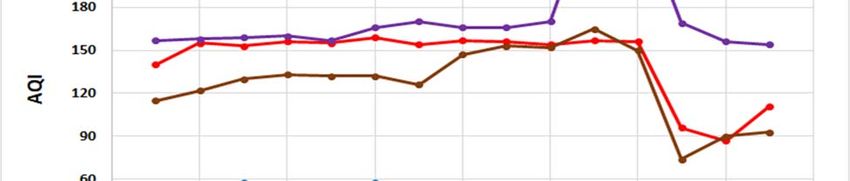
Figure 2: Altitudinal variation of temperature, dew point temperature and wind (Skew‐T diagram) on a) 1st and b) 5th January measured by the
radiosonde released from DHM’s Radiosonde station at Kirtipur.

Figure 3: Infrared Satellite imagery received from Himawari‐8
(Image source: https://www.data.jma.go.jp/mscweb/data/himawari/sat_img.php?area=se4)

                                                                                                                                 Page 5 of 6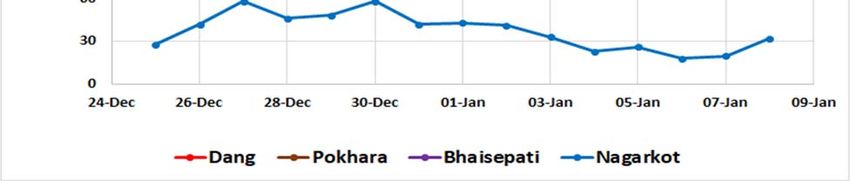
Figure 4: Hourly average global solar radiation recorded in DHM’s Khumltar, Kirtipur and Nagarkot stations.

Figure 5: Hourly average wind speed recorded in the three stations.

                                                                                                              Page 6 of 6
You can also read