Options for a strategic approach to pharmaceuticals in the environment Task 1 Report Revised version
←
→
Page content transcription
If your browser does not render page correctly, please read the page content below
Options for a strategic approach
   to pharmaceuticals in the
   environment

Task 1 Report
Revised version

September 2016
Since 26 June 2013 the legal entity BIO Intelligence Service is a 100% owned subsidiary
      of Société Fiduciaire Internationale d’Audit which is owned by Deloitte.

    Document information
    CLIENT                       European Commission – DG ENV

    REPORT TITLE                 Task 1 report – Revised version

    PROJECT NAME                 Options for      a strategic     approach to pharmaceuticals   in the
                                 environment

    DATE                         September 2016

    PROJECT TEAM                 Deloitte, INERIS, Klaus Kümmerer, LSE, Milieu Ltd

    AUTHORS                      Ms Sarah Lockwood, Deloitte
                                 Ms Nada Saïdi, Deloitte
                                 Ms Valerie Ann Morgan, Deloitte

    REVIEWERS                    Ms Katherine Salès, Deloitte
                                 Ms Florence Didier-Noaro, Deloitte
                                 Mr Sébastien Soleille, Deloitte
                                 Mr Klaus Kümmerer
                                 Mr Tony Zamparutti, Milieu Ltd.
                                 Ms Yoline Kuipers, Milieu Ltd.
                                 Ms Sandrine Andres, INERIS

    DISCLAIMER                   The information and views set out in this report are those of the
                                 author(s) and do not necessarily reflect the official opinion of the
                                 Commission. The Commission does not guarantee the accuracy of the
                                 data included in this study. Neither the Commission nor any person
                                 acting on the Commission’s behalf may be held responsible for the
                                 use which may be made of the information contained therein.

2   Options for a strategic approach to pharmaceuticals in the environment – Task 1 Report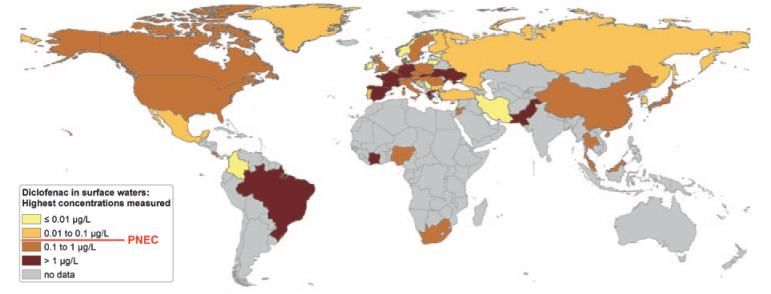
Contents
1. INTRODUCTION ________________________________________________________ 7
1.1. Background to the study _________________________________________________ 7
1.2. Objectives of the study and of this report ___________________________________ 8
1.3. Objectives of this report _________________________________________________ 8
2. SETTING THE SCENE: THE PRODUCTION AND CONSUMPTION OF PHARMACEUTICALS IN
THE EU ___________________________________________________________ 11
2.1. The EU pharmaceutical industry in figures _________________________________ 12
2.2. Trends in marketing authorisations _______________________________________ 13
2.3. Trends in pharmaceuticals consumption __________________________________ 14
3. PHARMACEUTICAL EMISSIONS THROUGHOUT THEIR LIFE CYCLE __________________ 19
3.1. Manufacturing ________________________________________________________ 20
3.2. Consumption _________________________________________________________ 21
3.2.1. Sources of emissions from human consumption ______________________ 21
3.2.2. Sources of emissions from animal consumption ______________________ 22
3.3. Waste management ____________________________________________________ 23
3.3.1. Solid waste _____________________________________________________ 23
3.3.2. Effluents of wastewater treatment ___________________________________ 24
3.3.3. Contamination of soil due to contact with waste _______________________ 25
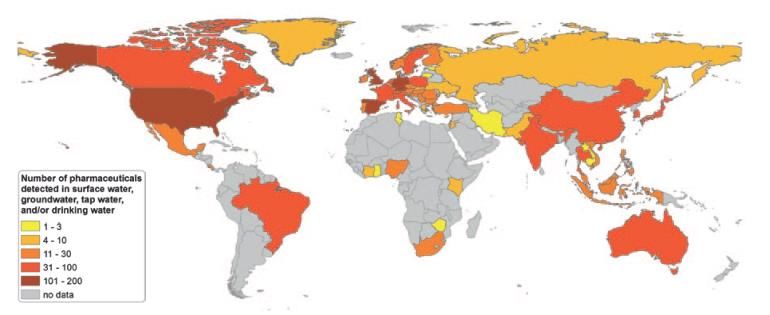
4. OCCURRENCE OF PHARMACEUTICALS IN THE ENVIRONMENT______________________ 28
4.1. Occurrence and concentrations of pharmaceuticals in the environment _________ 29
4.2. Occurrence and concentrations of transformation products___________________ 35
4.3. Factors influencing the types and concentrations of pharmaceuticals in the
environment __________________________________________________________ 36
5. RISK TO ECOSYSTEMS _________________________________________________ 37
5.1. Environmental risk assessments (ERA) ____________________________________ 37
5.2. State of knowledge on environmental concentrations and ecotoxicity used in the
ERA _________________________________________________________________ 39
5.2.1. State of knowledge on environmental concentrations used in the ERA ________ 39
5.2.2. State of knowledge about ecotoxicity data for the ERA ____________________ 41
5.3. Illustration of suspected risks ___________________________________________ 45
5.4. Illustration of observed impacts __________________________________________ 49
5.5. Focus on endocrine disruption, as a growing threat to the biota _______________ 49
6. PHARMACEUTICALS MIGHT POSE HUMAN HEALTH RISKS VIA INDIRECT EXPOSURE ______ 52
6.1. Risks to humans via drinking and other routes of exposure ___________________ 53
6.2. Human exposure to endocrine disruptors compounds (EDC) __________________ 57
6.3. The issue of emergence of anti-microbial resistance (AMR) in the environment
and its health implications ______________________________________________ 57
CONCLUSIONS 65
3 Options for a strategic approach to pharmaceuticals in the environment – Task 1 Report
List of abbreviations
        ABR                 Antibiotic Resistant Bacteria

        AMR                 Anti-Microbial Resistance

        AOP                 Adverse Outcome Pathway

        API                 Active Pharmaceutical Ingredient

        ATC                 Anatomical Therapeutic Chemical (Classification System)

        CHMP                Committee for Medicinal Products for Human use

        CMR                 Carcinogenic, Mutagenic and Reprotoxic

        CVMP                Committee for Medicinal Products for Veterinary use

        DDD                 Defined Daily Dose

        DDE                 Dichlorodiphenyldichloroethylene

        DID                 DDD per 1,000 inhabitants per day

        E2                  17 beta-estradiol

        EE2                 17 alpha-ethinylestradiol

        EEA                 European Economic Area

        EC50                Half maximal Effective Concentration

        ECDC                European Centre for Disease Prevention and Control

        EDC                 Endocrine-disrupting chemical

        EMA                 European Medicines Agency

        EPAR                European Public Assessment Report

        EPR                 Extended Producer Responsibility

        ERA                 Environmental Risk Assessment

        EU                  European Union

        FDA                 United States Food and Drug Administration

        FDW                 Finished Drinking Water

        IED                 Industrial Emissions Directive (2010/75/EU)

        IMI                 Innovative Medicines Initiative

        LC50                Half maximal Lethal Concentration

4   Options for a strategic approach to pharmaceuticals in the environment – Task 1 Report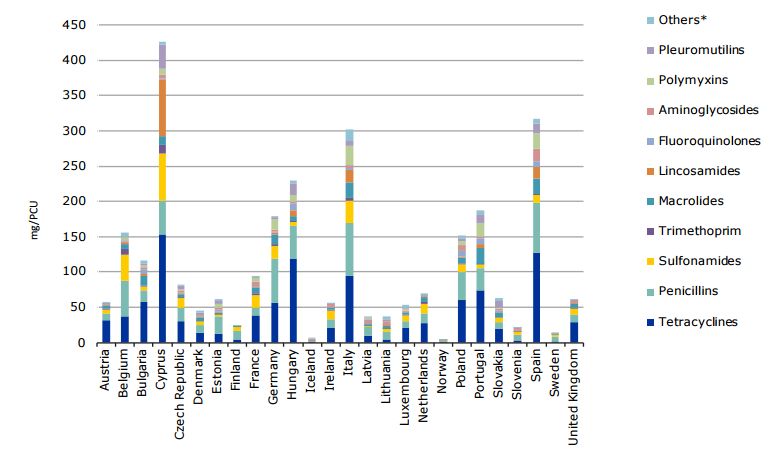
LC/MS               Liquid Chromatography / Mass Spectrometry

        LOAEL               Lowest-observed-adverse-effect level

        MA                  Market Authorisation

        MEC                 Measured Environmental Concentration

        MoA                 Mode of Action

        MUMS                Minor Use Minor Species

        MRL                 Maximum Residue Limit

        MS                  Member State

        NOAEL               No-observed-adverse-effect level

        NSAID               Nonsteroidal Anti-inflammatory Drug

        OTC                 Over The Counter

        PAR                 Public Assessment Report (national)

        PBT                 Persistence, Bioaccumulation and Toxicity

        PCU                 Population Correction Unit

        PEC                 Predicted Environmental Concentration

        PNEC                Predicted No Effect Concentration

        QSAR                Quantitative structure–activity relationship

        R&D                 Research & Development

        REACH               Regulation on the Registration, Evaluation, Authorisation and Restriction of
                            Chemicals (1907/2006)

        RMM                 Risk Mitigation Measure

        UF                  Uncertainty Factor

        VICH                Veterinary International Conference on Harmonization

        WFD                 Water Framework Directive (2000/60/EC)

        WHO                 World Health Organization

        WWE                 Waste Water effluents

        WWI                 Waste Water Influents

        WWTP                Waste Water Treatment Plant

5   Options for a strategic approach to pharmaceuticals in the environment – Task 1 Report
1. Introduction
This introductory chapter presents the background to and the objectives of the study on
Options for a strategic approach to pharmaceuticals in the environment, of which this
report constitutes the first deliverable.
1.1.Background to the study
Health care as practised in the European Union (EU) heavily relies on the consumption of
pharmaceuticals, as reflected by the continuous growth of the European market for
medicines for human and veterinary use. The EU is even considered the second biggest
consumer in the world after the United States of America. While the benefits of a
responsible use of these substances for human health and veterinary care are
recognised, there is, however, increasing concern over the potential adverse effects of
these substances on the environment and on human health via the environment.
It is now widely acknowledged that pharmaceuticals and their residues – including Active
Pharmaceutical Ingredients (API), metabolites and transformation products – are emitted
into the environment at different stages of their life cycle, from their production to their
1
use to their disposal. A large body of literature reports the presence of pharmaceuticals
in environmental compartments (e.g. surface and ground water, soils, biota) in different
parts of the world, including the EU Member States. They are generally detected at low
concentrations (e.g. in the range of sub ng/L to µg/L in the aquatic environment).
The level and frequency of exposure of biota (e.g. plants, animals, bacteria) and humans
to these substances and their residues is a key component of the risk they pose to
human health and the environment, along with their inherent hazard level. Actual
exposure can be particularly complex to determine, because of the multiplicity of sources
of emissions and contamination pathways (diffuse contamination, point source pollution
from sewage networks or landfill leachates) as well as transformation and transfer
processes in different environmental compartments. Another challenge lies in assessing
the potential effects on the environment and human health of chronic exposure to low
doses of mixtures of pharmaceuticals.
In the EU, the issue of pharmaceuticals in the environment is to some extent addressed
in the chemicals (including pharmaceuticals), industrial emissions, water, waste and food
legislation. Most do not include specific provisions for pharmaceuticals, but can be
applicable to the issue.
The present study is part of the effort to develop the EU strategic approach for
2
pharmaceuticals mentioned in Directive 2013/39/EU, which is likely to take the form of a
Commission Communication. This approach must allow coordinating and balancing
efforts across Member States and categories of stakeholders towards:
better knowledge of the issue (e.g. through fostering research and adequate
monitoring and reporting activities);
more sustainable production, consumption and disposal patterns; and
cost-efficient measures to mitigate associated risks.
1
See for instance the review in Pharmaceuticals in the Environment (2015), Editor(s) R E Hester, R M Harrison,
ISBN 978-1-78262-189-8
2
Article 8b of Directive 2013/39/EU of The European Parliament And of The Council of 12 August 2013
amending Directives 2000/60/EC and 2008/105/EC as regards priority substances in the field of water policy
7 Options for a strategic approach to pharmaceuticals in the environment – Task 1 ReportIt must also ensure that the clear and undisputable benefits of the sustainable use of
pharmaceuticals for human and animal life and the competitiveness of EU healthcare
systems are maintained.
In order to achieve these objectives, many possible options have been identified at the
different stages of the life-cycle of pharmaceuticals, notably by the 2014 BIO study (BIO
IS, 2014). The Commission organised a workshop in September 2014 aimed at
prioritising those options according to various stakeholders’ inputs. Those and other
options will be further considered under later tasks in this study.
1.2.Objectives of the study and of this report
The general objective of the study is to assist the Commission with the development of a
strategic approach to pharmaceuticals in the environment, by identifying uncertainties,
helping to fill knowledge gaps and providing details and documentation regarding options
that could address the issue. The options will be given a preliminary assessment with
regard to their feasibility (including political feasibility, i.e. acceptability and support of the
different categories of stakeholders), efficiency, effectiveness and coherence with other
policy developments. This approach is proposed by analogy with the Commission's usual
approach to impact assessment, although it is not intended that the strategic approach
requires impact assessment. The strategic approach is expected to be followed by
proposals for measures, as appropriate, and any legislative proposals would then be
subject to impact assessment.
The specific objectives of the study are threefold:
1. Providing the Commission with an update of:
a. the main issues and uncertainties regarding pharmaceuticals in the
environment relevant to the EU;
b. the options to be considered for further assessment, based on the
outcomes of the 2014 workshop and on further research;
2. Perform a preliminary assessment of all identified options by evaluating their
feasibility, efficiency, effectiveness and coherence with other policy
developments; and
3. Conduct a public consultation on the most promising options, in order to evaluate
the level of support of different stakeholders and to gather their experience and
opinions about them.
1.3.Objectives of this report
This Task 1 deliverable covers the objective 1a.
During the period 2000–2015, the numbers of articles published on the issue of
pharmaceuticals in the environment (in journals and books) had increased yearly —
from a rate of 200 per year to a rate of 1800 per year. Daughton et al. (2016) recently
published a bibliometric analysis of the literature available on Pharmaceuticals in the
environment and we invite the interested reader to explore this document (Daughton et
al., 2016).
The present report does not aim to provide an exhaustive review of the literature. It
rather aims at highlighting main findings regarding the scale of the problem and
remaining uncertainties relevant to the EU, based on a selection of EU or international
publications mostly published since 2013.
Recent findings tend to increase the body of evidence supporting the ubiquity of
pharmaceuticals in the environment, at concentrations which may pose risks to the
environment, and possibly to human health via the environment. However,
uncertainties regarding the scale of the problem remain high, due to the large number
of pharmaceuticals and the challenges of assessing risks linked to multi-compound
exposure at low doses, potentially over long periods of time. The update of options,
8 Options for a strategic approach to pharmaceuticals in the environment – Task 1 Reporttheir rationale and preliminary assessment will be included in Task 2 deliverable. 9 Options for a strategic approach to pharmaceuticals in the environment – Task 1 Report
This report is organised in 7 sections:
             1. Chapter 1 provides the background and the objectives of the study. It also
                specifies the scope of work covered by the present report;
             2. Chapter 2 highlights latest trends and projections with regards to human and
                veterinary consumption of pharmaceuticals (2.3) and provides key figures about
                the pharmaceutical industry (2.1) and marketing authorisations (1.1);
             3. Chapter 3 highlights main pathways of contamination of the environment by
                pharmaceuticals, at the different stages of the life-cycle, from their manufacturing
                (3.1), to their use (3.2), to their disposal (3.3);
             4. Chapter 4 describes the occurrence (4.1) and environmental concentrations (4.2)
                of pharmaceuticals in different environmental compartments, through a selection
                of recent examples;
             5. Chapter 5 highlights how environmental risks are assessed (5.1) and based on
                which information (5.2), which risks are currently suspected (5.3) and which
                impacts are actually observed (1.1). Lastly, it focuses on the risks posed by
                endocrine disruptors, which are of increasing concern in the EU (5.5);
             6. Chapter 6 highlights the latest state of knowledge about the risks and potential
                impacts on human health of environmental exposure to pharmaceuticals and
                their residues, through a selection of recent research findings (6.1). A focus is
                made on the phenomenon of anti-microbial resistance (AMR), which is subject to
                increasing concerns for human and animal health globally (6.3);
             7. The last chapter highlights main conclusions on the knowledge, scale of the
                issue, and research needs with regards to human and veterinary
                pharmaceuticals in the environment.

10   Options for a strategic approach to pharmaceuticals in the environment – Task 1 Report
2. Setting the scene: the
production and consumption
of pharmaceuticals in the EU
In brief
The present chapter highlights latest trends and projections with regards to
human and veterinary consumption of pharmaceuticals and provides key
figures about production and marketing authorisations.
On a global scale, the EU takes the second place for pharmaceuticals sales,
with about 25 % of the world pharmaceutical sales for human consumption vs.
31% for veterinary consumption. The overall market is estimated at €225
billion, with nearly 10% of this value dedicated to research and development of
new products, and creates nearly 900,000 jobs in the EU.
About 3,000 active pharmaceutical substances are currently authorised on the
EU market as a whole, with a wide variability across Member States. The
number of new pharmaceuticals reaching consumers per year has nearly
doubled in the last decade (between 2005 and 2014), both for human and
veterinary products. Stimulated by EU legislation, increasing trends can be
observed in applications for orphan medicines for human consumption as well
as veterinary medicines for minor species and rare diseases in major species.
There is an increasing trend in the consumption of human and veterinary
pharmaceuticals in the EU.
For human pharmaceuticals, this trend has been driven in particular by the use
of antimicrobials (in particular carbapenems and polymixins), although their
overall use has been recently slowing down, as well as by the use of
pharmaceuticals related to ageing and chronic diseases (antihypertensives,
cholesterol lowering drugs, antidiabetics, and antidepressants) which has at
least doubled in the last decade and is expected to increase further. For
veterinary pharmaceuticals, the highest sales today concern parasiticides,
vaccines and antimicrobials. Although animal production has been historically
using an important amount of antibiotics (about 8,000 tonnes of antimicrobial
APIs were used in the EU/EEA countries in 2013), the expert group on
European Surveillance of Veterinary Antimicrobial Consumption (ESVAC)
shows the sales of antibiotics in the EU for use in animals fell by approximately
8% between 2011 and 2013. Whereas trends in antimicrobial consumption are
slowing down in the EU, this is not the case globally as a 67 % increase is
expected on a global scale from 2010 to 2030 in the agricultural sector alone.
The reporting of production, authorisation and consumption data of
pharmaceuticals remain scattered, little harmonised and updated at the EU
level.
This chapter provides an overview of key figures and trends with regards to the sales,
marketing authorisations and consumption of both human and veterinary
pharmaceuticals. Please note, however, that comparisons between both these sectors in
terms of market value, number of products authorised and volumes of consumption must
be considered with care given the different targets, types of pharmaceutical applications
and number of APIs (much larger for human consumption).
11 Options for a strategic approach to pharmaceuticals in the environment – Task 1 Report2.1.The EU pharmaceutical industry in figures
On a global scale, the EU takes the second place for pharmaceutical sales, behind the
United States of America, with 25 % of the world pharmaceutical sales for human
purposes vs. 31% for veterinary purposes (Eurostat, 2013; IFAH_website, 2016).
There is a significant difference in market size (in value) between human and veterinary
pharmaceuticals in the EU: 97% of the value generated relates to pharmaceuticals for
human consumption while 3% relates to veterinary medicines (both food producing and
companion animals) (IFAH, 2015).
The EU market has grown substantially over the last 15 years to reach an estimated €220
billion for human pharmaceuticals (x4,5 since 2010) and €5 billion for veterinary
pharmaceuticals in 2014. About 10% of this value is spent every year on Research &
Development (R&D), both for human and veterinary pharmaceuticals (Eurostat, 2013;
IFAH_website, 2016). The EU has maintained a consistent trade surplus for
pharmaceuticals since before 2003, reaching €55 billion euros in 2013, with the largest
trading partners being the United States of America and Switzerland. One fifth of the
value added generated in the EU-28 pharmaceuticals manufacturing sector in 2013 was
contributed by Germany alone (20%), followed by Ireland and France (13% each), the UK
(11%) and Italy (7%) (Eurostat, 2013).
According to the latest data available on Eurostat, there were approximately 4,200
enterprises in the pharmaceutical manufacturing sector in the EU-28 (including veterinary
products), of which half are concentrated in Germany, the UK, Italy, France, and Spain
alone. Large enterprises dominate the pharmaceutical industry in Europe, employing 78
% of the pharmaceutical manufacturing sector’s workforce, generating 87% of the total
3
value added produced in 2013 (IFAH-Europe, 2016; EFPIA, 2015a; EFPIA, 2015b).
Key figures about the EU pharmaceutical market are summarised in Table 1.
Table 1: Key figures about the EU pharmaceutical market
Human Veterinary
nd
EU share of global 25% (2 after the United States of 31%
market America)
EU market €48 billion (1990) - €220 billion €5 billion (2014)
(2014)
EU expenditure on R&D €27.5 billion/yr (2014) €500 million/yr (2014)
Number of companies ~4,200 (mostly large companies, employing 250 persons or more)
Employment 815,000 jobs full time jobs (incl. 50,000 full time jobs
R&D)
EU trade surplus €55 billion euros (2013)
Sources: (IFAH-Europe, 2016; EFPIA, 2015a; EFPIA, 2015b; Eurostat, 2013)
3
Value added is a method of evaluating the contribution to overall Gross Domestic Product. It is calculated by
taking the difference of the industry’s gross output (sales, etc) and the cost of intermediate inputs.
12 Options for a strategic approach to pharmaceuticals in the environment – Task 1 Report2.2.Trends in marketing authorisations
Before reaching the consumers, any pharmaceutical must go through specific procedures
for marketing authorisation and market access. A pharmaceutical can be placed on the
EU market only after a marketing authorisation has been granted in accordance with the
4
pharmaceutical legislation: (i) either by the competent authority of a Member State for
its own territory (national authorisation) or (ii) by the European Commission for the entire
EU (EU-wide authorisation). As a result of these procedures, new pharmaceutical
products are authorised to be produced at industrial scale and placed on the market. The
number of new pharmaceuticals reaching consumers per year has nearly doubled in the
last decade, both for human and veterinary products. Below is a graphical representation
of the trend of the total number of positive opinions for EU-wide marketing authorisations
since 2005 up to the latest available data (year 2014) in the EU via the centralised
procedure (Figure 1).
Figure 1 Number of positive opinions for marketing authorisation in the EU 2005 – 2014, via
the centralised procedure
Source: EMA Annual Reports, years 2005 - 2014
In 2014, the EMA recommended 82 pharmaceuticals for human use for marketing
authorisation, with 81 approved by the Commission in 2015 (EMA, 2015b; EMA, 2014).
Half of those approved in 2014 contained a new active substance. We see that
increasingly, orphan medicines are being developed and approved. Orphan medicines
are intended for the diagnosis, prevention or treatment of life threatening or chronically
debilitating conditions that affect not more than five in 10,000 people in the EU. As it is
not often profitable for companies to develop pharmaceuticals for rare diseases, EU
legislation provides incentives for developers to develop such medicines. As such, an
increasing trend can be observed in applications for approval, as well as an increase in
overall authorisations of such pharmaceuticals (EMA, 2015b).
In 2014, 20 new veterinary pharmaceuticals were recommended for marketing
authorisation - 9 for food producing species and 11 for companion animals – confirming
the increase observed in previous years, in part due to the Minor Use Minor Species
(MUMS) incentive policy that stimulates the development of veterinary medicines for
minor species and rare diseases in major species (EMA, 2015b).
A few thousand APIs are currently authorised on the EU market as a whole. Of 4,000
APIs available in the world (KNAPPE, 2008), 3,000 are currently authorised on the EU
market (Touraud et al., 2011). However, according to the variety of pharmaceutical
4
For a full list of the national competent authorities that authorise pharmaceuticals (for humans and animals) for
each country, see the EMA’s list:
Human Consumption:
http://www.ema.europa.eu/ema/index.jsp?curl=pages/medicines/general/general_content_000155.jsp
Veterinary:
http://www.ema.europa.eu/ema/index.jsp?curl=pages/medicines/general/general_content_000167.jsp&mid=WC
0b01ac0580036d65
13 Options for a strategic approach to pharmaceuticals in the environment – Task 1 Reportauthorisation procedures at national level, the available estimations show that the number
of APIs varies in different Member States (MS). For example, only 850 APIs are
authorised in the Netherlands (Derksen et al., 2004) while 2,000 APIs are authorised in
5
the UK (Ashton et al., 2004), 3,080 in Germany and 2,800 in France (ANSM, 2014).
Several pharmaceutical products contain the same active ingredient. For example, in
Germany, there are about 50,000 authorised drugs, with 2,700 of these drugs accounting
for about 90% of total consumption, which contain 900 different active substances
(Kummerer, 2004).
2.3.Trends in pharmaceuticals consumption
Human consumption
6
Overall, there is an increasing trend in the consumption of pharmaceuticals in the EU , in
particular driven by the use of antimicrobials (see Box 1), as well as pharmaceutical
drugs related to ageing and chronic diseases (antihypertensives, cholesterol lowering
drugs, antidiabetics, and antidepressants) (see Table 3) (ECDC, 2015; OECD Library,
7
2016) .
For further insights on available information on pharmaceutical consumption, an inventory
of drug consumption in several Member States has recently been published in the context
of the research project “PROTECT”, based on the review of previous drug inventories,
national drug consumption databases and interviews (PROTECT Consortium, 2013).
Box 1: Trends in anti-microbial consumption in the EU
According to the European Centre for Disease Prevention and Control (ECDC),
antimicrobial consumption (expressed in defined daily doses (DDD) per 1 000
inhabitants and per day) significantly increased from 2010 to 2014, in particular in
households (see table below). This EU average hides large inter-country variations,
both in trends and actual consumption. Antimicrobial consumption in Europe ranged
8
from 10 DDD in the Netherlands to 32 DDD in Greece in 2014 (See Table 2 below).
Table 2: EU Consumption of anti-microbials (in DDD per 1,000 inhabitants and per day)
MS with highest
Average annual
MS with lowest
consumption
consumption
significant
significant
decreases
increases
MS with
MS with
change
2010
2011
2012
2013
2014
20.1 20.8 21.2 21.8 21.6 0.39 Greece, Netherlands UK Sweden
Households
Romania, Estonia, (0.61) (-0,36)
France, Latvia, Cyprus
Cyprus, Sweden, (-0,39)
Belgium Slovenia
5
From http://www.vfa.de/de/arzneimittel-forschung/datenbanken-zu-arzneimitteln/amzulassungen-gentec.html,
154/0.05 = 3080
6
http://www.oecd-ilibrary.org/sites/9789264183896-
en/03/11/index.html?itemId=/content/chapter/9789264183896-38-
en&_csp_=45f4df11dc99cd2019aa9aa30865f74f
7
Note that the latest medicinal use data for Europe is limited to 2008 in Eurostat. Currently, the database is
being updated, with an expected publication in December 2016, therefore statistics from the Organisation for
Economic Co-operation and Development (OECD) and the European Centre for Disease Prevention and
Control (ECDC) statistics were used to illustrate the latest consumption trends.
8
Sales or prescription data presented in DDDs per 1,000 inhabitants per day may provide a rough estimate of
the proportion of the study population treated daily with a particular drug or group of drugs. As an example, the
figure 10 DDDs per 1,000 inhabitants per day indicates that 1% of the population on average might receive a
certain drug or group of drugs daily (WHO, 2016).
14 Options for a strategic approach to pharmaceuticals in the environment – Task 1 Report1.9 2.0 2.0 2.1 2.0 0.03 - - Denmar None
Hospital
k (0,10)
Sources: (European Centre for Disease Prevention and Control, 2014; ECDC, 2015)
Since recently, significant increases can be observed in the EU as well as globally for
two ‘last resort’ antibiotic classes: carbapenems and polymixins. Carbapenems are a
class of beta-lactams chiefly employed against Gram negative infections, which are the
most difficult infections to treat. Carbapenem use has increased rapidly in Europe,
albeit with regional variations: measured in DDD per 1,000 inhabitants per day (DID),
the range was from 0.0136 DID in Bulgaria to 0.381 DID in the UK (in 2013) (Center for
Disease Dynamics, 2015).
Figure 2: Consumption of Antibacterials for Systemic Use (ATC group J01 ) in the primary
care sector in Europe for years 2005, 2010, and 2014
Source: Antimicrobial consumption database, ESAC-NET European Centre for Disease Prevention
and Control, 2014
15 Options for a strategic approach to pharmaceuticals in the environment – Task 1 ReportFigure 3 Geographical Heat Mapping of Consumption of Antibacterials for Systemic Use
(ATC group J01) in the community (primary care sector) in Europe, 2014
Source: Antimicrobial consumption database, ESAC-NET European Centre for Disease Prevention and
Control, 2014
Table 3: Consumption data of other most represented types of pharmaceuticals (in DDD per
1,000 inhabitants and per day in the EU)
Trends in EU-18 consumption Top 5 -MS with highest MS with lowest
between 2000 and 2012 consumption (2013) consumption
antihypertensive x ~2, i.e. from < 200 DDD in Germany, Austria, Luxembourg,
2,000 to 357DDD per 1,000 Hungary, Portugal, France,
people per day in 2012 (with Czech Republic, Spain
Estonia (x ~3) Finland, Slovenia,
& Luxembourg (x ~4)) Luxembourg
cholesterol- > x 3, i.e. from 29 DDDs per Slovakia, Estonia, Austria,
lowering 1,000 people per day in 2000 to the UK, Belgium, Germany, Italy,
nearly 100 DDDs in 2012 Denmark (at least 30% Sweden
higher than the EU
average)
Antidiabetics x ~2, i.e. from ~30 DDD per Finland (86 DDD per Austria, Denmark,
1,000 people per day in 2000 to 1,000 people per day), Sweden, Estonia,
66 DDD in 2012 Germany (83) and the Solvakia
UK (82)
Antidepressants x ~2, i.e. + 20 % on average in Portugal, Denmark, Estonia, Hungary,
Europe per year since 2000, from Sweden Slovakia, Italy,
< 30 DDD in 2000 to 56 DDD in Netherlands
2012
Sources: OECD Library, 2016; ECDC, 2015; Lewer, O’Reilly, Mojtabai, & Evans-Lacko, 2015
Consumption patterns depend, amongst other factors, on the prevalence of illness, which
may differ from a country to another. For example, in Europe, the prevalence of raised
16 Options for a strategic approach to pharmaceuticals in the environment – Task 1 Reportblood cholesterol for both sexes aged 25 and older ranges from 39% of the population in
Bosnia and Herzegovina, to 69% in Iceland (nonetheless it is to be noted that on average
Europe has the highest levels of cholesterol of all continents based on latest World
Health Organization data from 2008) (WHO, 2008). Whereas high cholesterol levels
plague Western European countries, high blood pressure is more prevalent in Eastern
European countries. In general, Western European countries have a lower prevalence of
raised blood pressure for males aged 18 and over, ranging from less than 20% of the
population in the UK suffering from high blood pressure, while in some Eastern European
countries over 35% of the said population has high blood pressure, such as in Estonia,
Latvia and Lithuania (WHO, 2014).
Veterinary consumption of pharmaceuticals
Pharmaceuticals are used for livestock (food-producing animals, estimated at >700,000
9
in the EU, incl. cattle, pigs, sheep and poultry , to add to the ~1.25 million tonnes of
10
aquaculture goods that were produced in aquaculture farms in the EU in 2011 ) or for
11
pets (which represented nearly 195 million in the EU in 2012 ). They can be used in
different amounts depending on species: in Germany for instance, 98 % of the veterinary
antibiotics are used for treating pigs and poultry, while the remaining 2 % are spread
among other species (GACE, 2007). In the EU, their use is only authorised for prevention
of disease and treatment of disease (therapeutic, prophylactic or metaphylactic use), as
the use for growth promotion was banned in 2006. At the time, studies showed that this
ban could temporarily lead to short-term increase in total therapeutic antibiotic
consumption, but no lasting negative effects were detected on mortality rate, average
daily weight gain, or animal production (e.g. (Aarestrup, Jensen, Emborg, Jacobsen, &
Wegener, 2010)).
12
The highest sales concern parasiticides, vaccines and antimicrobials (see Box 2, with a
focus on antimicrobials).
A recent publication from EMA highlights that substances that have been categorised as
Persistent, Bioaccumulative and Toxic substances (PBTs) or potential PBTs are used
mainly in veterinary medicinal products (VMPs) for the treatment of (a wide range of)
parasites (both internal and external) in all major food-producing animal species. EMA
also expects that they are used extensively throughout Europe (EMA, 2016).
Box 2: Anti-microbial consumption in livestock
Animal production uses a large amount of antibiotics, although their use varies greatly by
country. Globally, estimates of total annual global antibiotic consumption in food animals
vary considerably, due to poor surveillance and data collection in many countries, ranging
from 63,000 tonnes (Van Boeckel, et al., 2015) to 240,000 tonnes (Grace, 2015) (based
on active ingredients). Van Boeckel et al. (2015) estimate that global consumption of
antibiotics in food animals will increase by 67 % on a global scale from 2010 to 2030,
mainly driven by Brazil, Russia, India, China, and South Africa. Yet, the latest report
published in October 2015 by the EMA on veterinary antimicrobials shows that in the
EU/EEA (based on data from 26 countries), the sales of antibiotics for use in animals
amounted to about 8,050 tonnes in 2013, and fell by approximately 8% between 2011
and 2013 (EMA, 2015).
This report also shows that the usage of antibiotics, expressed in milligrams sold per
13
Population Correction Unit (PCU ) in 1,000 tonnes, varies considerably country by
country. For instance, Cyprus uses 100 times more antimicrobials (in mg per PCU) than
Norway (EMA, Sales of veterinary antimicrobial agents in 26 EU / EEA Countries in 2013,
9
http://www.ifaheurope.org/food-producing-animals/about-food-producing-animals.html
10
http://ec.europa.eu/fisheries/documentation/publications/2015-aquaculture-facts_en.pdf
11
http://www.fediaf.org/facts-figures/
12
Countries included in this estimate: AT, BE, CH, CZ, DE, DK, ES, FR, UK, GR, HU, IE, IT, NL, PL, PT, SK
Suggestion to cite the reference here.
13
estimated weight at treatment of livestock and of slaughter animals in the corresponding year
17 Options for a strategic approach to pharmaceuticals in the environment – Task 1 Report2015a).
Figure 4: Country sales of veterinary antimicrobial agents for food producing animals PCU
(1,000 tonnes) mg/PC
Source: ESVAC 2015a ,
http://www.ema.europa.eu/docs/en_GB/document_library/Report/2015/10/WC500195687.pdf
This page is left intentionally blank.
18 Options for a strategic approach to pharmaceuticals in the environment – Task 1 Report3. Pharmaceutical emissions
throughout their life cycle
In brief
The present chapter highlights main pathways of contamination of the
environment by pharmaceuticals.
Contamination of the environment by pharmaceuticals can occur all along the
life cycle of pharmaceuticals, from their manufacturing to their disposal (see
Figure 5), in their original form (APIs) or as metabolites or other transformation
products.
There are three main known pathways by which APIs can reach the
environment:
o a first pathway is through wastewater discharged from API manufacturing sites:
the contribution of manufacturing facilities to emissions of medicinal products
and/or their residues has been considered negligible until now. However, pollution
downstream from manufacturing plants has been observed in the EU and has
been recently subject to increasing attention;
o a second pathway, considered the most important in terms of volumes, results
from normal consumer and animal use and excretion: between 30 and 90% of the
orally administered dose of pharmaceuticals are generally excreted as active
substances in the urine and faeces of humans or animals despite metabolism;
o a third pathway results from the improper disposal of unused or expired medicines
by consumers. Although the treatment of wastewater can partly eliminate or
remove pharmaceuticals, some traces are still detectable in effluents as well as in
the receiving surface and groundwater.
As a result of the second pathway, the environment may be contaminated
through the application in the field of manure, sludge or reclaimed wastewater
containing pharmaceuticals. In the EU, sludge, manure and wastewater have
been found to contain a number of contaminants, including a variety of
pharmaceuticals, and therefore are likely to contaminate the soils, while it has
been shown that plants have the capacity to accumulate pharmaceuticals from
the media in which they are growing.
Emissions into the environment from incineration are a priori considered
negligible because of the environmental legislation regulating the treatment of
incinerator smoke, while long-term studies on leachates from landfills are still
lacking to properly assess the importance of this pathway. Significant amount of
work has been made in the EU about the efficiency of wastewater treatment
plants (WWTPs) in removal and degradation of medicinal products, both
through monitoring and modelling, although the actual costs-benefits of
additional treatment steps remain to be assessed.
There is still a need to improve monitoring strategies to characterise the
emissions of pharmaceuticals from different facilities (households, hospitals,
health care centres, WWTPs, incineration facilities, manufacturing sites, etc.)
and centralise the information in a standardised format. In particular, the picture
of pharmaceutical pollution from manufacturing is still highly fragmented, and
emissions regarding WWTPs and use of potentially contaminated
manure/sludge need to be better characterised.
19 Options for a strategic approach to pharmaceuticals in the environment – Task 1 ReportContamination of the environment by pharmaceuticals can occur all along the life cycle of
pharmaceuticals, from their manufacturing to their disposal (see Figure 5), in their original
form (APIs) or as metabolites or other transformation products.
A transformation product is any new compound created from an API,
biotically or abiotically. Biodegradation is a type of transformation allowing
the API to be broken-down until – optimally – complete mineralisation;
A metabolite is a transformation product obtained biotically, either by
human/animal metabolism (and then excreted in the environment) or by
microbial degradation in the environment.
Transformation products which are not metabolites also include for instance compounds
obtained through photoreaction in the environment and compounds obtained through UV
or chlorination treatment in WWTPs.
Figure 5: Pharmaceuticals life-cycle steps and pathways of emissions (Deloitte)
3.1.Manufacturing
Until recently, effluent from pharmaceutical production facilities had largely been
neglected as a source of pharmaceutical contamination of the environment (Deegan et
al., 2011). The contribution of manufacturing facilities to emissions of pharmaceuticals
and/or their residues was generally considered negligible, even though pollution
downstream of manufacturing plants has been sporadically observed while monitoring
specific sites, e.g. the Rhine (Sacher et al., 2008) or the Lake Leman (Bernard et al.,
2007).
However, a review conducted by Larsson showed that recent studies have identified
direct emission from drug manufacturing as a source of potentially high discharge,
notably when compared to emissions from consumption (Larsson, 2014). Because
production (both of the API itself and its formulation into drug products for patient use) is
concentrated in specific locations and not distributed across large areas, point-source
pollution can arise, potentially leading to locally high concentrations. The picture of
pharmaceutical pollution from manufacturing is still highly fragmented and the extent of
discharge from pharmaceutical plants remains unknown (Larsson, 2014), but this step of
the life-cycle of pharmaceuticals is now subject to increased interest. For instance
Swedish county councils have started to request monitoring of emissions during
manufacturing when producing pharmaceuticals and the scientific community calls for
20 Options for a strategic approach to pharmaceuticals in the environment – Task 1 Reportbetter considering this issue in environmental risk assessments (e.g. (Caldwell D. J.,
2016)).
3.2.Consumption
The consumption phase is considered to be the biggest contributor to the emissions of
pharmaceuticals into the environment, in particular through excretions (BIO IS, 2014).
There, pharmaceuticals can reach the environment as the original API or as metabolites
after transformation by human or animal metabolism.
Pharmaceuticals can also reach the environment directly depending on the mode of
administration (when the pharmaceutical cannot be administered directly to the animal
but must be diluted into the aquatic medium as can be the case for some medicines used
in aquaculture).
Figure 6 presents a schematic diagram of the known contamination pathways related to
the use phase for both human and veterinary medicinal products. Emissions related to
the wastewater treatments and the use of manure and sludge are described in section
3.3.
Figure 6: Emission pathways related to the use-phase of medicinal products
3.2.1. Sources of emissions from human consumption
The main pathway of emissions from the use phase remains consumer excretion into
sewer and in turn discharges from wastewater treatment systems, which result in
continuous introduction of pharmaceuticals in the environment. Previous research shows
that, despite metabolism, between 30 and 90% of the orally administered dose of
pharmaceuticals are generally excreted as active substances in the urine and faeces
(Halling-Sørensen et al., 1998; Rang et al., 1999; Alcock et al., 1999; Holtz et al., 2006).
For instance, while pharmaceuticals such as atenolol, sotalol and valsartan are excreted
mainly unchanged (>96%), others such as metoprolol, propranolol, diltiazem and
verapamil undergo extensive metabolism with just a small percentage of the dose being
excreted unchanged (up to 10%) (Brunton et al., 2012). By compiling 42 studies from
1998 to 2015, Godoy et al. highlighted (through the example of hypertensives) that even
pharmaceuticals extensively metabolised can be frequently detected in their parental
forms at toxicologically relevant concentrations in aquatic environments (see Chapter 4),
in part as a result of their high consumption and continuous introduction into those
compartments (Godoy et al., 2015).
21 Options for a strategic approach to pharmaceuticals in the environment – Task 1 ReportThese emissions mostly come from municipal wastewater systems following the
consumption of medicines in households (Götz et al., 2010; Kümmerer, 2010; Michael et
al., 2013). A small proportion of these emissions comes from hospitals and health care
facilities, which differentiate itself from domestic ones by the nature of administrated
molecules (Kümmerer, 2001). Several studies show that API emitted from hospitals can
generally be found in low proportions in the urban wastewater (below 25%) (Kümmerer,
2010; Ort et al., 2010; Le Corre et al., 2012; Helwig et al., 2013). However, Santos et al.
(2013) showed that this fraction can reach 74% according to the compound type and the
hospital beds/inhabitants ratio of the watershed (Santos et al., 2013).
3.2.2. Sources of emissions from animal consumption
As with humans, substantial amounts of active substances can be excreted via urines
and faeces of animals. Pharmaceuticals may reach soil, ground water (by leaching) and
surface water (via direct excretions in water for pasture animals, via surface run-off or transfer from
ground water). The contribution of excretions from farming animals in pasture to the
environmental load of medicinal products has been investigated (e.g. Fernandez et al.,
14
2009; 2014 study from UBA ). In comparison, there is still no study quantifying the
environmental emissions of medicinal products administered to pets.
Besides excretions, surface water can also be contaminated by run-off from treated animals (for
15
example, in the case of bath treatments for sheep . Feed surplus is also a possible source of
emissions, on occasions when medicated feed is used, notably in the case of aquaculture
(see Box 3).
14
See : www.umweltbundesamt.de/en/topics/soil-agriculture/ecological-impact-of-farming/pharmaceuticals
15
http://www.ema.europa.eu/docs/en_GB/document_library/Scientific_guideline/2016/02/WC500202512.pdf
22 Options for a strategic approach to pharmaceuticals in the environment – Task 1 ReportBox 3: Focus on the case of aquaculture
In aquaculture, the route of administration of authorised treatments in fish is either via
immersion bath or medicated feed. The treatments can thus be directly discharged into the
aquatic environment.
16
Source
Furthermore a recent study suggests that 70 to 80 % of antibiotics given to fish are
excreted back into water (O'Neil, 2015), further contributing to the contamination of the
environment. Use of antibiotics has been flagged as a particular concern in open
aquaculture where they enter the surrounding marine environment via fish faeces and
17
can persist for long periods in sediment . In 2013, the results of a survey on the
occurrence of pharmaceuticals products in the sediments of Scottish marine fish farms
showed that concentrations were often below the limit of detection. Yet, the results also
highlighted some hotspots, with measured concentrations reaching 2.2 µg of
teflubenzuron and 22 µg of emamectin per /kg of dry weight sediment (SEPA et al.,
2013). Significant emissions of pharmaceuticals were also detected in salmon and
shrimps farming in Norway in the 2000’s (Grave et al., 1999). However, O’Neil indicates
that the total quantity of antibiotics used in this country (main aquaculture producing
country in the EEA) has decreased by 99% while the total volume of fish produced has
increased 20 fold during the period 1987 – 2013, thanks to changes in treatment and
production strategies (e.g. new vaccines which are used to control several major
bacterial diseases; change in fallowing practices).
3.3.Waste management
Waste management reduces pharmaceutical emissions, but they can still enter the
environment.
3.3.1. Solid waste
18
Landfills accepting pharmaceutical solid waste and sewage sludge can produce
leachates containing pharmaceuticals at concentrations reaching 1g/L (Table 4) – similar
to or even higher than those found in wastewater treatment plant influents (Ramakrishnan
et al., 2015).
19
Table 4: Pharmaceuticals frequently found in landfill leachates
Compound Use Concentration References
(µg/L)
16
ibid
17
http://ec.europa.eu/environment/integration/research/newsalert/pdf/sustainable_aquaculture_FB11_en.pdf
18
WHO guidelines specify that cytotoxic and narcotic drugs should never be landfilled
19
Adapted from (Eggen et al, 2010)
23 Options for a strategic approach to pharmaceuticals in the environment – Task 1 ReportIbuprofen NSAID 69.9–166.624 (Eggen et al., 2010)
Propyphenazone Analgesic-rarely used todayyet reduced by 60 to 96% (Bendz et al., 2005). In comparison, carbamazepine removal
rates are much lower (Joss et al., 2005).
Some pharmaceuticals have high removal rates but are in fact transformed into other
compounds of concern, which might be of concern. For instance, metformin has high
removal rates but bacterial treatment leads to the formation of guanylurea which can be
recovered at rates up to 91% and 85 % (in the WWTP effluent and receiving water,
respectively) of the metformin content in the influent (Oosterhuis et al., 2013). The
specific case of metformin has been increasingly discussed also because of its high
volumes (it is the most commonly prescribed antidiabetic) and the fact that it is not
21
metabolised by humans (100% excretion rate ). For instance, Trautwein et al. measured
metformin and guanylurea in Southern German sewage treatment plant, which revealed
very high average concentrations in influent (Met = 111,800 ng/L, Gua = 1300 ng/L) and
effluent samples (Met = 4,800 ng/L, Gua = 44,000 ng/L) (Trautwein et al., 2014).
These last few years, the highly variable efficiency of wastewater treatments at removing
pharmaceuticals has led to much research on treatment techniques and factors
influencing their efficiency. It appears that advanced treatment is necessary to tackle the
issue of pharmaceuticals. For instance, an ozone/granular activated carbon combination
used for drinking water treatment proved to be effective in removing most antibiotics
(except danofloxacin and enrofloxacin which have an ionisable character and insufficient
ozonation kinetic constant) in experiments conducted by Guillon et al. (Guillon et al.,
2015). Nevertheless, some techniques still need optimisation: it was for instance reported
that photocatalytic treatment could result in an increased toxicity of effluents (Santiago-
Morales et al., 2013; Romero et al., 2011).
3.3.3. Contamination of soil due to contact with waste
Amending soil with sludge or manure provides essential nutrients in agriculture, while
irrigation with (reclaimed) wastewater allows for agriculture in regions where water
22
resources are limited (EC, 2014) . However, sludge, manure and wastewater have been
found to contain a number of contaminants, including a variety of pharmaceuticals
(Prosser et al., 2015).
The potential uptake of pharmaceuticals by plants growing in amended soil or irrigated
with reclaimed wastewater has been explored in the last few years. The body of studies
collected during a 2015 review shows that plants have indeed the capacity to accumulate
pharmaceuticals from the media in which they are growing (Prosser et al., 2015). For
instance, Boxall et al. observed that the veterinary pharmaceuticals florfenicol,
levamisole, and trimethoprim in spiked soil can accumulate in lettuce, and enrofloxacin,
23
florfenicol, and trimethoprim in carrots (Boxall et al., 2006) . Wu et al. investigated
whether 20 pharmaceuticals could accumulate in four plants species (lettuce, spinach,
cucumber, and pepper) grown in a spiked nutrient solution. All were detected in the roots
of the plants and 13 were detected in the leaves of the plants (Wu et al., 2013).
The authors of the aforementioned review found that there were considerably fewer
studies examining uptake due to amendment with manure than due to sludge
amendment or reclaimed wastewater irrigation (Prosser et al., 2015).The authors
therefore highlight the need for more emphasis on investigating the accumulation of
pharmaceuticals into plants grown in manure-amended soil.
Concentrations of antibiotics in manure may be similar or greater to those observed in
sludge. In Europe agricultural soil is more frequently amended with manure than with
activated sludge (9 million tons of N nutrient comes from manure, while a maximum of
21
Metformin passes through the body unchanged. Guanylurea is formed in the aquatic compartment, after
excretion, by the action of bacteria.
22
Amending soil means adding elements to improve its capacity to support plant life
23
The authors used soil which had measurable residues likely to occur in soils for at least 5 months following
application of manure containing these compounds
25 Options for a strategic approach to pharmaceuticals in the environment – Task 1 Report24
200,000 tonnes come from sludge ). In both cases (manure and sludge), research
shows than digestion and composting reduced the levels of antimicrobials they contain
(Box 4).
Box 4: Impact of digestion and composting on antimicrobial levels in manure and sludge
(Youngquist et al., 2016)
A recent review studied the fate of antibiotics, antibiotic-resistant bacteria (ARB), and
antibiotic resistance genes (ARG) during anaerobic digestion and composting of
manure and sludge. Research on 16 antibiotics in 11 different studies using both
bench-scale and farm-scale composting systems demonstrates that composting
significantly reduces levels of extractable antibiotics in livestock manure in nearly all
cases. Calculated half-lives ranged from 0.9 to 16 days for most antibiotics. There is
more limited evidence that levels of ARB are also reduced by composting. Studies of
the fate of ARGs show mixed evidence for removal during both anaerobic digestion
and during thermophilic composting.
Additional research would be of value to determine optimum anaerobic digestion and
composting conditions for removal of ARB and to increase understanding of the fate of
ARGs during anaerobic digestion and composting.
Irrigation with reclaimed wastewater may lead to even greater exposure of
pharmaceuticals to crop plants than manure or sludge amendments, particularly for
pharmaceuticals that have relatively high solubility in water. Irrigation can occur over the
entire life cycle of the plant, which means exposure when the plant is growing at an
exponential rate and has the greatest capacity to accumulate pharmaceuticals from the
soil. In contrast, exposure of plants to pharmaceuticals via manure or sludge decreases
25
over time (Prosser et al., 2015).
In the EU, the fate of emerging contaminants after irrigation with reclaimed wastewater
has come under scrutiny in the context of the Commission’s work on the development of
minimum quality requirements at EU level for water reuse. The Impact Assessment
preceding the proposal for EU standards (EC, 2014), as well as recent EU guidance
documents (Common Implementation Strategy (CIS)), highlight a lack of comprehensive
understanding of emerging contaminants behaviour, fate and biological potency after
their discharge in the environment, although literature to date and practical feedback from
26
reuse schemes would suggest that water reuse in irrigation represent a de minimis risk
to human health. In this context, a recent JRC draft technical report stresses the need for
a selection of indicators of occurrence for emerging contaminant, in particular
pharmaceuticals (JRC, 2016). Nevertheless, the reuse applications eliciting the highest
27
focus in this report is rather aquifer recharge than irrigation (the document proposes
regular monitoring in reclaimed water before its use for potable or non-potable aquifer
recharge, with an implementation of a watch-list for groundwater).
An example of the most recent development (use of black water) on the issue of
pharmaceuticals in soils is presented in Box 5.
24
EUROSTAT data, code “Gross nutrient balance on agricultural land”
25
Mostly by transfer to another compartment
26
Cyprus, which has a long experience of reusing water for irrigation and groundwater recharge, and where
almost all the (appropriately treated) effluents are now being reused, reports no cases of human diseases
caused by treated wastewater
27
For potable and non-potable use
26 Options for a strategic approach to pharmaceuticals in the environment – Task 1 ReportBox 5: Use of black water as soil amendment
As an alternative to sludge or manure amendment, the use of black water
(unseparated toilet waste) has been investigated in the recent years, notably in
Sweden and Germany (Winker et al., 2010) Research has shown that black water
28
could be a major resource for nutrients and be less contaminated by pharmaceuticals
than manure: for instance, Winker et al. found 5 g/ha of oestrogens when fertilising
with cattle slurry (according to N recommendation to winter wheat) and 1 g/ha when
fertilising with human urine.
Nevertheless, more research is needed regarding potential health risks arising from
the use of black water, in particular regarding the uptake of pharmaceuticals to crops.
28
For instance, black water contains 10 times more nitrogen than grey water (Jonsson et. al, 2015).
27 Options for a strategic approach to pharmaceuticals in the environment – Task 1 ReportYou can also read