Origin Energy 2021 Full Year Results - Year ended 30 June 2021 Frank Calabria, CEO & Lawrie Tremaine, CFO

Page created by Carlos Pearson
 
CONTINUE READING
Origin Energy 2021 Full Year Results - Year ended 30 June 2021 Frank Calabria, CEO & Lawrie Tremaine, CFO
Origin Energy
2021 Full Year Results
Year ended 30 June 2021

Frank Calabria, CEO & Lawrie Tremaine, CFO
19 August 2021
Origin Energy 2021 Full Year Results - Year ended 30 June 2021 Frank Calabria, CEO & Lawrie Tremaine, CFO
Outline
1. Introduction
    - Frank Calabria
2. Financial Review
   - Lawrie Tremaine
3. Operational Review
   - Frank Calabria
4. Strategy and Outlook
   - Frank Calabria

2   19 August 2021   2021 Full Year Results Announcement
Introduction
                                                           Frank Calabria, CEO

3   19 August 2021   2021 Full Year Results Announcement
FY2021 financial results impacted by lower commodity prices

           Statutory Profit/(Loss)                                                 Underlying Profit                          Underlying EBITDA

                  $(2,291)                                                             $318                                     $2,048
                  million                                                              million                                  million
                  (-130.2 cps)                                                         (18.1 cps)
    Reflecting $2.2 billion impairments in Energy                        Down $705 million primarily reflecting lower     Down from $3,141 million in FY2020
          Markets and deferred tax liability                                   oil, gas and electricity prices

             Operating Cash Flow                                                 Adjusted Net Debt                               Final dividend

                    $964                                                                $4.6                                         7.5cps
                    million                                                             billion                                       unfranked

      Up $13 million with lower working capital                              Down $519 million from June-2020            20.0cps FY2021 total (FY2020: 25.0 cps)
          requirements and lower tax paid                                   ($4.2 billion excluding lease liabilities)        31% of FY2021 Free Cash Flow

All comparisons relate to FY2020 unless stated otherwise.
4         19 August 2021           2021 Full Year Results Announcement
Continued strong operational performance across both businesses

                            Integrated Gas                                               Energy Markets

•       94% 2P reserves replacement in FY2021                       •   Delivered $110 million retail cost savings since FY2018

•       APLNG operational flexibility, responding to                •   Deal announced to boost gas supply to southern markets
        changes in market demand
                                                                    •   30k growth in customer accounts
•       Record low unit cost, matched with sustained high
                                                                    •   250k customer accounts migrated to Kraken
        production at APLNG
                                                                    •   Material value uplift in Octopus Energy, a rapidly
•       Cash distribution from APLNG of $709 million
                                                                        growing global renewable energy, services and
                                                                        technology business

    5      19 August 2021     2021 Full Year Results Announcement
Delivering good energy in FY2021

                                                                             Getting energy right

     Our Customers                                        Our Communities                        Our Planet                       Our People
 COVID-19 support                                     Regional procurement              8% decrease in Scope 1 &         TRIFR 2.71, enhanced focus
                                                        increased from 14% to 18%          Scope 2 equity emissions          on preventing serious harm
 NPS score +6
 Spike (demand response)                              >$10 million Indigenous           Solar installations increased    74% staff engagement – top
  growing to ~56k customers                             supplier spend                     by 21% to 74 MW                   quartile ANZ
 Lowered electricity prices for                       >8,400 hours of employee          Progressing renewable            Achieved target of 33%
  most customers                                        volunteering                       hydrogen and ammonia              women in senior roles
                                                                                           opportunities
 APLNG supplying ~30% of                              >$3 million contributed by the                                      Signatory of 40:40 Vision,
  east coast gas demand                                 Origin Energy Foundation          Launched Origin 360 EV            targeting gender balance in
                                                                                           Fleet solution                    executive leadership
 Customer-first approach to                           Beetaloo Native Title Holder
  energy reform                                         engagement report                 Updating emission reduction      Certified Great Place to Work2
                                                                                           targets to a 1.5⁰C scenario

1)   Rolling 12 months at June 2021; compared to 2.6 at June 2020
2)   by the Great Place to Work Institute, the global authority on workplace culture
6         19 August 2021           2021 Full Year Results Announcement
Climate change - working to a 1.5 degree emissions reduction pathway

                           Commitments and targets1                                             Actions

     Updating emissions reduction targets to 1.5°C pathway
                                                                         8% reduction in Scope 1 and scope 2 GHG emissions2 in
                                                                         FY2021 from 17.8 Mt C02-e to 16.4 Mt C02-e
     Support ‘Say on Climate’ and intend to put our climate reporting
      to a non-binding, advisory shareholder vote in 2022
                                                                         EOI for 700MW battery at Eraring, progressing plans for
     Short-term target to reduce Scope 1           by 10% on
                                                         emissions2      300MW solar & storage at Morgan, SA
      average over FY2021-23 (linked to executive remuneration)
                                                                         Signed up to EV100; providing charging infrastructure, smart
     Current science-based emissions reductions targets                 charging and EV fleet solutions to customers

          – Reduce Scope 1 & 2 emissions2 by 50% by 2032                 Feasibility study for Tasmanian green ammonia export project
                                                                         underway. Contributing financially and with in-house
          – Reduce Scope 3 emissions2 by 25% by 2032                     expertise to Australian H2 research centres.

     Ambition to achieve net zero emissions by 2050                     Comprehensive review of the climate position of Origin’s
                                                                         industry association memberships

1)    Emissions targets are from a FY2017 baseline
2)    Equity emissions
7         19 August 2021           2021 Full Year Results Announcement
Financial
                                                           Review
                                                           Lawrie Tremaine, CFO

8   19 August 2021   2021 Full Year Results Announcement
Underlying Profit impacted by lower customer tariffs and commodity prices

                                                                       Movements in Underlying Profit ($m)

                                   (468)

         1,023

                                                           (390)                                      (19)                  (75)                   83
                                                                                164
                                                                                                                                                                 318

         FY20                      EM                 IG - Share of          IG - Other           Corporate           Depreciation &              Other          FY21
                                 EBITDA               APLNG profit            EBITDA               EBITDA              amortisation1

                 Decline in wholesale prices,        Lower realised oil                                                                    Lower interest and
                                                                                                                     Decommissioning
                 higher network charges not            price, partially    Net hedge gains    Primarily reflecting                             tax expense,
                                                                                                                     retail systems, and
                recovered through tariffs and         offset by lower      reflecting lower      one-off ERP                                  partially offset
                                                                                                                     higher generation
                gas supply costs, partly offset        operating and      commodity prices     implementation                                 lower interest
                                                                                                                          provisions
                    by retail cost savings            financing costs                                                                      income on MRCPS

1)   Includes $34m ITDA relating to Octopus Energy
9        19 August 2021          2021 Full Year Results Announcement
Non-cash charges in FY2021

                       Energy Markets impairment                                         Deferred tax liability (DTL) on investment in APLNG
•   Generation PP&E: Lower wholesale prices expected with new                       •   Improved outlook for APLNG is expected to drive higher
                                                                                        distributable cash flow near term
    renewable supply, impacting valuation of generation fleet,
    particularly Eraring                                                            •   Expect MRCPS to be fully redeemed by FY2023 and APLNG
                                                                                        to begin distributing ordinary dividends in the coming years

•   Goodwill: Lower electricity prices impacting margins on                         •   $669 million DTL recognised represents 30% of the dividends
    PPAs. Lower near term gas margins with higher procurement                           expected to be paid in the foreseeable future from existing
                                                                                        equity accounted retained earnings
    costs and subdued C&I demand
                                                                                    •   Accounting issues impacting timing of tax expense recognition
•   Discount rate of 9.6-9.8% pre-tax
                                                                                    •   We expect to receive unfranked dividends from as early as
                                                                                        FY2023 with tax payable on these dividends from FY2024
                                  Jun-21 (post        Impairment      Impairment
    Carrying value ($m)
                                  impairment)           (pre-tax)      (post-tax)   •   Remaining unrecognised DTL at 30 June 2021 is $810 million
    Generation PP&E                        2,793              (833)        (583)        which may be partly or fully recognised in the future
    Energy Markets Goodwill                 3,812             (995)         (995)
    Total                                 6,605             (1,828)       (1,578)

    10    19 August 2021      2021 Full Year Results Announcement
Large-scale Generation Certificates (LGC) strategy

                     LGC spot and forward prices ($/certificate)

                                                                                           •   Deferred surrender of 2.5 million CY2020 certificates,
 60
                                                                                               accounting impacts recorded in H1 FY2021
 50                                                                                            − Incurred shortfall charge of $65/certificate
                                                                                               − ~2.4 million purchased to date (CY2023 forwards) at
 40                                                                                              average price of $19/certificate

 30
                                                                                               − Estimated ~$50 million benefit locked in
                                                                                           •   We plan to repeat this by deferring ~3.1 million CY2021
 20                                                                                            LGCs, accounting impacts in H2 FY2021 and H1 FY2022
                                                                                           •   $262 million refundable shortfall charge included in FY2021
 10
                                                                                               Statutory Loss

     -                                                                                     •   $64 million cost included in Underlying Profit, based on
     Jan-19      Jan-20        Jan-21        Jan-22       Jan-23         Jan-24   Jan-25       estimated future cost
                                                                                           •   Refer to Appendix slide 43 for further details
                 LREC Spot Price                                 LREC FY21 avg spot
                 LREC CY21 FPC                                   LREC CY22 FPC
                 LREC CY23 FPC                                   LREC CY24 FPC

Source: High Voltage Brokers, as at 30 June 2021

11        19 August 2021           2021 Full Year Results Announcement
Cash generation and free cash flow yield remained strong in FY2021

                                Operating cash conversion1                                                                                 Free Cash Flow ($m)
                                                                                                                                   1,644

                                  93%                               96%
                                                                                                                                   21%
                                                                                    85%                                                                             1,140
                  69%
                                                                                                                                                                    15%

                                                                                                                                   5%                               5%

                         FY20                                                FY21                                                  FY20                             FY21
                                                                                                                           Free Cash Flow                  Free Cash Flow Yield (ORG)2
                  Cash conversion                Cash conversion excl futures collateral
                                                                                                                           Free Cash Flow Yield (ASX200)

($m)                                                                FY21            FY20         Change        ($m)                                        FY21          FY20 Change
Underlying EBITDA                                                  2,048            3,141         (1,093)      Cash from operating activities               964             951      13
Non cash items (primarily APLNG EBITDA)                          (1,039)          (1,753)               714    Cash distributions from APLNG                709           1,275   (566)
Underlying EBITDA adj for non-cash items                           1,009            1,387              (378)   Capital expenditure                         (339)       (500)        161
Working cap excl futures collateral                                  (42)              118             (160)   Acquisitions/disposals                       (154)         69      (223)
Electricity futures exchange collateral                                110          (340)               450    Net interest paid                           (231)         (292)       61
Other (primarily impact of LGC shortfall charge)                    (144)                 -            (144)   Free Cash Flow incl major growth             949        1,503      (554)
Tax (paid)/refunded                                                     31          (215)               246    Major growth (Octopus Energy)                 191            141     50
Cash from operating activities                                       964              951                13    Free Cash Flow                              1,140       1,644      (504)

  1)   Calculated as cash from operating activities / Underlying EBITDA adjusted for non-cash items.
  2)   Based on 30 day VWAP of $4.40 per share as at 16 August 2021.
  12       19 August 2021            2021 Full Year Results Announcement
APLNG cash flow expected to increase in FY2022

               APLNG estimated distribution and Origin oil hedging

                                                                                    >$1 billion
     1,200                                                                       (Net of hedging)         110
                                                                                                                            •    In FY2021, APLNG distributed $709 million
                                                                                                          100                    cash to Origin at a realised oil price of
     1,000                                                                                                                       US$43/bbl (A$58/bbl)
                                                                                                          90
      800                                                                                                                   •    FY2022 APLNG estimated to distribute >$1
                                                                                                          80                     billion1, net of Origin oil hedging
      600                                                                                                 70

                                                                                                                A$/bbl
                                                                                                                            •    ~31mmboe (or 50%) of APLNG’s FY2022 oil
$m

      400                                                                                                 60                     exposure priced at ~US$68/bbl before
                                                                                                                                 hedging, as at 28 July 2021
                                                                                                          50
      200
                                                                                                                            •    In addition to shareholder distributions,
                                                                                                          40
                                                                                                                                 APLNG repaid US$494 million of project debt
           -
                                                                                                          30                     in FY2021

     (200)           FY19                  FY20                  FY21             FY22 Estimate1          20
                   A$102/bbl             A$101/bbl             A$58/bbl             A$91/bbl

            Origin oil hedging               APLNG distribution                  Realised oil price (RHS)

1)    Assuming realised JCC oil price of US$68/bbl, an average AUD/USD rate of 0.75 and assuming all APLNG debt serviceability tests are met. Origin hedges losses estimated to be $134 million
13        19 August 2021            2021 Full Year Results Announcement
Focused on capital discipline as well as cost and risk management

                                     • Adjusted Net Debt to EBITDA at 2.9x at June 2021
                                     • Targeting Adjusted Net Debt to EBITDA of 2-3x and net debt below $4 billion over the medium term
Capital discipline
                                     • Continued debt reduction - Adjusted Net Debt down $519 million to $4.6 billion
                                     • Lower interest expense - estimated reduction of $40 - $60 million in FY2022

                                     • Oil hedging to protect capital structure through commodity cycles
Risk management
                                     • Maintain strong liquidity position

                                     • Shareholder distribution policy 30-50% of free cash flow1
                                     • Final unfranked dividend of 7.5 cps determined for FY2021
Dividend
                                     • 20cps total for FY2021 - 31% of Free Cash Flow1, annualised dividend yield of 4.5%2
                                     • Expect low levels of franking to FY2023

                                     • Disciplined approach to expenditure
Cost management
                                     • Growth funded from cash flow

1)   Excluding major growth
2)   Calculated based on past 12 months declared dividends and 30 day VWAP of $4.40 per share as at 16 August 2021
14       19 August 2021           2021 Full Year Results Announcement
Actively managing underlying operating costs and capital expenditure

                   Origin controllable support costs ($m)                                                     Origin capex ($m)
     450                                                                      600

                                                                              500
 400
                                                                              400

     350                                                                      300

                                                                              200
     300
                                                                              100

     250                                                                           -
                FY18        FY19          FY20              FY21    FY22                     FY19            FY20            FY21         FY22 Guidance
                                                                   estimate                                                                 mid-point
                                                                                       Generation sustain   Other sustain   Productivity/growth   E&A

 •     Controllable support costs: 19% reduction expected                      •       Managing sustaining capex on key assets: Eraring major
       FY2018 to FY2022                                                                overhaul, ash dam and Shoalhaven power station
 •     Cost reduction achieved despite higher insurance                        •       Other sustaining capital reducing with completion of
       costs, and ERP project costs                                                    ERP and regulatory market reforms (5 minute settlement)
                                                                               •       Productivity/growth Octopus Energy licensing, Kraken
                                                                                       implementation costs, and CES
                                                                               •       Exploration and appraisal: Beetaloo and Canning

15         19 August 2021   2021 Full Year Results Announcement
Managing oil price exposure

            Oil hedging program designed to protect capital structure through commodity cycles
                                                                                                                                  FY2022 Full Year Oil Price Sensitivity
                                                                                                         80
FY2022

                                                                   Effective Oil Price (US$/bbl)
                                                                                                         70
•    Origin share of APLNG JCC oil price exposure is ~23 mmboe
                                                                                                         60
•    As at 28 July 2021, 11.7 mmboe priced at US$66/bbl based on
     LNG contract lags and hedging outcomes                                                              50

                                                                                                         40
•    5.6 mmbbl remaining hedge position via a combination of
     swaps, puts and producer collars, and 2.8 mmbbl purchased                                           30
     calls to increase upside participation
                                                                                                         20

•    $26 million premium spend                                                                                20            30             40             50              60            70             80
                                                                                                                        Oil price (US$/bbl) for balance of FY2022 – Aug 2021 to Jun 2022

                                                                                                                                    FY2023 Full Year Oil Price Sensitivity
FY2023                                                                                                   80

                                                                         Effective Oil Price (US$/bbl)
•    4.4 mmbbl hedged at US$54/bbl, with upside participation                                            70

     above US$63/bbl and capped at US$78/bbl                                                             60

•    1.6 mmbbl hedged at floor of US$35/bbl, with upside                                                 50

     participation up to US$90/bbl                                                                       40

•    $20 million premium                                                                                 30

                                                                                                         20
                                                                                                              20            30             40              50             60             70             80

                                                                                                                                                     Oil price (US/bbl)

                                                                                                               Effective price after contract lags              Effective price after contract lags & hedging

16     19 August 2021   2021 Full Year Results Announcement
Energy Markets Underlying EBITDA down 32%

                         Movements in Underlying EBITDA ($m)
                                                                                              Electricity gross profit down $288 million or 24% to $899 million:

                     (288)                                                                    •   Margin impacts (-$296 million)
      1,459                                                                                       − Lower wholesale electricity and LGC prices flowing into tariffs
                                  (297)                           36
                                                   81                                               (net -$220 million impact)
                                                                                                  − Network (-$42 million) and metering (-$13 million) costs not
                                                                                                    recovered in regulated tariffs
                                                                                991               − Ongoing customer support and competition (-$21 million)
                                                                                              •   Volume (+$8 million): Higher residential demand, partially offset by
                                                                                                  lower business volumes due to COVID 19
   FY2020          Electricity    Gas        Cost to serve Octopus, S&ES,   FY2021
                                                         LPG, Future Energy
                                                                                              Gas gross profit down $297 million or 40% to $447 million:
                                                        FY21            FY20    Change
                                                                                              •   Margin impact (-$272 million)
Underlying EBITDA ($m)                                   991            1,459     (468)
                                                                                                  − Lower prices to customers, including oil-linked sales (-$105 million)
Electricity                                                                                       − Higher JKM linked procurement costs in second half (-$51 million)
 Volumes sold (TWh)                                     33.5             33.5             -
                                                                                                  − Roll-off of long term supply and transport capacity contracts (-$78
                                                                                                    million) and impact of supply contract price reviews (-$38 million)
 Gross profit ($m)                                      899             1,187     (288)
 Gross Profit ($/MWh)                                   26.8             35.4         (8.6)   •   Volume (-$25 million): COVID impacts and expiry of business
                                                                                                  contracts, partly offset by higher customer numbers and retail demand
Gas
 External volumes sold (PJ)                              193             204           (11)
 Gross profit ($m)                                      447              744      (297)       Delivery of $110 million savings on FY2018 baseline, $81 million
 Gross Profit ($/GJ)                                     2.3              3.7         (1.3)   achieved in FY2021

      17      19 August 2021      2021 Full Year Results Announcement
Integrated Gas Underlying EBITDA down 35%

                                                                           Movements Underlying EBITDA ($m)
                                80

                                                       (945)
                                                                                                                                                   17
                                                                                                                         147
                                                                                  (71)
       1,741                   1,741                                                                  166

                                                                                                                                                 1,118         1,135
                                                        876                                                              971     Integrated
                                                                                  805                805
                                                               Share of APLNG                                                    Gas - Other
                                                                (-$770 million)                                                (+$164 million)

      FY2020               LNG volume               LNG price               Domestic revenue Opex/other income Oil & LNG hedging           Origin costs        FY2021

                                        FY21          FY20        Change          Share of APLNG EBITDA down $770 million to $1,145 million:
 Share of APLNG ($m)                    1,145          1,915           (770)      •   Realised oil prices of US$43/bbl (A$58/bbl) vs US$68/bbl (A$101/bbl) in FY2020
 Integrated Gas - Other ($m)             (10)          (174)             164
Underlying EBITDA ($m)                  1,135          1,741           (606)
                                                                                  •   Lower royalties, tariffs, gas purchases as well as reductions in non-operated and
                                                                                      downstream operating costs
APLNG 100%                                                                        Integrated Gas – Other costs reduced $164 million to net loss of $10 million:
 Sales volumes (PJ)
                                                                                  •   Commodity hedging and trading: $55 million net gain compared to a $92 million
  Domestic Gas                           158            187             (29)
                                                                                      net loss in FY2020
  LNG                                    498            481               17
 Realised price (A$/GJ)                                                               − $92 million oil hedging gain, offset by $37 million LNG trading loss
  Domestic Gas                           4.24          4.61            (0.37)
  LNG                                    7.79         12.86            (5.07)     •   Other Origin only costs of $65 million, down $17 million reflecting one off payments
                                                                                      to reduce share of overriding royalty in the Beetaloo in the prior period
 18       19 August 2021         2021 Full Year Results Announcement
FY2021
                                                            Operational
                                                            Review
                                                            Frank Calabria, CEO

19   19 August 2021   2021 Full Year Results Announcement
Energy Markets

20   19 August 2021   2021 Full Year Results Announcement
Lower wholesale prices flowed through to tariffs in FY2021

                                       NSW electricity forward price                                                               LGC spot price
                                               ($/MWh)                                                                              ($/certificate)
100                                                                                            90

                                                                                               80
90
                                                                                               70
80
                                  -$10/MWh                                                     60
70                                                                                             50

60                                                                                             40

                                                                                               30                                  -$15/cert flowing into customer tariffs
50
                                                                                               20
40
                                                                                               10
30                                                                                              -
 Jul-18        Oct-18    Jan-19    Apr-19    Jul-19   Oct-19    Jan-20       Apr-20   Jul-20     Jul-18                                  Jul-19                                  Jul-20

              FY20 Swap             FY20 Avg              FY21 Swap               FY21 Avg                   LGC Spot Price        FY19 average spot             FY20 average spot

           Source: AEMO/Bloomberg                                                                   Source: High Voltage Brokers

 •        Lower wholesale electricity and large-scale generation certificate (LGC) prices flowed through into retail and business tariffs in FY2021,
          reducing the margin on both ~16TWh of relatively fixed cost energy supply and ~3 million relatively fixed cost LGCs
 •        Energy supply costs decreased driven by lower net pool and swap costs, lower green scheme costs and lower capacity hedge costs
          – We continue to optimise our swap and short positions to capture the benefit of lower prices and increasing intervals of negative prices
          – Eraring and our gas peaking fleet provides cover during peak periods, such as the recent volatility experienced in May and June 2021

     21        19 August 2021          2021 Full Year Results Announcement
Eraring provided value in peak periods in FY2021

                                           Eraring output compared with pool price

 GWh                                                                                                                               •   Eraring able to respond to lower demand, as well
                                                                                                                       $/MWh
                                                                                                                                       as seasonal and intra-day swings
3,000                                                               Lower generation                                         180
                                                                   during period of mild
                                                                                            Covering peak pricing                      – FY2021 realised price $76/MWh (NSW
                                                                    weather and high
                                                                                            by increasing output as          160         average pool price of $65/MWh)
                                                                                               market tightened
2,500                                                              baseload availability
                                                                                                                             140       – 30% minimum generation with ramp capability
                                                                                                                                         of >10 MW/minute/unit
2,000                                                                                                                        120
                                                                                                                                   •   Eraring cash cost ~$55/MWh on average over
                                                                                                                             100       recent years (~$40 fuel, ~$15 opex and capex)
1,500
                                                                                                                             80
                                                                                                                                   •   FY2022 coal supply
                                                                                                                                       – ~4mt legacy contract to end of FY2022
1,000                                                                                                                        60
                                                                                                                                       – ~1mt procured under short term contracts
                                                                                                                             40
 500                                                                                                                               •   Contracting beyond FY2022 ongoing,
                                                                                                                             20        requirements based on pool price outlook
   0                                                                                                                         0     •   Eraring typically procures closer to 5500 index
             Jul      Aug       Sep       Oct        Nov       Dec           Jan     Feb   Mar     Apr     May        Jun              coal and has diversity of supply via conveyor and
                                                                                                                                       rail
                   FY21 GWh            NSW pool price              Eraring Cash Cost1        Eraring volume-weighted price

        1)     Eraring cash costs include fuel, opex and maintenance capex

        22          19 August 2021             2021 Full Year Results Announcement
Domestic gas prices rebounding and supply price reviews complete

             LNG netback and domestic gas prices (A$/GJ)                                                                                 Gas gross profit movement ($m)
20
                                                                                                                                (25)
 18
                     Prices begin to fall
 16                 from 2018 based on                                                                                                        (105)
                  linkage to international
 14                        prices                                 Prices fall                                      744                                         (51)
                                                               significantly as
                                                                                                                                                                           (78)
 12                                                           COVID-19 impacts
                                                                  demand                                                                                                                 (38)
10
    8                                                                                                                           Market impacts: Subdued demand,             Impacts as legacy
                                                                                                                                lower prices in customer tariffs and      contracts rolled off or
    6                                                                                                                             higher JKM linked supply costs           repriced (next price
                                                                                                                                                                                                         447
                                                                                                                                                                             review FY2024)
    4
    2
 -
        Jul-18   Nov-18   Mar-19     Jul-19      Nov-19    Mar-20   Jul-20    Nov-20     Mar-21       Jul-21   FY2020 Gas      Volumes      Wholesale       H2 JKM     Contract roll Price reviews   FY2021 Gas
                                                                                                                gross profit                 prices                       offs                       gross profit
                  JKM netback price - Wallumbilla (ACCC)                     Wallumbilla spot price

     Source: ACCC, AEMO

•       Lower JKM linked supply costs were a benefit in FY2020 and H1 FY2021
•       East Coast forward prices temporarily disconnected from JKM due to a temporarily oversupplied domestic market and a tight international market
•       This led to lower volumes and prices on C&I sales and increased supply costs linked to JKM in H2 FY2021 and flowing through into FY2022
•       We expect this to correct from FY2023, with domestic prices more closely reflecting the forward JKM netback given domestic supply outlook
•       JKM exposure largely closed out for FY2022 and gas supply price reviews have now completed with no further reviews until FY2024
•       Long term 50-60PJ of supply is fixed price and positively exposed to a rebound

23           19 August 2021                  2021 Full Year Results Announcement
Transformation of our retail business

           Leading customer                                                                                           Growing future revenue
                                                                  Low-cost retailer                                                                                          Retail X
              experience                                                                                                    streams

                Strategic NPS                                        Retail cost base ($m)                                     Gross profit ($m)
                                                                                                                                                                    75%                          >850k
                                                                                          ~$200-250m                                                        Customer happiness index            accounts
                                                                                                               140                          83% growth
                                                     800
                                                                                                                                                                                      250k
                                           6                                                                    120                                                                 accounts
                                2                    600                                                       100                                                        >100k
                                                                                                                                                                         accounts
                                                                                                                80
                                                     400
                                                                   $110m achieved                               60                                            MVP 50k
                                                                                                                                                              accounts
                                                     200                                                        40
                  (6)
                                                                                                                20                                                             On track to migrate all
                                                                                                                                                                               customers by 2H 2022
                                                        -                                                         -
    (13)
    FY18        FY19        FY20        FY21                     FY18            FY21       FY24                        FY18     FY19    FY20      FY21                                          Dec-21
                                                                                                                                                              Dec-20     Apr-21     Jun-21
                                                                                            Target                                                                                               target
                                                       Total                      Retail capex                        Community Energy Services     Solar
                                                       Other addressable opex     Leases
                                                       Cost to serve

•        Improving customer experience - Rated 4.5 stars on TrustPilot, with more 5 stars than any other energy Tier 1 retailer in Australia
•        Delivering a material reduction in our cost base (targeting further $100-$150 million1 by FY2024)
•        Earnings growth from solar and CES, and growing our VPP with >159MW and >79k connected services
•        Implementing next-gen retail business (Retail X) designed to embed Octopus’ operating model, tech platform and distinctive culture

    1)     From FY2018 baseline: ~1/3rd capex (some saving achieved already); ~2/3rd opex (savings expected over FY2023-24)

    24         19 August 2021              2021 Full Year Results Announcement
Strong customer loyalty and growing scale

                        Customer churn (monthly %)                                                Customer accounts (‘000)

                                                                                   4,181               4,200           4,236              4,266
 30%                                                                       4,300
                                                                                                                        20                 33
                                                                                                          8
 25%                                                                                                                    365                359
                                                                           4,000    370                  362

 20%
                                                                           3,700
     15%
                                                                           3,400
 10%
                                                                                   3,811                3,830          3,851              3,874
                                                                           3,100
     5%

       -                                                                   2,800
            Jul

            Jul

            Jul
           Mar
           May

           Mar
           May
            Jul

           Mar
           May

           Mar
           May
           Sep

           Sep

           Sep

           Sep
           Nov
           Jan

           Nov
           Jan

           Nov
           Jan

           Nov
           Jan
                                                                           2,500
                                                                                   FY18                 FY19           FY20               FY21
                FY18           FY19                FY20             FY21
                                                                                           Electricity and gas   LPG          Broadband
                             Origin                Market

 •    Origin churn 4.8% lower than market at 12.5% for FY2021
 •    Optimising customer value through products and channels, continuing to reduce cost to serve and competing to grow share
      in a competitive environment

 25        19 August 2021     2021 Full Year Results Announcement
Our digital capability is a competitive strength

  Extending our leadership in technology to drive premium customer experience at low cost

      Technology enhancements                   New products and services           Partnerships & Alliances          Origin’s platform-based model

                 159 MW VPP                  Gamified demand                                                      Customer first, data driven proven technology
              developed in-house                                  Origin 360 EV
                                                response                               20% investment in global
                                                                                       energy and tech business

                                                                                                                           Unique operating model

                 Cloud-based                   Origin Internet    Connected Home
                 applications

                                                                                                                     Orchestration optimising customer and
                                                                                                                                wholesale value

               Data & analytics                                    Usage insights
                                                 Low carbon
                 capability                                        and control
                                                                                                                        Empowered digital engagement

 26      19 August 2021     2021 Full Year Results Announcement
20% stake in Octopus, a global renewable energy, services & technology business

        Exponential customer growth                                           Outstanding performance            Global reach increasing

              Customer accounts (‘000, LHS)                                    % customer churn after one year
              and revenue growth (£bn, RHS)                          30%

                              TG 9.7%
                                                                     25%
 10,000                       investment             2,500

 8,000                Origin 20%                     2,000           20%
                      investment
 6,000                                               1,500
                                                                     15%
 4,000                                               1,000
                                                                                  25%
 2,000                                               500             10%

        -                                            -
                                                                         5%                           9%
            Jun-17 Jun-18 Jun-19 Jun-20 Jun-21

                                                                          -
            Licensed Kraken customer accounts migrated
                                                                              Ofgem Average     Octopus Energy
            Octopus Energy customer accounts
            FY revenue

  •     Present in 7 countries and actively targeting international markets
            – Partnership with Tokyo Gas in Jan-21, represents material uplift in valuation since our initial investment
  •     £3.4 billion renewable energy assets under management as a result of Octopus Renewables acquisition in Jul-21
  •     4.2 million energy customer accounts across UK, US, Germany (7.5% UK market share)
  •     4.7 million licensed customer accounts, ~£250 million licensing revenue over next 3 years
  •     Targeting 100 million customer accounts on Kraken by 2027
   27        19 August 2021        2021 Full Year Results Announcement
Integrated Gas

28   19 August 2021   2021 Full Year Results Announcement
APLNG reserves and production continued to perform at or above expectations

               APLNG 100% 2P reserves movements in FY2021 (PJ)
     11,381
                                                                                                           11,339
                                                                   (163)
                                                                                         95                                       •    94% APLNG 2P reserves replacement during
                                                                                                                                       FY2021 (operated and non-operated)

                                               564
                                                                                                                                  •    Operated 2P reserves replacement ~105%
                         (537)
                                                                                                                                       during FY2021 (~90% since Jun-17)
                                                                                                                                       − Strong operated field performance resulting
                                                                                                                                         in an increase in estimated recovery
                                                                                                                                       − Maturation of resources to reserves through
                                                                                                                                         successful appraisal
                                                                                                                                  •    Reserve base significantly de-risked: 1P now
     Jun-20            Operated             Operated         Non-operated         Non-operated             Jun-21                      ~60% of 3P
                      production             reserve          production             reserve
                                          replacement                             replacement
                                                                                                                                  •    2P reserve life of 16 years as at 30 June 2021,
 Reserves1, 2                                                 Revisions/
classification
                    30/06/2020           Acquisitions
                                                              extensions
                                                                                  Production         30/06/2021                        based on FY2021 annual production of 701 PJ
      1P                 7,384                  -                 665                 (701)              7,348
      2P                 11,381                 -                 658                 (701)              11,339
      3P                12,071                  -                 834                 (701)              12,204
      2C                3,980                   -                (378)                  -                3,602

1)    Reserves are 100% APLNG as reported in Origin’s FY2021 Reserves Report released to the ASX on 19 August 2021
2)    Some of APLNG’s CSG reserves and resources are subject to reversionary rights and ongoing interest in favour of Tri Star. Refer to Section 7 of the Operating and Financial Review released to the ASX on
      19 August 2021 for further information
29        19 August 2021             2021 Full Year Results Announcement
Strong field performance and resource maturation resulted in improved reserves

                                     Higher estimated ultimate recovery                                                    Maturation of resources to reserves
                                       Indicative life of field production: Talinga and Orana

                                                                                                                                                                 Peat Flank
 Cumulative production (PJ)

                                                                                                                     Spring
                                                                                                                      Gully
                                                                                                                    North East
                                                                                                                      Flank

                                                                                                                                                                 Ramyard South
                                    FY2021
                                                               ~35 years

                              Actuals / current estimate       Estimate at FID          Actuals / FY2020 estimate

 •                            Talinga/Orana fields exhibit strong production, higher                                •   New areas matured from appraisal to development in
                              estimated ultimate recovery and reduced near term costs                                   recent years
                                                                                                                        − Peat Flank
 •                            Near term production acceleration via pipeline                                            − Ramyard South
                              infrastructure optimisation                                                               − Spring Gully North East Flank
30                               19 August 2021        2021 Full Year Results Announcement
APLNG sustained strong production with record low costs in FY2021

         Quality resource and assets                                                             Record low cost                                              Breakeven
                 APLNG Production (100%) (PJ)                                   A$m           APLNG Capex + Opex (100%)1        A$/GJ                 Distribution Breakeven 2 ($US/bbl)
800                                                                            3,000                                             4.5          80

700                                                                                                                                           70
                                                                               2,500
                                                                                                                                 4.0
600                                                                                                                                           60
                                                                               2,000
500                                                                                                                              3.5          50

400                                                                             1,500                                                         40
                                                                                                                                 3.0          30
300
                                                                                1,000
200                                                                                                                                           20
                                                                                                                                 2.5
                                                                                  500
100                                                                                                                                           10

     -                                                                                 -                                         2.0           -
                 FY19               FY20                FY21                                    FY19           FY20      FY21                          FY19              FY20          FY21

          Operated production        Non-operated production                           Breakeven opex excl. purchases   Capex    $/GJ (RHS)           Distribution breakeven     Realised oil price

          Stable production underpinned                                                 Reduced activity and costs enabled                         Record low distribution breakeven
          by strong field performance                                                   by strong field performance                                provides resilience to low oil price

          Daily operated record of                                                      Record low cost at A$2.81/GJ, 19%                          Recent high oil prices expected to
          1,614 TJ/day achieved twice                                                   improvement vs FY2020                                      improve revenue in FY2022

1)        Opex excludes purchases and reflects royalties at the breakeven oil price.
2)        FY2021 AUD/USD rate 0.75 (FY2020: 0.67, FY2019: 0.70)
31            19 August 2021             2021 Full Year Results Announcement
APLNG operational performance continued to improve

             Reduced activity and costs                                                 Flexibility to adapt to market                        Outstanding facility reliability
                        Well activity (# of wells)                                            APLNG (100%) average production (TJ/day)            Gas Processing Facility Reliability 1

    300                                                                               2,100     Production    Qtly record    Managing
                                                                                                 flexibilty     182 PJ      maintenance

    250           266                  267 260                                    2,000
                         251
    200                                                                           1,900

    150                                                                               1,800                                                                                       99.6%
                                                            141                                                                                                  99.5%
    100                                                                               1,700

                                                                  86
     50                                                                               1,600                                                     98.9%

         -                                                                            1,500
                     FY19                FY20                FY21                                                                                FY19            FY20              FY21
                        Commissioned              Drilled

•    Lower development costs in FY2021:                                           •     Strong field capability enables flexibility:      •   Continuous improvement in facility
                                                                                                                                              reliability through operational
     − 67% reduction in wells drilled with                                              − Production curtailed in Q1 in
                                                                                                                                              enhancements
       fewer rigs                                                                         response to lower demand
     − 47% reduction in wells commissioned                                              − Ramp up to record levels as market              •   Majority of facilities producing above
                                                                                          demand increased                                    design targets

                                                                                        − Production managed within
    1)       Upstream operated electrified facilities
                                                                                          maintenance schedules
    32           19 August 2021             2021 Full Year Results Announcement
Maximise value of the existing business

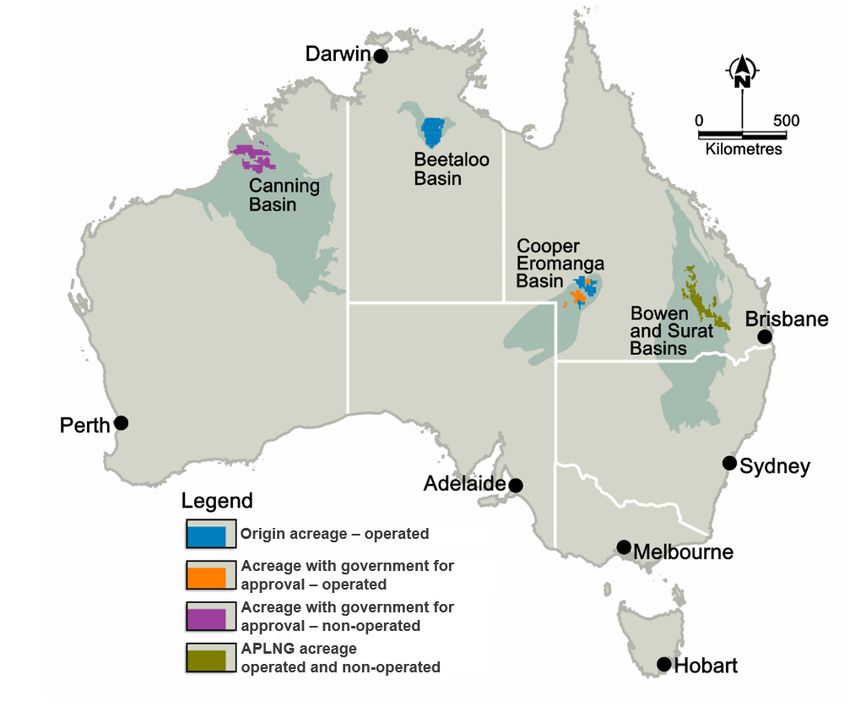
                          APLNG                                                               Prospective acreage

Continued strong upstream performance                                               Beetaloo Basin

 • Strong field performance enabling reduced                                        •   Kyalla 117 flowed liquids-rich gas to surface with
   development activity medium term                                                     unassisted gas flow rates of 0.6–0.9 TJ/d
                                                                                    •   Preparing for extended production test.
 • Targeting average total capex + opex¹                                                Operations paused in July to investigate
Strategy and
                                                            Outlook
                                                            Frank Calabria, CEO

34   19 August 2021   2021 Full Year Results Announcement
Key commodity markets rebounding but the benefit will be lagged

                             Oil price                                            LNG netback and domestic gas prices                                                                                                                                                    NSW electricity forward price
80                           (US$/bbl)                                                         (A$/GJ)                                                                                                                                                                           ($/MWh)
                                                                   25                                                                                                                                                                               100

70
                                                                   20                                                                                                                                                                               80
60
                                                                    15                                                                                                                                                                              60
50

                                                                   10                                                                                                                                                                               40
40

30                                                                   5                                                                                                                                                                              20

20                                                                  -                                                                                                                                                                                -
                                                                                                                                                                                                                                                          Jul-19    Oct-19 Jan-20 Apr-20 Jul-20 Oct-20 Jan-21 Apr-21   Jul-21

                                                                                                                                                 Jul-20
                                                                                                                                                          Oct-20

                                                                                                                                                                                     Jul-21
                                                                                                                                                                                              Oct-21

                                                                                                                                                                                                                         Jul-22
                                                                                                                                                                                                                                  Oct-22
                                                                                                    Apr-19
                                                                         Jul-18
                                                                                  Oct-18

                                                                                                             Jul-19
                                                                                                                      Oct-19
                                                                                                                               Jan-20

                                                                                                                                                                   Jan-21

                                                                                                                                                                                                       Jan-22

                                                                                                                                                                                                                                           Jan-23
                                                                                           Jan-19

                                                                                                                                        Apr-20

                                                                                                                                                                            Apr-21

                                                                                                                                                                                                                Apr-22
                                                                                                                                                                                                                                                                    FY21 Swap             FY21 Avg              FY22 Swap
               Realised oil price (FY)                   JCC                                        JKM netback price - Wallumbilla (ACCC)
                                                                                                                                                                                                                                                                    FY22 Avg              FY23 Swap             FY23 Avg
               Brent forward price 1                     Brent                                      Wallumbilla spot price
     Source: Petroleum Association of Japan, Refinitiv                   Source: ACCC, AEMO
                                                                                                                                                                                                                                                           Source: AEMO/Bloomberg

 •      Recent higher prices will                                        •         Majority of APLNG domestic sales are                                                                                                                                    •       Headwinds in FY2022 as ~$20/MWh
        predominantly flow through into                                            under long term contracts                                                                                                                                                       drop flow through into customer tariffs
        FY2022                                                           •         Energy Markets gas margin impacted                                                                                                                                      •       Margins expected to rebound in
 •      APLNG’s low cost structure                                                 by timing of tariff repricing compared                                                                                                                                          FY2023 provided current forward
        underpins robust returns during low                                        to supply costs                                                                                                                                                                 electricity prices continue and flow
        oil price environment                                            •         East coast domestic customer prices                                                                                                                                             through into customer tariffs
                                                                                   and JKM index expected to reconnect
1)      Based on forward prices as at 13 August 2021
35          19 August 2021             2021 Full Year Results Announcement
Our strategic priorities are clear

                         Maximising value of the                                           Pursuing growth in customer value
1                                                                                 2
                          existing businesses                                                  and low carbon solutions

 • Disciplined capital and cost management – Low cost                             • Growing integrated customer solutions
   operator, reducing capital, operating and finance costs
                                                                                      − Grow customer scale and breadth of offerings via low cost
                                                                                        platform model delivering connected customer solutions
 • Retail transformation to differentiate on both customer
   experience and cost                                                                − 20% investment in Octopus Energy - targeting 100 million
                                                                                        accounts globally by 2027
 • Managing commodity price risk with portfolio of
   contractual and physical positions well placed for energy
                                                                                  • Accelerating renewables and clean energy
   transition
                                                                                      − Potential to partner with government and others on
 • Delivering value from APLNG - Targeting average total                                renewables and battery investments
   capex + opex¹
Connecting customers to the energy and technologies of the future

 Market leading assets & capabilities                       Preferred position for energy transition
  Large domestic retail customer base                       Low-cost, digital-first retailer
  Leading energy wholesale & trading capability             Short energy, covered for peak demand
  Largest Australian CSG to LNG project                     Capabilities to lead in renewable fuels
  Low cost operator

 Robust capital framework                                   Strategic focus

  Strong, diversified cash generation                       Maximise value through the transition
  Reducing opex and capex                                   Grow integrated customer solutions
  Moderate near term capex requirement                      Accelerate renewables and clean energy
  15% FCF yield (FY2021)

37   19 August 2021   2021 Full Year Results Announcement
FY2022 Guidance

 Provided on the basis that market conditions and the regulatory environment do not materially change, adversely
 impacting operations. Considerable uncertainty exists relating to potential ongoing impacts of COVID-19 and this
 guidance is subject to any further material impact on demand and customer affordability.

                                                                                                                                      FY21                     FY22 guidance

     Origin Energy – Underlying EBITDA1                                                                                             2,048                           1,850-2,150
     Energy Markets Underlying EBITDA                                                             A$m                                   991                              450-600
     Integrated Gas & Corporate Underlying EBITDA                                                 A$m                                1,057                           1,400-1,550
     Origin Energy – Capex and Investments
     Capex (excluding investments)                                                                A$m                                (339)                              (370-410)
     Investments2                                                                                 A$m                                 (161)                             (210-220)
     Integrated Gas - APLNG 100%
     Production                                                                                   PJ                                    701                                685-710
     Capex and opex, excluding purchases3                                                         A$b                                    2.0                                 2.1-2.3
     Unit capex + opex, excluding purchases3                                                      A$/GJ                                  2.8                                3.0-3.4
     Distribution      breakeven4                                                                 US$/boe                                 22                                  20-25

1)    Assumes realised oil price of US$68/bbl and AUD/USD rate of 0.75 and includes Energy Markets, Share of APLNG, Integrated Gas – Other costs (hedging, trading and other opex) and Corporate costs
2)    FY2022 investments includes ~$135 million (£70 million) consideration, for the 20% in Octopus Energy, brought forward from FY2023 due to a 6 month lagged average Brent price of >US$50/bbl from August 2021
3)    Opex excludes purchases and reflects royalties at the breakeven oil price.
4)    FY2022 AUD/USD rate 0.75 (FY2021: 0.75)
38        19 August 2021           2021 Full Year Results Announcement
Guidance continued

               Origin - consolidated                                                                          Energy Markets                                                                 Integrated Gas (APLNG)
•        Underlying FY2022 EBITDA relatively stable                                       •    Lower FY2022 Underlying EBITDA:                                                     •     FY2022
         - increased earnings in Integrated Gas largely                                        −     Electricity reduction of $400-$480                                                  −    Continued stable production
         offset headwinds in Energy Markets                                                          million: lower wholesale electricity prices,                                             underpinned by strong field performance
•        Assumes realised oil price of US$68/bbl and                                                 higher generation fuel costs and lower
                                                                                                     usage, partially offset by wholesale cost                                           −    Higher costs associated with increased
         AUD/USD rate of 0.75                                                                                                                                                                 activity - planned downstream
                                                                                                     savings
•        ~50% of APLNG’s FY2022 oil exposure                                                                                                                                                  maintenance, higher non-operated
         priced at US$68/bbl based on long-term                                                −     Gas reduction of up to $50 million: higher                                               development and infrastructure spend,
         LNG contract lags, as at 28 July 2021                                                       procurement costs and lower C&I sales,                                                   increased workover and E&A activity, and
                                                                                                     partially offset by repricing retail tariffs                                             higher power costs
•        +/-$US10/bbl for remaining 50% oil exposure                                           −     Cost to serve expected to be stable:                                                −    Breakeven primarily reflects increased
         estimated to impact Origin Underlying                                                       Kraken savings weighted to FY2023-24                                                     activity costs, offset by higher non-oil
         EBITDA by +/-~$A120million, net of hedging.                                                                                                                                          linked revenue
                                                                                          •    FY2023 Underlying EBITDA expected to
•        Capex estimate of $370-410 million includes                                           rebound by an estimated $150-$250 million2                                                −    Continue to target average total capex +
         $75–$85 million E&A spend                                                             to $600-$850 million, assuming current                                                         opex3 US$50/bbl from August 2021.
    2)      Based on current forward prices for key commodities such as electricity, coal and oil. Assuming JKM prices reduce by US$2-US$3/mmbtu from current forward prices, and assuming no material change in sales volumes and other costs.
    3)      Opex excludes purchases and reflects royalties at the breakeven oil price.
    4)      Assuming an average AUD/USD rate of 0.75 and assuming all APLNG debt serviceability tests are met. Origin hedges losses estimated to be $134 million based on the same assumptions. As at 28 July 2021, ~31 mmboe (or 50%) of APLNG’s
            FY2022 oil price exposure priced at ~US$68/bbl before hedging.
    39          19 August 2021                2021 Full Year Results Announcement
Questions

40   19 August 2021   2021 Full Year Results Announcement
Appendix

41   19 August 2021   2021 Full Year Results Announcement
Items excluded from Underlying Profit

                                                                                                 Non-cash charges (previously announced)
             Reconciliation from Statutory to Underlying Profit ($m)
                                                                                                 •   $1.6 billion post-tax impairment of goodwill and generation
                                                                            28         318           assets due to lower wholesale prices and higher gas supply
                                                    (123)
                                                                259                                  costs
                                         198
                                                                                                 •   $0.7 billion deferred tax liability, reflecting the expectation of
                           669
                                                                                                     future distributions from APLNG
                                                                                                 Other items
 (2,291)
                                                                                                 •   $198 million relating to a decision to defer ~4.1 million 2020
               1,578                                                                                 and 2021 large-scale generation certificates (LGCs). $112
                                                                                                     million recognised in H1 FY2021
                                                                                                 •   $123 million benefit, primarily Cameron LNG onerous provision
 Statutory   Impairment Deferred tax     LGC        Onerous  Fair value Restructure Underlying       – reflecting stronger near term LNG prices and higher US
   Profit                 liability    surrender   provision  and FX        and
                                                   movement movements transaction
                                                                                      Profit
                                                                                                       interest rates.
                                                                           costs
                                                                                                     – realised $28 million loss on Cameron LNG contract for
                                                                                                       FY2021 is included in Underlying Profit
                                                                                                 •   Non-cash fair value / FX changes in financial instruments
                                                                                                     valuation

42      19 August 2021           2021 Full Year Results Announcement
Large-scale Generation Certificates (LGC) strategy

                                                                                                    LGC Adjustments to statutory profit
                                                                             Statutory    Reversal of shortfall   Estimated CY20     Estimated CY21    Underlying
                                                                                 Profit     charge/ (refund)        surrender cost    surrender cost       Profit
                                                                                  ($m)                   ($m)                ($m)              ($m)         ($m)
     FY2021 impact: CY2020 and CY2021 certificate shortfall

     Shortfall charge $262m (~4.1m certificates x $65)*
     CY2020 expected surrender cost $46m (~2.5m certificates x $19)              (262)                    262                (46)               (18)         (64)
     CY2021 expected surrender cost $18m (~1.6m certificates x $12)
     FY2022 impact: Remaining CY2021 certificate shortfall
     Shortfall charge $102m (~1.6 million certificates x $65)*
                                                                                 (102)                     102                                  (18)         (18)
     CY2021 expected surrender cost $18m (~1.6 million certificates x $12)

     FY2024 impact: CY2020 certificate surrender and shortfall refund

     CY2020 Surrender $46m (~2.5 million certificates x $19)*
                                                                                   114                   (160)                 46                               -
     CY2020 Shortfall refund $160m (~2.5 million certificates x $65)*

     FY2025 impact: CY2021 certificate surrender and shortfall refund

     CY2021 Surrender $36m (~3.1 million certificates x $12)*
                                                                                   168                  (204)                                    36             -
     CY2021 Shortfall refund $204m (~3.1 million certificates x $65)*
     Total cost of ~5.6 million certificates                                      (82)                        -                  -                 -         (82)
     * Recognised in Statutory Profit

 •   LGC forward curve in backwardation with the Renewable Energy Target met and further renewable supply coming online
 •   Opportunity to lower LGC costs by deferring surrender – refundable shortfall charge of $65/certificate if surrendered within 3 years
 •   Deferred surrender of ~2.5 million CY2020 certificates and expect to defer ~3.1 million CY2021 certificates (50% accrued in FY2021)
 •   Weighted average future cost of certificates recognised in Underlying Profit based on current forward prices and purchases to date
 •   Future surrender cost will be reassessed each reporting period
 •   Refund currently tax assessable, however legislative change is before Parliament which would make refunds non-assessable (aligned to
     treatment of the shortfall charge)
43      19 August 2021         2021 Full Year Results Announcement
Electricity forward price by state (A$/MWh)

100                                          NSW                                                   100                                          QLD

80                                                                                                 80

60                                                                                                 60

40                                                                                                 40

20                                                                                                 20

 -                                                                                                  -
      Jul-19   Oct-19    Jan-20    Apr-20     Jul-20    Oct-20      Jan-21     Apr-21    Jul-21         Jul-19       Oct-19   Jan-20   Apr-20   Jul-20   Oct-20   Jan-21   Apr-21   Jul-21

100                                            VIC                                                 100                                           SA

 80                                                                                                 80

 60                                                                                                 60

 40                                                                                                 40

 20                                                                                                 20

  -                                                                                                     -
      Jul-19   Oct-19     Jan-20    Apr-20     Jul-20     Oct-20     Jan-21     Apr-21    Jul-21            Jul-19   Oct-19   Jan-20   Apr-20   Jul-20   Oct-20   Jan-21   Apr-21   Jul-21

        Source: AEMO/Bloomberg as at 16 August 2021

         44       19 August 2021         2021 Full Year Results Announcement
Energy Markets contracted gas supply

                            Energy Markets contracted gas (PJ)

     250

     200
                                                                                                  •   Oil/JKM linked supply largely offset
                                                                                                      by oil/JKM linked sales and hedging
     150                                                                                          •   Next contract price review in
                                                                                                      FY2024
                                                                                                  •   Contracted demand shown is net of
     100                                                                                              gas directed to generation

      50

       -
        FY21                FY22                      FY23        FY24                  FY25

            APLNG legacy contract              Fixed Price               Price review/market
            Oil-linked                         JKM-linked                Short-term (at market)
            Contracted Demand

45         19 August 2021   2021 Full Year Results Announcement
Reducing interest cost through on-going debt refinancing

                Interest paid ($m) and average interest rate

500                                                                                8%
400                                                                                6%
300
                                                                                   4%
200
                                                                                        •   Average FY2021 interest rate of 4.3%, down from 4.8%
100                                                                                2%
                                                                                        •   More than 36 months committed and undrawn liquidity
     -                                                                             0%
             FY18            FY19          FY20            FY21         FY22            •   Planned repayment of FY2022 capital market debt
                                                                      estimate              maturities with undrawn bank debt are expected to
                Net interest paid (LHS)              Average interest rate (RHS)            further reduce interest cost
2.0         Debt maturity profile - excluding lease liabilities                         •   Estimated FY2022 interest expense saving $40-60
                                 (A$b)                                                      million
 1.5

 1.0

0.5

     -
         FY22     FY23     FY24     FY25    FY26      FY27     FY28   FY29 FY30+

                          Loans and Bank Guarantees - Undrawn
                          Loans and Bank Guarantees - Drawn
                          Capital Markets Debt & Term Loan
46       19 August 2021         2021 Full Year Results Announcement
Capex summary

                                          Origin capex ($m)
 600
                                                                                              FY2021 capex
                                                                                              •   Generation maintenance and sustaining capital
 500
                                                                                                  ($63 million) includes major overhauls at Eraring
                                                                                                  power station, ash dam and Shoalhaven power
 400
                                                                                                  station
                                                                                              •   Other sustaining capital ($136 million) includes
                                                                                                  ERP replacement, regulatory market reforms and
 300
                                                                                                  LPG spend
                                                                                              •   Productivity/growth ($94 million) relates
 200                                                                                              primarily to Octopus Energy licencing and other
                                                                                                  Kraken implementation costs, and community
                                                                                                  energy services
     100
                                                                                              •   Exploration and appraisal ($46 million) primarily
                                                                                                  relates to Beetaloo appraisal
      -
                    FY19                FY20                        FY21      FY22 Guidance
                                                                                mid-point

               Generation sustain      Other sustain          Productivity/growth   E&A

47         19 August 2021     2021 Full Year Results Announcement
Customer movements

                                                                                                                               Electricity ('000)
(‘000)                                         FY21                  FY20    Change
                                                                                        10
Electricity                                                                                 5
  Business                                        30                   29          1    -
  Retail – Residential                        2,246                  2,261      (15)    (5)

  Retail – SME                                   259                  264       (5)    (10)

  Retail – Community Energy Services              90                   77        13    (15)

Total                                         2,625                  2,631      (6)    (20)
                                                                                       (25)
                                                                                                           NSW                   QLD                 VIC                    SA
(‘000)                                         FY21                  FY20    Change
                                                                                            Retail - residential       Retail - SME    Retail - Community Energy Services        Business

Gas
                                                                                                                                      Gas ('000)
  Business                                          1                    1      (0)
                                                                                        10
  Retail – Residential                          972                   958        14
  Retail – SME                                    85                   80         5
                                                                                         5
  Retail – Community Energy Services             191                  180        10
Total                                         1,249                  1,220      29
                                                                                        -

                                                                                        (5)
                                                                                                           NSW                   QLD                  VIC                    SA
   48         19 August 2021   2021 Full Year Results Announcement                              Retail - residential   Retail - SME     Retail - Community Energy Services        Business
APLNG sales mix and legacy domestic contracts

 Legacy domestic contracts:
                                                                                            FY2021      FY2020
 •   ~40 PJ p.a. to Origin ending 2034                        Sales mix (100%)
                                                                                          PJ     %     PJ    %
 •   472 PJ over 21 years to Rio Tinto ending 2031
 •   ~16 PJ p.a. to QAL ending 2041                           Contract LNG                450   69%    449   67%
 •   ~25 PJ p.a. to QGC ending 2035, oil linked
                                                              Legacy domestic contracts   101    15%   126   19%

 Contract LNG:                                                Short term domestic         57     9%    61    9%

 •   Flexibility for both the buyer and the seller            Spot LNG                    48     7%    32    5%

     – Sellers maintenance flexibility                        Total                       656          668
     – Buyers Downward Quantity Tolerance option

49     19 August 2021   2021 Full Year Results Announcement
Cost to serve and bad and doubtful debts over time

                                   Cost to serve                                                                                Bad and doubtful debts ($m)
                             (adjusted for COVID-19)
                                                                                                                                                                       1.09%

                                                                                                                                                                         38           0.87%

171              169                                                                                                                        0.74%
                                                                                                                                0.70%                     0.71%        0.73%
                                                                                                                        0.66%
                                1471
                                                136

 117
                   114

                                  96
                                                 89.5                                                                                         83                                       83
                                                                                                                                                           80
                                                                                                                                 72                                      75
                                                                                                                          61

FY18            FY19           FY20            FY21                                     FY24 Target                     FY16    FY17        FY18          FY19         FY20           FY21

     Retail and Business ($m)                                Wholesale ($m)                                                       Impacts of COVID-19

     Corporate services and IT ($m)                          Retail and Business cost                                             Bad and doubtful debts expense
                                                             per customer account ($/cust)                                        Bad and doubtful debts as a percentage of revenue
     Total cost to serve per
     average customer account ($/cust)                                                                                            Incremental impact of COVID-19

1)      Cost to serve per customer adjusted for impacts of COVID-19 ($38 million BDD and $5 million of payment extensions).
50          19 August 2021             2021 Full Year Results Announcement
Segment summary

                                                                 Energy Markets        Integrated Gas       Integrated         Corporate        Total

($m)                                                                                  - Share of APLNG      Gas - Other

                                                                    FY21   FY20           FY21    FY20       FY21    FY20     FY21    FY20      FY21 FY20
Underlying EBITDA                                                    991   1,459          1,145   1,915       (10)   (174)     (78)    (59)    2,048    3,141
Underlying EBIT                                                     432      974           224     614        (36)   (197)     (80)    (62)     540     1,329
Underlying Profit/(Loss)                                            432      974           224     614          71    (23)    (409)   (542)      318    1,023
     Operating cash flow                                           1,018   1,307              -         -     (10)   (109)     (44)   (247)     964      951
     Investing cash flow                                           (418)   (560)              -         -     649    1,414     (12)        8     219     862
     Interest paid                                                     -          -           -         -        -        -   (234)   (310)    (234)    (310)
Free cash flow inc major growth                                     600      747              -         -     638    1,305    (289)   (549)     949 1,503
Exclude major growth spend                                           191     141              -         -        -        -       -        -     191      141
Free cash flow                                                       791    888               -         -     638    1,305    (289)   (549)    1,140 1,644

51       19 August 2021    2021 Full Year Results Announcement
Underlying ROCE – 12 month rolling

                                                                                                         30 June 2021       30 June 2020                  Change
 As at                                                                                                                                      Change ($m)
                                                                                                                 ($m)                ($m)                    (%)
 Capital Employed
 Net Assets                                                                                                         9,815         12,701       (2,886)      (23%)
 Adjusted Net Debt                                                                                                 4,639           5,158          (519)      (10%)
 Net derivative liabilities                                                                                          258             588         (330)      (56%)
 Origin's share of APLNG net debt (project finance less cash)                                                      2,608          3,088          (480)       (16%)
 Capital employed                                                                                                 17,321         21,534        (4,213)      (20%)
 Origin's Underlying EBIT                                                                                            540           1,329         (789)      (59%)
 Origin's equity share of APLNG interest and tax                                                                     333             602         (269)      (45%)
 Adjusted EBIT                                                                                                       873           1,931       (1,056)      (55%)
 Average capital employed - continuing operations                                                                19,427          21,932        (2,505)        (11%)
Underlying ROCE                                                                                                     4.5%            8.8%                    (4.3%)

Energy Markets                                                                                                      4.8%          10.0%1                    (5.2%)

Integrated Gas                                                                                                      4.8%            8.2%                    (3.4%)

 1)   Restated to 10.0% (previously reported as 10.2%) to include Octopus Energy within Energy Markets capital employed
52        19 August 2021           2021 Full Year Results Announcement
Proportionate Free Cash Flow

Free cash flow prepared on the basis of proportionate consolidation of APLNG.
                                                                             Energy Markets              Integrated Gas        Integrated             Corporate           Proportionate Total

($m)                                                                                                   - Share of APLNG        Gas - Other

                                                                                 FY21         FY20          FY21      FY20     FY21          FY20     FY21        FY20        FY21       FY20
Underlying EBITDA                                                                 991        1,459         1,145      1,915     (10)         (174)    (78)         (59)      2,048       3,141
Non-cash items in Underlying EBITDA                                                89          137                3       25      6             11      11           13        109        186
Change in working capital                                                          81        (266)            91          24     (2)           29      (11)          15        159       (198)
Other                                                                           (143)         (23)           (4)           2     (4)           24        3          (1)      (148)          2
(Tax paid) / refund received                                                         -            -               -        -       -             -      31        (215)         31       (215)
Operating cash flow                                                             1,018        1,307         1,235      1,965     (10)        (109)     (44)        (247)      2,199      2,916

Investing cash flow1                                                            (418)        (560)         (169)      (466)    (60)           140     (12)           8       (659)      (878)
Interest paid                                                                        -            -        (106)      (150)        -             -   (234)        (310)      (340)      (460)
Proportionate Free Cash Flow including major growth                              600           747          960       1,349    (70)            31    (289)        (549)      1,201      1,578

Presenting free cash flow on this basis highlights cash generation on an unlevered basis prior to the repayment of APLNG’s
project finance debt which is serviced by APLNG prior to shareholder distributions.

1)   Cash flow from investing activities has been adjusted to remove cash flows between Shareholders and APLNG.

53       19 August 2021           2021 Full Year Results Announcement
Reconciliation of Adjusted Net Debt

                                       Issue    Issue   Hedged                 Hedged
                                                                                             AUD $m             AUD $m             AUD $m
                                      Currency Notional Currency               Notional
                                                        $m                       $m            Jun-21            Jun-21             Jun-21
                                                                                          Interest bearing   Debt & CCIRS FV
                                                                                                                               Adjusted net debt
                                                                                             liabilities2      adjustments
AUD debt                            AUD     826                      AUD         826             809                  -              809
USD Debt left in USD                 USD   1,130                     USD        1,130           1,500               (10)            1,490
EUR debt swapped to AUD              EUR   1,550                     AUD        2,323           2,455              (137)             2,318
Total                                                                                           4,765              (147)            4,617
Lease Liabilities                                                                                463                  -               463
Total (including lease liabilities )                                                            5,228              (147)            5,081
Cash and cash equivalents less operator cash1                                                                                       (442)
Adjusted Net Debt                                                                                                                   4,639

1)   Excludes $30 million cash held on behalf of APLNG as upstream operator.
2)   Includes transaction costs.
54       19 August 2021           2021 Full Year Results Announcement
Energy Markets segment revenue reconciliation

     The table below reconciles the difference between segment revenue and customer revenue disclosed in the
     Electricity, Natural Gas, LPG and Solar & Energy Services tables.

                                                                              FY21                   FY20                   Change                   Change
                                                                              ($m)                    ($m)                      ($m)                       (%)
      Energy Markets segment revenue                                          11,931                 12,887                      (956)                        (7)
      Less pool and other revenue:
           Internal generation                                               (1,323)                 (1,495)                        172                      (11)
           Renewable PPAs1                                                       (10)                    (19)                          8                    (44)
           Other PPAs1                                                             (3)                   (14)                         11                    (77)
           Pool revenue                                                      (1,337)                 (1,527)                        190                     (12)
           Other2                                                                (69)                   (110)                        41                     (38)
      Total customer revenue                                                 10,525                  11,250                      (725)                       (6)

1)    Gross settled PPAs only. Net settled Renewable PPAs for FY2021 amount to $87 million (FY2020: $127 million) and are presented in cost of sales on a net basis. There were no net settled Other PPAs.
2)    Other includes ancillary services, transmission use of system and other items which are partially offset in cost of energy.
55        19 August 2021            2021 Full Year Results Announcement
Financial Instruments and fair value adjustments
                                                                                          Balance Sheet Impact                                       Income Statement Impact
                                                                     Financial                                                                                                                          Post-tax Gain/(loss)
                                                                  asset/(liability)                 Inc/(dec)     Inc/(dec) in                              Gain/(loss)           Pre-tax Gain/(loss)        excluded from
                                                                                                                                 Total inc/(dec)
                                                                                                  in financial       other net                              included in     excluded from Underlying      Underlying Profit
                                                                 30 Jun       30 Jun                                               in net assets
 ($m)                                                                                             instrument            assets                         Underlying Profit                       Profit
                                                                  2021          2020
 Oil and gas derivatives
 Oil and gas hedges - Integrated Gas                               (166)          143                   (309)               70             (239)                     102                        (341)                 (239)
 Oil and gas hedges - Energy Markets                                 185        (216)                     401           (364)                 37                      25                           12                     8
 Other commodity hedges                                               15           (9)                     24             (22)                 2                       3                          (1)                    (1)
                                                                      34         (82)                     116           (316)             (200)                      130                       (330)                  (231)
 Electricity derivatives
 Electricity swaps and options                                     (134)         (227)                     93           (396)             (303)                    (234)                        (69)                   (48)
 Power purchase agreements1                                          (9)            (2)                    (7)             (1)              (8)                       (1)                         (7)                   (5)
 Environmental derivatives                                             9           (13)                    22                -               22                         -                         22                     15
                                                                   (134)        (242)                     108           (397)             (289)                    (235)                        (54)                   (38)
 FX and interest rate derivatives
 Foreign exchange contracts                                         (92)         (174)                     82             (74)                8                         2                          6                       4
 Foreign currency debt hedges                                         92          460                   (368)             372                 4                         -                          4                       3
 Interest rate swaps                                                 (12)         (20)                      8                -                8                         -                          8                       6
                                                                    (12)          266                   (278)             298                20                         2                         18                      13
 Equity derivatives
 Share warrants                                                      1               1                       -               -                 -                        -                          -                      -
 Decrease in fair value of derivatives (financial statements Note A1(a))                                                                                                                       (366)                  (256)
 Other financial assets/liabilities
 MRCPS issued by APLNG                                           1,296          2,109                   (813)             705              (108)                     106                        (214)                 (150)

 Environmental certificates / surrender obligation                (66)        (131)                        65            (691)             (626)                    (642)                         16                      11
 Settlement Residue Distribution Agreement units                    73          60                         13               16               29                        12                         17                       12
 Other investments                                                307          413                      (106)              124               18                         -                         18                      13
 Net loss from financial instruments measured at fair value (financial statements Note A1(a))                                                                                                  (163)                   (114)
 Exchange gain on foreign denominated debt (financial statements Note A1(a))                                                                                                                     159                      111
 Total Fair value and foreign exchange movements (financial statements Note A1(a))                                                                                                             (370)                  (259)

 Reconciliation of net derivative liability to financial statements
 Derivative assets                                                 1,135         1,158
 Derivative liabilities                                          (1,247)       (1,215)
 Net derivative liability                                          (112)          (57)

1)      Power Purchase Agreement relates to one small contract that meets the requirements of fair value accounting. The majority of our PPAs are accounted for as zero value leases.
56          19 August 2021            2021 Full Year Results Announcement
Important notices

Forward looking statements

This presentation contains forward looking statements, including statements of current intention, statements of opinion and predictions as to
possible future events. Such statements are not statements of fact and there can be no certainty of outcome in relation to the matters to which
the statements relate. These forward looking statements involve known and unknown risks, uncertainties, assumptions and other important factors
that could cause the actual outcomes to be materially different from the events or results expressed or implied by such statements. Those risks,
uncertainties, assumptions and other important factors are not all within the control of Origin and cannot be predicted by Origin and include
changes in circumstances or events that may cause objectives to change as well as risks, circumstances and events specific to the industry,
countries and markets in which Origin and its related bodies corporate, joint ventures and associated undertakings operate. They also include
general economic conditions, exchange rates, interest rates, regulatory environments, competitive pressures, selling price, market demand and
conditions in the financial markets which may cause objectives to change or may cause outcomes not to be realised.
None of Origin Energy Limited or any of its respective subsidiaries, affiliates and associated companies (or any of their respective officers,
employees or agents) (the Relevant Persons) makes any representation, assurance or guarantee as to the accuracy or likelihood of fulfilment of
any forward looking statement or any outcomes expressed or implied in any forward looking statements. The forward looking statements in this
presentation reflect views held only at the date of this presentation.
Statements about past performance are not necessarily indicative of future performance.
Except as required by applicable law or the ASX Listing Rules, the Relevant Persons disclaim any obligation or undertaking to publicly update any
forward looking statements, whether as a result of new information or future events.

No offer of securities

This presentation does not constitute investment advice, or an inducement or recommendation to acquire or dispose of any securities in Origin, in
any jurisdiction.

57     19 August 2021    2021 Full Year Results Announcement
Important notices

All figures in this presentation relate to businesses of the Origin Energy Group (Origin, or the Company), being Origin Energy Limited and its
controlled entities, for the reporting period ended 30 June 2021 (the period) compared with the reporting period ended 30 June 2020 (the prior
corresponding period), except where otherwise stated.
Origin’s Financial Statements for the reporting period ended 30 June 2021 are presented in accordance with Australian Accounting Standards.
The Segment results, which are used to measure segment performance, are disclosed in note A1 of the Financial Statements and are disclosed on
a basis consistent with the information provided internally to the Chief Executive Officer. Origin’s Statutory Profit contains a number of items that
when excluded provide a different perspective on the financial and operational performance of the business. Income Statement amounts
presented on an underlying basis such as Underlying Consolidated Profit, are non-IFRS financial measures, and exclude the impact of these items
consistent with the manner in which the Chief Executive Officer reviews the financial and operating performance of the business. Each underlying
measure disclosed has been adjusted to remove the impact of these items on a consistent basis. A reconciliation and description of the items that
contribute to the difference between Statutory Profit and Underlying Consolidated Profit is provided in the Operating and Financial Review.
This presentation also includes certain other non-IFRS financial measures. These non-IFRS financial measures are used internally by management
to assess the performance of Origin’s business and make decisions on allocation of resources. Further information regarding the non-IFRS
financial measures and other key terms used in this presentation are included in the Operating and Financial Review Appendix. Non-IFRS
measures have not been subject to audit or review.
Certain comparative amounts from the prior corresponding period have been re-presented to conform to the current period’s presentation.
A reference to Australia Pacific LNG or APLNG is a reference to Australia Pacific LNG Pty Limited in which Origin holds a 37.5% shareholding. A
reference to Octopus Energy or Octopus is a reference to Octopus Energy Group Limited in which Origin holds a 20% shareholding. Origin’s
shareholding in Australia Pacific LNG and Octopus Energy is equity accounted.
A reference to $ is a reference to Australian dollars unless specifically marked otherwise.
All references to debt are a reference to interest bearing debt only. Individual items and totals are rounded to the nearest appropriate number or
decimal. Some totals may not add due to rounding of individual components. When calculating a percentage change, a positive or negative
percentage change denotes the mathematical movement in the underlying metric, rather than a positive or a detrimental impact. Measures for
which the numbers change from negative to positive, or vice versa, are labelled as not applicable.

58     19 August 2021    2021 Full Year Results Announcement
You can also read