Findings from 2020 research on attitudes and experiences in the domestic and SME electricity and gas markets in Ireland
←
→
Page content transcription
If your browser does not render page correctly, please read the page content below

Findings from 2020 research on attitudes and
experiences in the domestic and SME
electricity and gas markets in Ireland
Prepared by Behaviour & Attitudes Ltd and The Research Perspective Ltd
On behalf of the CRU

Behaviour & Attitudes - Milltown House, Mount St Annes,
Milltown, Dublin 6 / +353 1 205 7500

                                                          i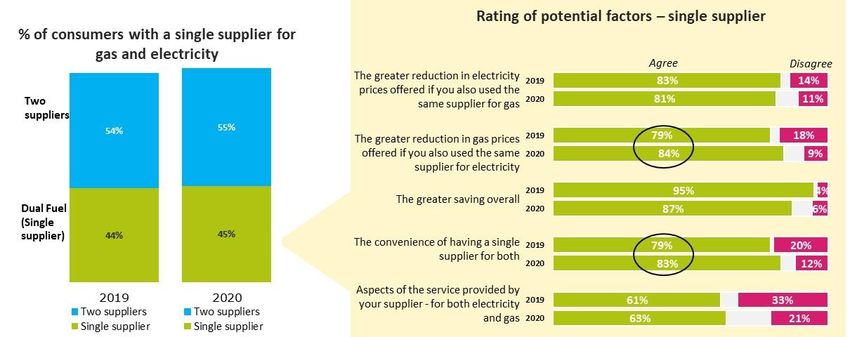
Contents
Contents ............................................................................................................................................ ii
1.     Executive Summary .................................................................................................................... 1
2.     Key Findings ............................................................................................................................... 6
3.     Research background ............................................................................................................... 11
4.     Market background .................................................................................................................. 12
5.     Purpose of the research ........................................................................................................... 12
6.     Data Collection Methodology ................................................................................................... 14
7.     Representative Sample............................................................................................................. 15
8.     Market Satisfaction Profile ....................................................................................................... 16
9.     Bill Delivery, Clarity and Understanding ................................................................................... 21
10.         Response to the bill ............................................................................................................. 24
11.         Clarity of bill estimated or actual status .............................................................................. 26
12.         Bill delivery and rating – SME electricity and gas markets ................................................... 27
13.         Domestic arrears ................................................................................................................. 29
14.         Competition and consumer understanding of market structures ........................................ 33
15.         Understanding and comparing offers .................................................................................. 36
16.         Market Structure and Understanding .................................................................................. 37
17.         Switching and Engagement.................................................................................................. 39
18.         Drivers for switching amongst electricity and gas markets .................................................. 46
19.         Drivers for not switching ..................................................................................................... 48
20.         Overall experience of the switching process ........................................................................ 50
21.         Dual Fuel ............................................................................................................................. 54
22.         Assessment of the sales process .......................................................................................... 57
23.         Awareness of the CRU and Complaint Handling .................................................................. 60
24.         Vulnerable and Priority Customers ...................................................................................... 63
25.         Prepayment ......................................................................................................................... 67
26.         Smart Metering and Renewable Energy .............................................................................. 69
27.         Impact of Covid-19 .............................................................................................................. 79
28.         Conclusion ........................................................................................................................... 85

                                                                           ii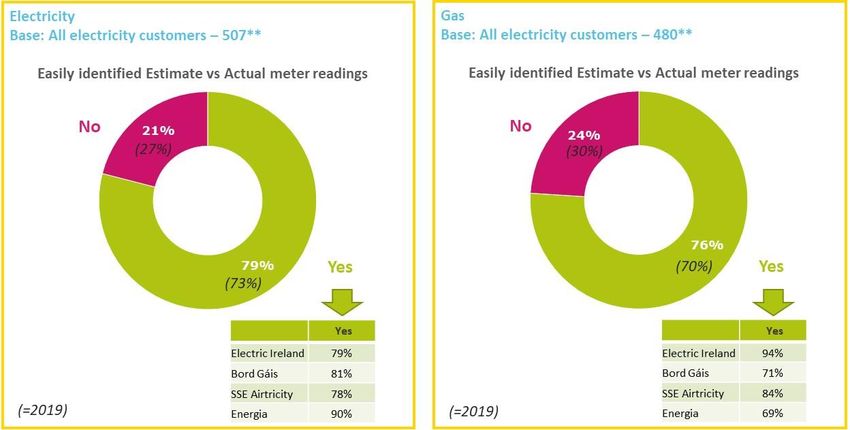
1. Executive Summary
CRU defined its’ mission, vision and values for 2019-2021, together with four Strategic
Priorities to support the core activities of the Commission and to ensure the public interest is
protected. The Strategic Priorities relate to the delivery of sustainable low-carbon solutions
within well regulated markets and networks, to ensure compliance and accountability, to
develop effective communications to support customers and to maintain a high-performing
organisation to support the delivery of the work of the Commission. All of these in
combination seek to ensure public interest is served.

The annual survey into attitudes and experiences in the domestic and SME electricity and gas
markets was commissioned in the context of these and past strategic priorities. The survey is
used by CRU as one source of information to determine if the public interest imperative is
being met through monitoring the degree to which residential and business customers are
satisfied with their suppliers, the services offered and the functioning of the market in terms
of choice and competition. The survey gives CRU an insight into customer experiences and
attitudes within the energy market and both supports the market monitoring activities of CRU
and is used to inform policy discussion, decision, and development.

This research has been in place since 2011 and this report provides insight to the changes
which have occurred for different time windows since then. The 2020 research was conducted
by Behaviour & Attitudes and The Research Perspective under the direction of the CRU. This
survey is designed to ensure continuous annual measurement of customer experience and
attitudes in the residential and SME electricity and gas markets.          Its design ensures
comparability with previous measurements undertaken since 2011 is maintained. Whilst
maintaining comparability is central, it also extends to update certain metrics to take account
of changes in the market and associated attitudes over time. This year presented a particular
challenge because the established methodology of face to face interviewing could not take
place, because of the restrictions associated with the Covid-19 pandemic. Therefore, the data
collection approach changed to comprise a combination of telephone and online panel
interviews. The research in the residential market is based on a nationally representative
sample of households, conducted using a Computer Based Telephone Interview (CATI)
approach and the Acumen Online Panel, to reach over 1,000 respondents, in each of the
electricity and gas markets. The total number of residential customers interviewed was 2,000.

                                                                                               1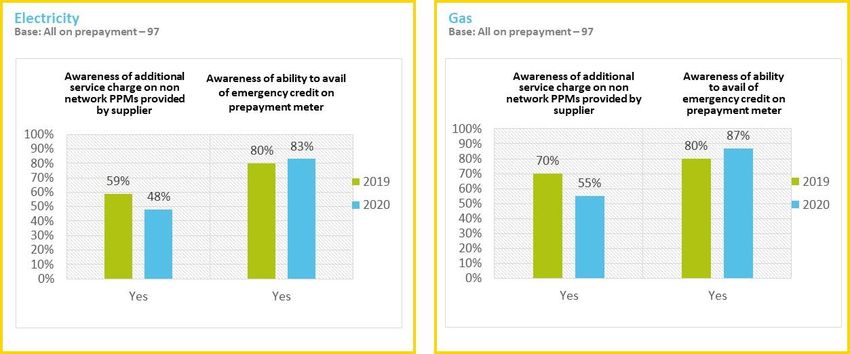
The scope of the research includes the residential and SME electricity and gas markets. As
with previous years measurements, in the case of the residential market, the report is based
on the feedback of a sample of customers who use electricity or gas in their domestic
premises, including those with night saver meters. For both SME electricity and gas markets,
the focus of the research is on enterprises with low to medium consumption, typically meter
point categories DG5 and DG6, with 250 or fewer employees. The SME research was
unaffected by Covid-19 in terms of the data collection methodology, where a Computer Based
Telephone Interview (CATI) approach was used to get responses from 400 SME’s in the
electricity market and 250 in the gas market. Further details are provided in the Section –
Data Collection Methodology.

From a strategic perspective, the survey provides evidence of success for CRU in terms of its
vision and strategic initiatives. With the CRU focus on developing effective communications
to support customers and the regulatory process, there is clear evidence of increased
empowerment in the customer base, with a greater number of customers showing willingness
to leverage available technologies to compare offers. More domestic customers found it easy
to compare offers from electricity (47%) and gas (46%) suppliers. While this score still offers
much scope for improvement, this increased customer confidence is evidenced in enhanced
capability and sophistication when comparing offers. Less customers indicate that they
automatically continue with their current supplier when the contract has expired and there
has been a substantial increase in the numbers who report they look around to see if there is
a better offer available from a different supplier, to whom they can switch. Specifically when
comparing offers, customers report an increasing focus on comparing the unit cost of
electricity/gas, as opposed to just the overall bill amount, which increased from 48% in 2019
to 62% in 2020 for the electricity market. In addition, customers indicate an increased
appetite for more and varied information sources to aid in price comparison, to support
switching, with notable increase in those who report they used supplier websites and
comparison websites to support their research to switch.

Consumers are more willing to explore available options as they approach the end of their
contract, and to be proactive in searching for suitable switching options, as opposed to waiting
to be approached by a supplier. In particular, in the electricity market, the proportion of
contacts who opted to initiate contact to explore options for switching increased from 13% to
22%, and this in combination with the increased use of supplier and comparison websites
points to a more engaged customer base.

                                                                                               2
The increase in confidence is supported by the more informed customer base as evidenced by
the survey, where understanding of the relative roles of CRU, Networks and the suppliers is
continuing to improve. There is increasing understanding of the role of suppliers, particularly
in relation to billing and payment, where there was an increase of 23% among those who
understood that billing payment was not the responsibility of ESB Networks, rather that of
their supplier.

The key outcome from effective communication and empowerment centres on switching
levels. Switching has not yet become a routine or even firmly established behaviour with 44%
of electricity customers and 43% of gas customers indicating they have never switched
supplier. However, there is hope that increased empowerment and customer knowledge may
promote switching behaviour moving forward. The primary dependency for switching is
market awareness and credible alternatives. It is interesting to note that spontaneous
awareness of suppliers has followed a downward trajectory since 2017 and noteworthy
declines are recorded in 2020. Market awareness and knowledge of alternatives is a key
dependency for switching and therefore an area for action from a strategic perspective
remains to leverage increased engagement to improve market awareness to ensure a strong
and dynamic market. This may also include seeking to extend customer engagement beyond
price comparison to include product and service offerings, which will cause consumers to
investigate and explore market options further.

The strategic initiative related to the development of sustainable low carbon solutions
appears to be supported by consumers who are citing an increased acknowledgment of the
role of more environmentally friendly generation in decisions related to switching supplier.
There were increases in the proportion of respondents who agreed they would consider
switching if the prices were the same, but the electricity/gas product was from more
environmentally friendly generation sources. The emphasis on the importance of renewable
energy and Green Sources Product in influencing decision making about suppliers has been
confirmed by consumers where 89% of electricity customers feel it is important to ensure
that our energy is produced from renewable sources (for example wind, solar, hydro). This
represented an increase of 22% from 2019. In addition, 59% agree that a supplier’s ability to
provide ‘Green Source Products’ (energy from renewable sources) influenced their decision
making when choosing a supplier, representing an increase of 6% from 2019.

On the Smart Meters front, the work of CRU appears to be paying dividends, as the numbers
of consumers interested in getting a smart meter to monitor daily usage increased while

                                                                                              3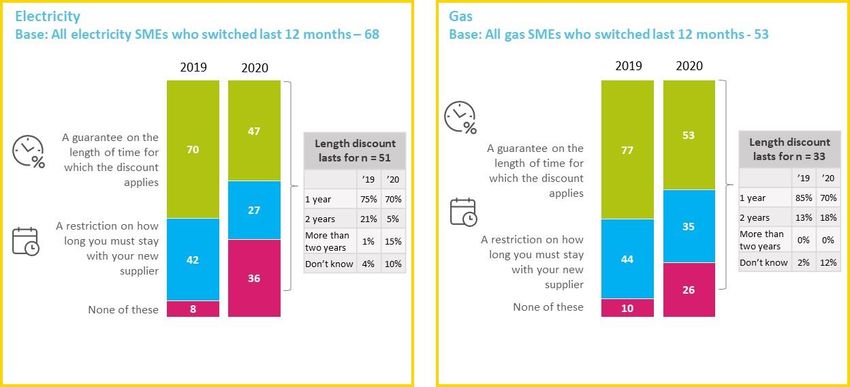
customer willingness to share their energy information with suppliers to avail of new offers
and services increased to 83% from 63% in 2019. Finally, notwithstanding the uncertain times
ahead in terms of financial security, there has been an increase of 14% from 2019 in the
proportion of customers who indicated they had undertaken significant energy efficiency
improvements (external insulation, heating installation of a high efficiency boiler etc.) in their
homes.

Overall customers indicate a decline in total satisfaction across electricity providers at 80% in
2020, which is a decline of 8% from 2019, and satisfaction with gas suppliers declined from
89% to 82%. It should be noted that at least part of this decline is due to the change in
measurement methodology, while another part may be attributable to a more discerning
assessment by customers given their reported increased levels of engagement and
involvement.

In the context of the SME sector, there is some evidence of engagement and empowerment
but not to the extent apparent in the residential sector, but both sectors exhibited similar
outcomes in terms of the constraint of reduced market awareness. Overall satisfaction with
electricity suppliers for SME’s remains steady at 82% and satisfaction with gas supplier has
also remained stable with 2019 levels at 85%.

While SME’s show increased capability in comparing offers, the momentum of previous
improvement is less evident and there is an increased tendency to automatically continue
with the supplier knowing the default tariff will be charged, which went from 3% to 16%.
Evidence of outcomes from the CRU strategic initiatives, which should lead to motivation to
optimise tariffs, explore viable market options and proactively decide on actions at contract
end, are more muted in the SME sector.

The SME market seems more dependent on energy suppliers taking the lead in outbound
contact, but reduced supplier-initiated contact seems to have resulted in reduced switching.
A total of 33% of SME’s reported that they have never switched electricity supplier (+5% from
2019) and 48% have never switched gas supplier (+14% from 2019). Similarly, there is a
reported decline in switching of 8% amongst electricity and gas SME customers, with current
levels of switching in the past 12 months at 17% and 14% respectively. The decline in
switching may be attributable to reported declines in outward contact by suppliers, which
decreased by 23% for electricity and 8% in gas, as reported by the respondents.

                                                                                                 4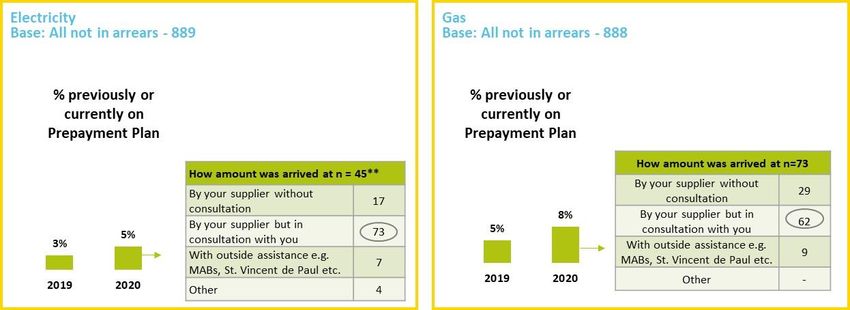
The strategic initiative related to the development of sustainable low carbon solutions
appears to be less compelling for SME’s who cite a reduced percentage importance (-7% from
2019) that our energy is produced from renewable sources (for example wind, solar, hydro)
but more (+6% from 2019) believe that a suppliers ability to provide ‘Green Source Products’
(energy from renewable sources) influence their decision when choosing a supplier. In
addition, there is evidence of more commitment to investment in energy efficiency
improvements.

Although significant external events such as Covid-19 is likely to cause business considerations
other than energy costs and considerations to have taken precedence (temporarily), there is
still evidence of an appetite for understanding costs and becoming more informed through
technologies such as smart meters, where 83% of respondents indicated an interest in viewing
daily electricity usage.

                                                                                               5
2. Key Findings

The key findings from the residential research include:

Context Setting: Market share and satisfaction

    •     The declines in market share experienced by Electric Ireland & Bord Gáis since 2016
          have now settled & both providers continue to hold the lions share of the electricity
          & gas market respectively. Note, market share is based on data provided from CRU.
    •     Energia’s share of the electricity and gas markets continues to gradually increase & it
          now accounts at 11% of the electricity & 9% of the gas market.
    •     Spontaneous awareness of electricity & gas suppliers has been on a downward
          trajectory since 2017.
    •     Satisfaction with energy providers remains high, but declines in satisfaction are
          evident.
              o   80% overall electricity supplier satisfaction (88% in 2019)
              o   82% overall gas supplier satisfaction (89% in 2019)

Billing

    •     Within the electricity & gas market there has been a decline in those who pay when
          they receive the bill, with electricity experiencing an increase in direct debits & gas
          seeing an increase in those on a level pay plan.
    •     Bill understanding has improved on the already high levels recorded in 2019,with
          more customers now claiming to read at least some part of their bill.
    •     Ease of identifying if the bill is an actual reading or estimate has also increased, as has
          the proportion of customers claiming to have submitted their own meter reading in
          the past 12 months.
    •     Prepayment customers also appear to have a greater awareness of billing as there has
          been a noticeable increase in awareness of statements being delivered at least 3 times
          per year.

Priority and Special Services register

    •     Awareness of the Priority Services register among electricity customers has fallen back
          on 2019 levels to 30% from 39%, which is in line with previous years.

                                                                                                    6
•     Awareness of the Special Services register is similar across electricity & gas
         consumers, at 22% and 23% respectively (28% electricity & 22% gas awareness in
         2019).
   •     Incidence of registering for Priority Services & Special Services register remains low -
         mainly due to consumers not knowing it was possible to register.

Offers

   •     Ease of comparing offers has improved slightly on 2019 levels. Nevertheless, just over
         half of all electricity & gas customers still find it difficult to compare offers.
   •     Usage of online comparison websites continues to increase YoY.
   •     47% electricity easy to compare offers
   •     46% gas easy to compare offers

Switching

   •     Switching levels remain similar to 2019 as 16% of electricity & 16% of gas customers
         have switched in the past 12 months (with wanting to save money being the main
         driver).
   •     As in 2019 typical behaviour by both electricity & gas customers is to automatically
         continue with their supplier but there has been an increase in those looking around
         to see if better offers are available.
   •     Across electricity & gas there has been an uplift in the proportion of customers
         initiating the switch, predominantly through the use of supplier websites &
         comparison sites (note there has been a decline in contact from suppliers).
   •     Among those who have switched the ease of switching has been gradually improving
         since 2016 (easy to switch now stands at 97% electricity & 91% gas).

                                                                                                7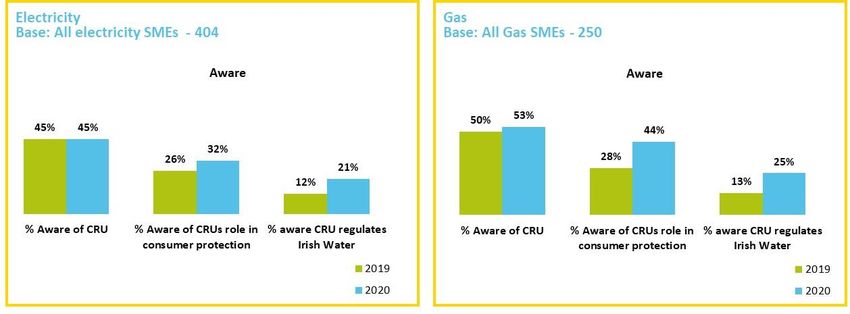
Smart Metering

   •   Interest in Smart Meters has increased on 2019 levels, as 7 in 10 electricity & 4 in 5
       gas customers claim they would be interested in a Smart Meter (mainly for cost saving
       purposes).
   •   Electricity customers willingness to share their energy information with suppliers to
       avail of new offers and services and interest in a Time in Use tariff have also increased
       on 2019 and now stands at 83% and 79% respectively.

Tariffs and Green Energy

   •   Interest in daily energy usage has also increased, as has the importance of renewable
       energy & influence of green sourced products.
   •   Environmental benefits are cited as being an important reason for getting a smart
       meter (26% electricity / 43% gas).
   •   Supplier offering gas at the same price but was more environmentally friendly was
       given as a reason to switch by over 40%.

CRU Awareness

   •   Awareness of the CRU & its role in consumer protection has slipped slightly amongst
       electricity customers but remained steady amongst gas customers.
           o    25% of electricity aware of CRU.
           o    32% of gas aware of CRU.
   •   Awareness of CRU regulation of Irish Water remains low (9% electricity / 7% gas).

Covid-19

   •   12% of electricity & 15% of gas customers claim household ability to pay bills has been
       impacted by Covid-19.
   •   A total of 2 in 5 of all energy users are concerned about increased energy usage and
       impact on bills.

                                                                                               8
The key findings from the SME research include:
Context setting: Market share
• Energia continues to increase its electricity market share (to 36%), while Electric
Ireland declines (31%). Note, market share is based on data provided from CRU
• Bord Gais & SSE Airtricity remain relatively stable in both markets, while Flogas’ share
of the gas market continues a gradual downward trend.
• Overall Satisfaction - Overall satisfaction for the electricity and gas markets remains
high at 82% and 85% respectively.
• While Electric Ireland scored the highest satisfaction level in electricity (85%), Bord
Gais is the only electricity supplier to show an increase (+4% to 84%) from 2019 levels.
• Flogas and Electric Ireland share the highest satisfaction level in gas (87%), Bord Gais
and Electric Ireland increased on 2019 levels.
Competition
• Spontaneous awareness of electricity & gas providers has decreased compared with
2019 scores.
• Understanding of offers has improved across electricity & gas, as has ease of
comparing offers:
o 56% of electricity SME (41% in 2019) claim it is easy to compare offers.
o 63% of gas SME (57% in 2019) claim it is easy to compare offers.
Covid-19
• Over 1 in 3 electricity & gas SMEs claim their organisations ability to pay energy bills
has been impacted by Covid-19.
• 1 in 4 electricity SMEs and 2 in 5 gas SMEs were aware of the Supply Suspension
Scheme and less than 1 in 10 SMEs claimed to have availed of the scheme.
Switching
• Switching of electricity & gas among SMEs has declined on 2019 levels:
o 17% of electricity SME (25% in 2019)
o 14% of gas SME (22% in 2019)
• The level of contact from competitors has continued to decline, as has the proportion
of SMEs who were approached with a tailored offer.
• Overall, the ease of switching remains high, with 9 in 10 ratings it as easy to switch.
9• The impact of switching remains high but there has been a decline in those claiming
that their bill was reduced by the amount expected.
Billing
• Bill understanding remains on par with the high levels recorded in 2019, for both
electricity and gas.
• Understanding of particular bill elements remains high, albeit a slight slippage across
both electricity & gas is evident.
• Understanding of PSO levy (electricity) and SPC (gas) continue to be the most unclear
elements of the bill.
Smart metering
• Interest in viewing daily usage is high:
o 83% of electricity SME
o 88% of gas SME
103. Research background
The fieldwork for each survey was conducted during May-June 2020 (initial interviewing 9-
27th March paused due to Covid-19 restrictions).
The research was undertaken by Behaviour and Attitudes in conjunction with The Research
Perspective.
This research pays particular focus to the:
• Measurement of the domestic retail electricity and gas market in 2020, with
comparable scope to previous research.
• Measurement of the business electricity and gas markets in 2020 with comparable
scope to previous research. The business element included both small and medium-
sized enterprises (SME), defined as those with 250 employees or fewer.
The methodology used for the domestic retail electricity and gas market measurements has
been kept as comparable as possible to provide comparisons with the trended data from
2013-2019. However, due to health restrictions imposed following the outbreak of Covid-19
in Ireland during March 2020, main survey data collection for the residential study was
conducted utilizing a combined CATI telephone and online approach using B&A's online panel,
Acumen.ie. In previous years all main survey residential interviewing was conducted via face
to face interviewing using CAPI machines, in the respondent's own home. As in previous years
there have been changes to question inclusion, order, sequence and format, which is likely to
have had an impact on comparability - where this has arisen, attention has been drawn to it
in the report.
As in 2019 part of the 2020 measurement included a shorter online study element (n=82
electricity and n=43 gas). The objective of this online element was to ensure a broader reach
of vulnerable customers in both the electricity and gas markets. Advertising placement
seeking participation in the online study was included on Instagram and Facebook sites, which
targeted interest groups related to the definition of vulnerable. B&A’s online survey panel
(acumenpanel.ie) was also utilised. In order to qualify for the online survey, respondents
needed to define themselves as having a disability.
The Computer Assisted Telephone Interviewing (CATI) methodology used for the business
research is directly comparable to the methodology used for the business electricity and gas
market measurement in 2019 and prior measurements. Respondents were decision makers
for electricity/gas supply related decisions within the organisation and included both private
11sector and public sector, government organisations and sole traders. Residential and SME
market share data was provided by CRU and a corrective weighting was applied to the data at
data analysis stage to ensure representivity.
Comparisons between the four measurements are presented with the following caveats:
• The two domestic markets are at somewhat different stages of development in terms
of the level of competition and the regulatory framework: prices in the domestic
electricity market have been deregulated for longer than prices in the domestic gas
market;
• The two SME markets are structurally different with electricity universally used by
SME’s, in comparison natural gas which is used by a minority of SME’s.
4. Market background
Price deregulation of the electricity and gas markets occurred between 2005 and 2014 which
allowed suppliers to enter and compete in the market. Since 2005, competition has continued
to develop in all aspects of the market.
The Single Electricity Market (SEM) is the wholesale electricity market for the island of Ireland
and it went live in 2007, with the goals of providing for the least cost source of electricity
generation to meet customer demand across the island of Ireland and maximising long-term
sustainability and reliability.
At present there are a total of 19 suppliers across the different segments of the gas and
electricity markets, serving the domestic and business communities.
5. Purpose of the research
The purpose of this research is:
• To determine the level, quality and benefits of competition in the domestic and
business electricity and natural gas markets as perceived by customers within these
markets;
• To determine the level of switching occurring, drivers or inhibitors impacting the level
of switching and other measures of engagement in the four markets, such as
consumer’s understanding of and ability to compare offers;
• To measure issues such as bill clarity, sales process, the complaints process and
protection of vulnerable customers;
• To assess other issues related to the transition from ex ante to ex post regulation as
they arise;
• To inform CRU generally about consumer behaviour and attitudes as they emerge
within the markets.
12• To examine the impact of Covid-19 on utility usage and consumers ability to pay utility
bills, as well as consumer awareness of various measures put in place to assist
consumers during the pandemic.
The research included the following specific areas:
1. General awareness of and satisfaction with competition and supply companies
providing services in each market;
2. Experience of switching within each market including switching rates, reasons for
switching or not switching and perceived understanding and ability to compare offers;
3. Level of engagement by customers with suppliers as demonstrated by investigation
of alternative tariff packages, changing to alternative tariff packages, changes in
payment methods and changes in billing frequency;
4. Assessment of the sales process and advertising from electricity and gas supply
businesses;
5. Knowledge of pricing, understanding of billing, and interest in and experience of
prepayment;
6. Payment arrears;
7. Understand of the role of supplier;
8. Interest in dual fuel offers (purchasing electricity and natural gas from a single
supplier);
9. Awareness and use of complaint handling procedures and experience of those
procedures;
10. Awareness of the availability of registration as vulnerable customers (defined by a
range of criteria including those who rely on electricity supply for the operation of
medical equipment in the home, the elderly and the disabled).
11. Impact of Covid-19 on utility usage, ability to pay utility bills and awareness of
measures in place to assist consumers during the pandemic.
This report is a summary of the findings of the research and is designed to cover the issues
assessed at a high level. The full research will be released by the CRU in a set of stand-alone
PowerPoint presentations, one covering the domestic electricity and gas markets and a
second report covering the business electricity and gas markets.
136. Data Collection Methodology
The data collection methodology followed best practise methods and processes executed
under internationally recognised quality standards (ESOMAR).
The methodology used for the domestic retail electricity and gas market measurements has
been kept as comparable as possible to provide comparisons with the trended data from
2013-2019. However, due to health restrictions imposed following the outbreak of Covid-19
in Ireland during March 2020, main survey data collection for the residential study was
conducted utilizing a combined CATI telephone and online approach using B&A's online panel,
Acumen.ie. In previous years all main survey residential interviewing was conducted via face
to face interviewing using CAPI machines, in the respondent's own home.
As in previous years, the SME surveys used a Computer Assisted Telephone Interviewing
(CATI) based methodology and were also conducted by Behaviour and Attitudes. Telephone
interviewing is particularly appropriate for business respondents because calls can be easily
scheduled for times when the respondent is available, and it is also flexible enough to allow
rescheduling at short notice at the respondent’s request.
The organisations contacted for interview for the electricity and gas business surveys were
selected at random from validated lists of businesses and public sector organisations with up
to 250 employees. The respondents of the SME electricity survey were distributed across the
Republic of Ireland, while the respondents of the SME gas survey were distributed across the
areas served by the national natural gas network. These populations of potential respondents
included the full range of business categories.
The number of responses achieved with each survey, as shown in figure 1 matched the
number of responses included in previous measurements. The sample sizes were selected to
ensure that the results are statistically robust and reliable.
14Figure A: Number of Respondents in the four market surveys
Sample Size Electricity Natural gas
Domestic 1,020 1,008
SME business 404 250
Research services have been provided annually to CRU by B&A and The Research Perspective since 2011,
with the exception of the 2017 measurement. Services were initially provided by The Research
Perspective and subsequently by a combined team within Behaviour and Attitudes and The Research
Perspective.
7. Representative Sample
As in previous years ensuring a representative sample was fundamental. For the domestic
electricity survey strict interlocking quota controls were placed on both the CATI telephone
and online samples, calculated on age and class targets within gender. Overall, demographic
quota controls were based upon the latest Census / Central Statistics Office population
estimates. For the domestic gas survey, a similar approach was used with respondents being
restricted to those living within areas served by the natural gas supply network and
demographic quotas set in line with previous surveys. At data analysis stage the CATI
telephone and online samples were merged together and a corrective weight was applied to
ensure full representivity of the sample. In the case of the business surveys, the population
from which respondents were randomly drawn was checked to ensure representation across
sub-sectors and other demographic dimensions, both during the survey and upon completion
of the survey.
Post-fieldwork, the respondent sets were validated to ensure a representative sample across
other market specific dimensions such as use of different electricity suppliers or payment
methods. This validated respondent data set was determined to be representative at a
household/business level and representative of the distribution of market share by supplier
in Quarter 4, 2019.
158. Market Satisfaction Profile
Satisfaction with the service provided by suppliers
Respondents were asked to rate their overall satisfaction with the service provided by their
electricity or gas supplier. The focus of this question on respondent’s overall satisfaction is
likely to include assessment across all facets of the supplier-customer relationship, such as
price, tariff, offer etc. In terms of the satisfaction metric, customers continue to express high
levels of satisfaction with their own supplier, albeit satisfaction has declined on 2019 levels. It
should be assumed that at least part of this decline is due to the change in methodology.
Overall satisfaction amongst the online vulnerable customer survey sample is at 72%, while
satisfaction amongst the vulnerable online survey gas sample is at 81%.
16Figure 1: Overall satisfaction with Domestic electricity (left) and gas (right) suppliers
Despite the overall decline on satisfaction levels versus 2019, a high level of customer
assessment is still enjoyed by all suppliers within the electricity and gas markets. Looking
specifically at the electricity market, Electric Ireland and Prepay Power customers now report
the highest level of satisfaction at 82%, albeit Electric Ireland’s customer satisfaction levels
have declined -9%pts since 2019. SSE Airtricity customers report the most significant drop in
satisfaction, dropping -13%pts, followed by Energia (-10%pts), but satisfaction remains high
at 79% and 73% respectively. Prepay Power is the only electricity provider experiencing an
increase in satisfaction this wave moving to 82% from 70% in 2019.
In the gas market, overall satisfaction has also declined vs 2019, falling from a satisfaction rate
of 89% to 82%, with all providers reporting a drop in satisfaction this wave. Energia has
experienced the most significant drop in satisfaction, falling -9%pts. SSE Airtricity now scores
the highest level of satisfaction at 85%, followed by Electric Ireland at 84%.
17Figure 2: Satisfaction amongst domestic customers with the service provided by current
supplier of electricity (left) and gas (right)
Among businesses, overall level of satisfaction with electricity suppliers remains high at 82%,
showing remarkable stability in satisfaction with electricity providers since 2016. With regards
to the SME gas market, overall satisfaction with gas suppliers also remains relatively
unchanged since 2016, at 85%.
18Figure 3: Satisfaction amongst SME business customers with the service provided by
current supplier of electricity (left) and gas (right).
Looking specifically at providers within the electricity SME market, satisfaction with service
has remained relatively stable across suppliers, with the exception of Bord Gais which has
seen an improvement. Looking at the gas SME market however satisfaction with Energia has
fallen back (albeit still high at 78%), while Electric Ireland satisfaction has improved +6%pts.
Satisfaction with Flogas is showing a gradually declining trend.
19Figure 4: Satisfaction amongst SME business customers with the service by current supplier
of gas (left) and electricity (right).
209. Bill Delivery, Clarity and Understanding
The bill is the primary communication to every customer from their electricity or gas supplier,
and as such it is an important channel for understanding energy consumption and associated
pricing.
Some 59% of electricity customers now pay their bills via direct debit, up from 53% in 2019
(higher among Energia and SSE Airtricity), while the incidence of those on level payment plan
and those who use a prepayment meter has remained steady. The increase in direct debits
has reduced the proportion who pay when they receive the bill, which is now at 1 in 5 (down
from 3 in 10).
Within the gas market the incidence of those who pay their bills via direct debit has remained
stable at 3 in 5 (higher among SSE Airtrcity and Energia). As with the electricity market there
has been a decrease in the proportion who pay when they receive the bill (-6%pts), as more
customers are now on a fixed payment plan (+6%pts). As in 2019, 15% use a prepayment credit
meter. Payment methods used by the vulnerable electricity sample are similar to the market,
while the vulnerable gas sample indicates a larger proportion of vulnerable gas customers are
on prepayment (23%).
21Figure 5: Payment methods used by domestic electricity (left) and gas (right) customers
An interesting finding from the surveys is that the incidence of customers receiving their
electricity and gas bills via email continues its upward momentum since 2012 (note answer
code change 2019) , but may be accelerated by the change in data collection methodology, -
Energia and SSE Airtricity customers continue to have the highest proportion receiving their
bill online and the 18-35 age group continue to have the highest percentage of email/online
billing recipients.
22Figure 6: Method of receiving bill among domestic electricity (left) and gas (right) customers
2310. Response to the bill
The vast majority of electricity and gas customers open their bill and read at least some part
of it, with the main focus being on the total bill amount, followed by bill payment date. Only
1 in 3 electricity customers and half of gas customers claim to look at the actual price, as
opposed to the total amount.
Figure 7: Typical Bill Behaviour in electricity (left) and gas (right) customers
Bill understanding has improved upon the already high levels recorded in 2019 across both
electricity and gas. Bill understanding is also high amongst the online sample. On the
electricity side, Energia & Electric Ireland customers claim highest level of agreement with
understanding how the total amount of the bill is calculated and how much energy they have
used, while gas customers with Electric Ireland and SSE Airtricity claim the highest level of
understanding. Those who receive their bill online vs via post report a higher level of
understanding of bill elements across both electricity and gas (the 2019 survey found that post
recipients had a higher understanding of the bill).
24Figure 8: Rating the bill in electricity (left) and gas (right) customers
2511. Clarity of bill estimated or actual status
Consumers were asked if they could easily identify if a bill was based on estimated or an actual
reading. In both the electricity and gas markets the incidence of customers who can easily
identify if their bill is an actual reading or an estimate has increased on the already high levels
reported in 2019 and now stands at almost 4 in 5. Energia electricity customers and gas
customers of Electric Ireland seem to evaluate their bill more positively than customers of
other suppliers, in terms of this metric.
Figure 9: Incidence of submitting own meter reading in electricity (left) and gas (right) customers
When it comes to actually submitting their own meter reading, circa 50% of electricity and gas
customers have submitted their own meter reading in the past 12 months, an increase on
2019 levels. As in 2019 this is higher among Energia customers & SSE Airtricity across both
electricity and gas.
26Figure 10: Incidence of submitting own meter reading in electricity (left) and gas (right)
customers
12. Bill delivery and rating – SME electricity and gas markets
Businesses were also asked how frequently they receive their bills. Electricity SME’s continued
to be predominantly billed for their electricity usage on a bi monthly basis, while 2 in 5 are
billed monthly. There has however been an increase in the proportion of gas SMEs who are
now billed on a bi monthly basis, with bi monthly billing now accounting for half of all bill
frequency.
27Figure 11: Bill frequency mong electricity SMEs (left) and all gas (right) SMEs
Bill understanding overall remains on par with the high levels recorded in 2019, across both
electricity and gas. The proportion of gas SME’s who claim that the bill helps them to
understand the tariff they are on and to identify all of its components has continued to
improve. It should be noted that changes in the wording/coding associated with this question
are likely to have had an impact on the 2019 and 2020 scores, which are substantially higher
than the scores recorded in previous years.
28Figure 12: Bill understanding and impact in electricity (left) and gas (right) SMEs
13. Domestic arrears
The incidence of those claiming to always pay their bill on time and in full remains high across
both the electricity and gas markets, albeit there has been a slight decline amongst electricity
customers attributable to an increase in those reporting they are in arrears (albeit marginal).
Further research has shown that respondents tend to reflect a somewhat liberal
interpretation of what constitutes arrears and perhaps there is evidence of some reluctance
to disclose such sensitive information. Consequently, it is likely that the data under represents
the degree of arrears, as reported by the suppliers.
29Figure 13: Bill payment record and arrears by electricity (left) and gas (right) customers
Similarly, nearly all SME’s claim to pay their bill on time and in full. As with consumers there
may also be a ‘broad’ interpretation of what constitutes arrears and also some reluctance to
disclose such sensitive information.
30Figure 14: Bill payment record and arrears by electricity (left) and gas (right) SME business
customers
Awareness of the options available to customers in the event of bill payment issues was also
covered in this research. The survey found that the incidence of electricity and gas customers
who are aware of the potential to make a payment arrangement with their supplier in the
event of payment issue has increased over the past year and now stands at 49% and 48%
respectively. Awareness is higher among the online sample.
31Figure 15: Awareness of availability payment plan arrangements by electricity (left) and
gas (right) customers
There has been a slight increase in the proportion of electricity & gas customers who claim to
have been previously/currently on a prepayment plan; rising from 3% to 5% in the electricity
market and 5% to 8% in the gas market (albeit not significant).
The most significant change to this measure is how the repayment amount is now defined,
with the majority of customers now claiming that the repayment amount was defined by the
supplier but in consultation with the customer. The 2019 research found that the repayment
amount was typically defined by the supplier without consultation across both electricity and
gas (note small base).
32Figure 16: Prevalence of prepayment plans among electricity (left) and gas (right)
consumers
14. Competition and consumer understanding of market
structures
Both original incumbents in the energy market remain strongly present in consumer minds,
but spontaneous awareness for these suppliers has continued a downward trajectory since
2017, with Bord Gais experiencing the biggest decline amongst electricity providers (-21%pts)
and Electric Ireland experiencing the biggest decline amongst gas providers (-17%pts) versus
the 2019 survey results.
33Figure 17: Awareness of electricity and gas competitors in amongst electricity (left) and gas
(right) consumers
Within the SME electricity market unprompted awareness of electricity providers has fallen
back to resemble 2017 levels, with market Electric Ireland continuing to achieve the highest
top of mind awareness, despite awareness declining -14% pts. Energia now achieves second
highest top of mind awareness at 50%. Bord Gais experienced the most significant decline
within the electricity market (-23%pts).
Looking at the SME gas market, Bord Gais Energy continues to receive highest unprompted
awareness of all gas suppliers at 77%, followed by Electric Ireland and Energia at 31% each.
Electric Ireland experienced the biggest decline (-13% pts).
34Figure 18: Awareness of electricity and gas competitors amongst electricity (left) and gas
(right) SME business customers
3515. Understanding and comparing offers
The level of consumer ability to understand market offers is an important dynamic in a
competitive market. Consumers were asked about the ease of comparing offers, to which 53%
of electricity customers claimed that they find it difficult to compare offers. Prepay Power and
Energia customers claim the highest level of ease. In order to understand the channels used
for comparison, the survey investigated the usage of price comparison websites to compare
offers, and results showed that 34% of all adults claimed to have used a price comparison
website to compare electricity offers – up significantly over the past number of years.
When we examine gas consumers, 54% of gas customers find comparing offers difficult. SSE
Airtricity customers claim the highest level of ease when comparing offers. In addition, a total
of 42% gas customers have used a comparison website to compare offers – indicating a rising
trend. Albeit, the rate of the increase has likely been impacted by the change in methodology.
Figure 19: Ability to compare and understand offers from electricity and gas suppliers in
electricity (left) and gas (right) customers
36Within the SME market, understanding of offers on the market has improved amongst
electricity and gas SMEs, with 2 in 5 electricity and almost half of gas SMEs claiming they have
a good understanding of offers. Ease of comparing offers has also improved, with circa 2 in 5
SME’s claiming it is easy to compare offers.
Figure 20: Ability to compare and understand offers from electricity and gas suppliers in
electricity (left) and gas (right) SMEs
16. Market Structure and Understanding
Market structures and differentiation of the roles of Suppliers and Networks companies is
typically a a challenge for electricity and gas customers. However, the 2020 results show that
awareness of ESB Networks and Gas Networks role in repairing power failures/gas leaks &
maintaining the grid has increased on 2019 levels. There is also increased clarity on who is
responsible for billing and payment. Respective roles related to meter reading and setting
energy prices continues to cause confusion however across both electricity and gas
customers.
37Figure 21: Customer understanding of the roles of energy supplier and Networks in
electricity (left) and gas (right) customers
Within the SME market, awareness of ESB Networks role in repairing power failures and
maintaining the grid remains steady, with 2 in 5 electricity customers believing CRU is
responsible for setting energy prices. Among gas customers Gas Networks role of repairing
gas leaks, maintaining the gas networks and meter reading also remains stable, while a total
of 1 in 4 gas SME’s believe CRU is responsible for setting energy prices.
38Figure 22: Understanding of the roles of energy supplier and Networks in electricity (left)
and gas (right) SMEs, 2019 vs 2020
17. Switching and Engagement
Levels of switching, the ease of doing so and the positive outcome of switching energy
providers is a key focus of this research. This research follows the same structure as in
previous studies across the four markets. The research includes an assessment of the level of
switching, experience of switching and reasons for the decision to switch, or not to switch.
The research also includes an assessment of the sales process and sales techniques used by
electricity and gas suppliers in the domestic market.
Domestic and SME electricity and gas markets
As in 2019 typical behaviour by both electricity and gas customers is to automatically continue
on with their supplier when the initial 12 month contract has expired, however there has been
an increase in the proportion of both electricity and gas customers who now look around to
see if there are better offers available.
39Figure 23: How consumers typically react when initial 12 month contract expires amongst
electricity (left) and gas (right) consumers.
Among SMEs the typical behaviour is similar to electricity and gas residential customers. There
has however been an increase in the proportion of electricity SMEs who automatically
continue with the supplier knowing the default tariff will be charged. The proportion of gas
SMEs who continue with the supplier irrespective of the tariff has also increased vs 2019.
40Figure 24: How SMEs typically react when initial 12-month contract expires
When it comes to switching energy supplier, over half of electricity and gas consumers have
switched supplier at least once in the past (56% electricity and 57% gas). Among those who
have switched, consumers report similar levels of switching within the last 12 months across
both gas and electricity. Among the online gas and electricity samples, the incidence of last 12
months switching is in line with the population, thus there is no evidence to suggest that
switching is an issue for more vulnerable customers. Electricity switching peaks among the
36-45 age group, while gas switchers rates are higher amongst those aged 46+. Little variation
across social class or region.
41Figure 25: Switching past - 12 months in electricity (left) and gas (right) customers Within the SME market 67% of electricity SMEs and 52% of gas SMEs have switched energy provider at least once in the past. The incidence of those SME’s who have switched electricity supplier within the last 12 months has declined on 2019 levels however. The reported rate of gas switching within the past 12 months has also declined on previous levels. SMEs with
Figure 26: Switching past - 12 months in electricity (left) and gas (right) SMES

Among residential customers who switched in the previous 12 months, 20% of electricity
customers and 15% of gas customers believe that there were no conditions associated with
their switch.

                                                                                      43
Figure 27: Understanding of offer – among electricity (left) and gas (right) switchers
(customers)
The proportion of SME customers who believe there is a guarantee on the term of the discount
they received has declined on 2019 levels and now stands at 47% for the SME’s who switched
electricity supplier and 53% for those who switched gas supplier.
44Figure 28: Understanding of offer – among electricity (left) and gas (right) switchers (SME)
Amongst consumers it is clamed that s website with a calculator & price comparison websites
would have the biggest impact on consumers likelihood to switch. The claimed impact of these
tools on consumer switching levels has increased significantly on 2019 levels. These high
percentages demonstrate consumers limited awareness of current offer comparison
websites.
45Figure 29: Impact of information sources on switching likelihood in electricity (left) and gas
(right) customers
18. Drivers for switching amongst electricity and gas markets
Respondents were asked to give their reasons for switching electricity and gas supplier in
order to understand the factors influencing switching in the market. Motivation to save money
was the main reason given by both electricity and gas customers as the reason for switching
within the last 12 months.
46Figure 30: Reasons for switching during last 12 months amongst electricity (left) and gas
(right) customer switchers
Amongst SMEs the quest for a reduction in cost was also the main motivation behind changing
supplier for both electricity and gas switchers, with previous supplier announcing a price hike
being referenced by almost half of all electricity SME switchers. To receive a reduction in the
total cost of electricity was also a main motivator for electricity SME last 12 month switchers.
47Figure 31: Reasons for switching during last 12 months amongst electricity (left) and gas
(right) SME switchers
19. Drivers for not switching
Domestic electricity and gas consumers who had not switched in the previous 12 months were
asked why they had not switched their energy supplier. Amongst these customers the options
selected most frequently were ‘not saving sufficient amount of money by switching’ and ‘I like
the service that I receive from my current supplier’ pointing to these as the two main reasons
given for not switching gas or electricity provider in the last 12 months.
48Figure 32: Reasons for not switching during last 12 months among electricity (left) and gas
(right) customers
Similarly, among SME non switchers, ‘satisfaction with current provider’ was the main reason
given for not switching, among both electricity and gas SMEs.
49Figure 33: Reasons for not switching during last 12 months among electricity (left) and gas
(right) SMEs
20. Overall experience of the switching process
Across electricity and gas switching there has been an uplift in the proportion of customers
initiating the switch, predominantly through the use of supplier websites and price
comparison sites. Electricity has also seen an increase in the proportion of switches conducted
via phone where the customers initiated the contact.
50Figure 34: Contact method used to switch by electricity (left) and gas (right) customer
switchers
With regards to the actual process of switching energy providers, a positive experience of the
switching process is reported by both electricity and gas switchers and has been gradually
improving since 2016, especially in relation to electricity customers. The majority of online
sample respondents who has switched in the last 12 months claim it was easy to do so (note
extremely small base).
51Figure 35: Experience of switching process by electricity (left) and gas (right) customer
switchers
Positive impact of the switching process is also evident across both electricity and gas SME
switchers, however there has been a decline in those claiming that their business bill has
reduced by the amount they expected. Some slippage in respondents level of understanding
of the terms and conditions is also evident across both electricity and gas respondents, but
remains high.
52Figure 36: Experience of switching process by electricity (left) and gas (right) SME switchers
Residential electricity customers were also asked what factors would encourage them to
switch energy provider. Greater discounts for chosen payment methods was identified as the
factor that would have the biggest impact on both electricity and gas consumer switching. It
is interesting to note that time of use tariffs is increasing in terms of its potential impact in
considering changing electricity supplier.
53Figure 37: Influencing switching in electricity (left) and gas (right) customers
21. Dual Fuel
The use of a single supplier to provide both gas and electricity to their home or business is an
option that is available to customers and businesses based in areas catered for by the Natural
gas pipeline. Dual fuel offers from suppliers typically include additional discounts and offers
in order to incentive customers to have their gas and electricity with one supplier. SME
customers were asked about the uptake of Dual fuel contacts. Among SME’s, a total of 2% of
all electricity SME’s use natural gas in their business (7% in 2019), and 45% of these claim to
be on dual fuel contracts. Among all electricity SME’s with gas and all gas SMEs, 45% indicate
they are dual fuel customers (44% in 2019).
54You can also read