ORIGINAL RESEARCH Implementation of a Mortality Prediction Rule for Real-Time Decision Making: Feasibility and Validity - MDedge
←
→
Page content transcription
If your browser does not render page correctly, please read the page content below

ORIGINAL RESEARCH

      Implementation of a Mortality Prediction Rule for Real-Time Decision
                        Making: Feasibility and Validity
      Mark E. Cowen, MD, SM1,2*, Jennifer L. Czerwinski, BA2, Patricia J. Posa, RN, BSN, MSA3,4, Elizabeth Van Hoek, MHSA4,
                      James Mattimore, MD5, Lakshmi K. Halasyamani, MD1, Robert L. Strawderman, ScD6

1
 Department of Medicine, St. Joseph Mercy Hospital, Ann Arbor, Michigan; 2Quality Institute, St. Joseph Mercy Hospital, Ann Arbor, Michigan;
3
 Department of Nursing, St. Joseph Mercy Hospital, Ann Arbor, Michigan; 4Department of Performance Improvement, St. Joseph Mercy Hospital,
Ann Arbor, Michigan; 5Department of Emergency Medicine, St. Joseph Mercy Hospital, Ann Arbor, Michigan; 6Department of Biostatistics and Com-
putational Biology, University of Rochester, Rochester, New York.

BACKGROUND: A previously published, retrospectively                            (92.9%) out of a possible 10,027 cases. The area under the
derived prediction rule for death within 30 days of hospital                   receiver operating curve for 30-day mortality was 0.850
admission has the potential to launch parallel interdiscipli-                  (95% confidence interval: 0.833-0.866), indicating very
nary team activities. Whether or not patient care improves                     good to excellent discrimination. The prospectively gener-
will depend on the validity of prospectively generated pre-                    ated 30-day mortality risk had a strong association with the
dictions, and the feasibility of generating them on demand                     receipt of palliative care by hospital discharge, in-hospital
for a critical proportion of inpatients.                                       mortality, and 180-day mortality, a fair association with the
                                                                               risk for 30-day readmissions and unplanned transfers to
OBJECTIVE: To determine the feasibility of generating mor-
                                                                               intensive care, and weak associations with receipt of inten-
tality predictions on admission and to validate their accu-
                                                                               sive unit care ever within the hospitalization or the develop-
racy using the scoring weights of the retrospective rule.
                                                                               ment of a new diagnosis that was not present on admission
DESIGN: Prospective, sequential cohort.                                        (ie, complication).
SETTING: Large, tertiary care, community hospital in the                       CONCLUSIONS: Important prognostic information is feasi-
Midwestern United States                                                       ble to obtain in a real-time, single-assessment process for a
PATIENTS: Adult patients admitted from the emergency                           sizeable proportion of hospitalized patients. Journal of Hos-
department or scheduled for elective surgery                                   pital Medicine 2014;9:720–726. V    C 2014 Society of Hospital

                                                                               Medicine
RESULTS: Mortality predictions were generated on
demand at the beginning of the hospitalization for 9312

The systematic deployment of prediction rules within                           advance care planning discussions.3–7 Patients within
health systems remains a challenge, although such                              the lower-risk strata might not need the same intensity
decision aids have been available for decades.1,2 We                           of these processes routinely unless some other indica-
previously developed and validated a prediction rule                           tion were present.
for 30-day mortality in a retrospective cohort, noting                            However attractive this conceptual framework may
that the mortality risk is associated with a number of                         be, its realization is dependent on the willingness of
other clinical events.3 These relationships suggest risk                       clinical staff to generate predictions consistently on a
strata, defined by the predicted probability of 30-day                         substantial portion of the patient population, and on
mortality, and could trigger a number of coordinated                           the accuracy of the predictions when the risk factors
care processes proportional to the level of risk.4 For                         are determined with some level of uncertainty at the
example, patients within the higher-risk strata could                          beginning of the hospitalization.2,8 Skepticism is justi-
be considered for placement into an intermediate or                            fied, because the work involved in completing the pre-
intensive care unit (ICU), be monitored more closely                           diction rule might be incompatible with existing
by physician and nurse team members for clinical                               workflow. A patient might not be scored if the emer-
deterioration, be seen by a physician within a few                             gency physician lacks time or if technical issues arise
days of hospital discharge, and be considered for                              with the information system and computation pro-
                                                                               cess.9 There is also a generic concern that the predic-
                                                                               tions will prove to be less accurate outside of the
*Address for correspondence and reprint requests: Mark E. Cowen,               original study population.8–10 A more specific concern
MD, Quality Institute, St. Joseph Mercy Hospital, 5333 McAuley Drive,
Suite 3112, Ypsilanti, MI 48197; Telephone: 734-712-8776; Fax: 734-            for our rule is how well “present on admission” diag-
712-8651; E-mail: cowenm@trinity-health.org                                    noses can be determined during the relatively short
Additional Supporting Information may be found in the online version of        emergency department or presurgery evaluation
this article.                                                                  period. For example, a final diagnosis of heart failure
Received: April 30, 2014; Revised: July 22, 2014; Accepted: July 27,           might not be established until later in the hospitaliza-
2014
2014 Society of Hospital Medicine DOI 10.1002/jhm.2250
                                                                               tion, after the results of diagnostic testing and clinical
Published online in Wiley Online Library (Wileyonlinelibrary.com).             response to treatment are known. Moreover, our

720        An Official Publication of the Society of Hospital Medicine                           Journal of Hospital Medicine Vol 9 | No 11 | November 2014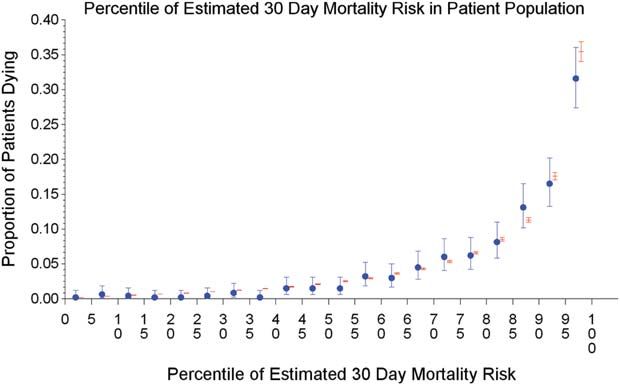
Generating Mortality Predictions      | Cowen et al

retrospective prediction rule requires an assessment of       updated, identifying those who had been discharged
the presence or absence of sepsis and respiratory fail-       from the study hospital in the previous 365 days, and
ure. These diagnoses appear to be susceptible to secu-        whether or not their diagnoses included atrial fibrilla-
lar trends in medical record coding practices,                tion, leukemia/lymphoma, metastatic cancer, cancer
suggesting the rule’s accuracy might not be stable over       other than leukemia, lymphoma, cognitive disorder,
time.11                                                       or other neurological conditions (eg, Parkinson’s, mul-
   We report the feasibility of having emergency physi-       tiple sclerosis, epilepsy, coma, and stupor). Similarly,
cians and the surgical preparation center team generate       a clinical laboratory results database was created and
mortality predictions before an inpatient bed is              updated real time through an HL7 (Health Level
assigned. We evaluate and report the accuracy of these        Seven, a standard data exchange format12) interface
prospective predictions.                                      with the laboratory information system for the follow-
                                                              ing tests performed in the preceding 30 days at a
METHODS                                                       hospital-affiliated facility: hemoglobin, platelet count,
The study population consisted of all patients 18 years       white blood count, serum troponin, blood urea nitro-
of age or less than 100 years who were admitted from          gen, serum albumin, serum lactate, arterial pH, arte-
the emergency department or assigned an inpatient             rial partial pressure of oxygen values. The third
bed following elective surgery at a tertiary, commu-          database, admission-discharge-transfer, was created
nity teaching hospital in the Midwestern United States        and updated every 15 minutes to identify patients cur-
from September 1, 2012 through February 15, 2013.             rently in the emergency room or scheduled for sur-
Although patients entering the hospital from these 2          gery. When a patient registration event was added to
pathways would be expected to have different levels           this database, the Web application created a record,
of mortality risk, we used the original prediction rule       retrieved all relevant data, and displayed the patient
for both because such distinctions were not made in           name for scoring. When the decision for hospitaliza-
its derivation and validation. Patients were not consid-      tion was made, the clinician selected the patient’s
ered if they were admitted for childbirth or other            name and reviewed the pre-populated medical diagno-
obstetrical reasons, admitted directly from physician         ses of interest, which could be overwritten based on
offices, the cardiac catheterization laboratory, hemo-        his/her own assessment (Figure 1A,B). The clinician
dialysis unit, or from another hospital. The site insti-      then indicated (“yes,” “no,” or “unknown”) if the
tutional review board approved this study.                    patient currently had or was being treated for each of
   The implementation process began with presenta-            the following: injury, heart failure, sepsis, respiratory
tions to the administrative and medical staff leader-         failure, and whether or not the admitting service
ship on the accuracy of the retrospectively generated         would be medicine (ie, nonsurgical, nonobstetrical).
mortality predictions and risk of other adverse               We considered “unknown” status to indicate the
events.3 The chief medical and nursing officers became        patient did not have the condition. When laboratory
project champions, secured internal funding for the           values were not available, a normal value was
technical components, and arranged to have 2 project          imputed using a previously developed algorithm.3
comanagers available. A multidisciplinary task force          Two additional questions, not used in the current pre-
endorsed the implementation details at biweekly meet-         diction process, were answered to provide data for a
ings throughout the planning year. The leadership of          future analysis: 1 concerning the change in the
the emergency department and surgical preparation             patient’s condition while in the emergency department
center committed their colleagues to generate the pre-        and the other concerning the presence of abnormal
dictions. The support of the emergency leadership was         vital signs. The probability of 30-day mortality was
contingent on the completion of the entire prediction         calculated via the Web application using the risk
generating process in a very short time (“within the          information supplied and the scoring weights (ie,
time a physician could hold his/her breath”). The             parameter estimates) provided in the Appendices of
chief medical officer, with the support of the leader-        our original publication.3 Predictions were updated
ship of the hospitalists and emergency physicians,            every minute as new laboratory values became avail-
made the administrative decision that a prediction            able, and flagged with an alert if a more severe score
must be generated prior to the assignment of a hospi-         resulted.
tal room.                                                        For the analyses of this study, the last prospective
   During the consensus-building phase, a Web-based           prediction viewed by emergency department person-
application was developed to generate the predictions.        nel, a hospital bed manager, or surgical suite staff
Emergency physicians and surgical preparation staff           prior to arrival on the nursing unit is the one refer-
were trained on the definitions of the risk factors (see      enced as “prospective.” Once the patient had been
Supporting Information, Appendix, in the online ver-          discharged from the hospital, we generated a second
sion of this article) and how to use the Web applica-         mortality prediction based on previously published
tion. Three supporting databases were created. Each           parameter estimates applied to risk factor data ascer-
midnight, a past medical history database was                 tained retrospectively as was done in the original

An Official Publication of the Society of Hospital Medicine            Journal of Hospital Medicine Vol 9 | No 11 | November 2014     721
Cowen et al | Generating Mortality Predictions FIG. 1. Screen shots of the Web application used to generate predictions (A) Patient list. The clinician in the emergency department or surgical preparation center selects the patient to be scored. (B) Diagnosis-based risk factors to be entered. The clinician provides an answer to each question and/or reviews information that has been prepopulated from the past medical history database. Clinical laboratory values and demographic information are electronically provided. After the diag- nosis information has been supplied, the clinician presses the “Generate Score” button to obtain the predicted 30-day mortality. article3; we subsequently refer to this prediction as The prediction scores were made available to the “retrospective.” We will report on the group of clinical teams gradually during the study period. All patients who had both prospective and retrospective scores were viewable by the midpoint of the study for scores (1 patient had a prospective but not retrospec- emergency department admissions and near the end of tive score available). the study for elective-surgery patients. Only 2 changes 722 An Official Publication of the Society of Hospital Medicine Journal of Hospital Medicine Vol 9 | No 11 | November 2014
Generating Mortality Predictions      | Cowen et al

in care processes based on level of risk were intro-          sponding thresholds (at probabilities of death of
duced during the study period. The first required ini-        0.005, 0.02, 0.07, 0.20) were determined by visual
tial placement of patients having a probability of            inspection of the event rates and slope of curves dis-
dying of 0.3 or greater into an intensive or intermedi-       played in Figure 1 of the original publication.3
ate care unit unless the patient or family requested a
less aggressive approach. The second occurred in the          Relationship to Secondary Clinical Outcomes of
final 2 months of the study when a large multispeci-          Interest
alty practice began routinely arranging for high-risk         The choice of clinical care processes triggered per level
patients to be seen within 3 or 7 days of hospital            of risk may be informed by understanding the fre-
discharge.                                                    quency of events that increase with the mortality risk.
                                                              We therefore examined the AROC from logistic
Statistical Analyses                                          regression models for the following outcomes using
SAS version 9.3 (SAS Institute Inc., Cary, NC) was            the prospectively generated probability as an explana-
used to build the datasets and perform the analyses.          tory variable: unplanned transfer to an ICU within the
Feasibility was evaluated by the number of patients           first 24 hours for patients not admitted to an ICU ini-
who were candidates for prospective scoring with a            tially, ICU use at some point during the hospitaliza-
score available at the time of admission. The validity        tion, the development of a condition not present on
was assessed with the primary outcome of death                admission (“complication”), receipt of palliative care
within 30 days from the date of hospital admission, as        by the end of the hospitalization, death during the
determined from hospital administrative data and the          hospitalization, 30-day readmission, and death within
Social Security Death Index. The primary statistical          180 days. The definition of these outcomes and statis-
metric is the area under the receiver operating charac-       tical approach used has been previously reported.3
teristic curve (AROC) and the corresponding 95%               RESULTS
Wald confidence limits. We needed some context for
                                                              Mortality predictions were generated on demand for
understanding the performance of the prospective pre-
                                                              7291 out of 7777 (93.8%) eligible patients admitted
dictions, assuming the accuracy could deteriorate due
                                                              from the emergency department, and for 2021 out of
to the instability of the prediction rule over time and/
                                                              2250 (89.8%) eligible elective surgical cases, for a
or due to imperfect clinical information at the time
                                                              total of 9312 predictions generated out of a possible
the risk factors were determined. Accordingly, we also
                                                              10,027 hospitalizations (92.9%). Table 1 displays the
calculated an AROC based on retrospectively derived
                                                              characteristics of the study population. The mean age
covariates (but using the same set of parameter esti-
                                                              was 65.2 years and 53.8% were women. The most
mates) as done in our original publication so we could
                                                              common risk factors were atrial fibrillation (16.4%)
gauge the stability of the original prediction rule.
                                                              and cancer (14.6%). Orders for a comfort care
However, the motivation was not to determine
                                                              approach (rather than curative) were entered within 4
whether retrospective versus prospective predictions
                                                              hours of admission for 32/9312 patients (0.34%), and
were more accurate, given that only prospective pre-
                                                              9/9312 (0.1%) were hospice patients on admission.
dictions are useful in the context of developing real-
time care processes. Rather, we wanted to know if the         Evaluation of Prediction Accuracy
prospective predictions would be sufficiently accurate        The AROC for 30-day mortality was 0.850 (95%
for use in clinical practice. A priori, we assumed the        confidence interval [CI]: 0.833-0.866) for prospec-
prospective predictions should have an AROC of                tively collected covariates, and 0.870 (95% CI: 0.855-
approximately 0.80. Therefore, a target sample size of        0.885) for retrospectively determined risk factors.
8660 hospitalizations was determined to be adequate           These AROCs are not substantively different from
to assess validity, assuming a 30-day mortality rate of       each other, demonstrating comparable prediction per-
5%, a desired lower 95% confidence boundary for the           formance. Calibration was excellent, as indicated in
area under the prospective curve at or above 0.80,            Figure 2, in which the predicted level of risk lay
with a total confidence interval width of 0.07.13 Cali-       within the 95% confidence limits of the actual 30-day
bration was assessed by comparing the actual propor-          mortality for 19 out of 20 intervals of 5 percentile
tion of patients dying (with 95% binomial confidence          increments.
intervals) with the mean predicted mortality level
within 5 percentile increments of predicted risk.             Relationship to Secondary Clinical Outcomes of
                                                              Interest
Risk Strata                                                   The relationship between the prospectively generated
We categorize the probability of 30-day mortality into        probability of dying within 30 days and other events
strata, with the understanding that the thresholds for        is quantified by the AROC displayed in Table 2. The
defining these are a work in progress. Our hospital           30-day mortality risk has a strong association with
currently has 5 strata ranging from level 1 (highest          the receipt of palliative care by hospital discharge, in-
mortality risk) to level 5 (lowest risk). The corre-          hospital mortality, and 180-day mortality, a fair

An Official Publication of the Society of Hospital Medicine            Journal of Hospital Medicine Vol 9 | No 11 | November 2014     723
Cowen et al | Generating Mortality Predictions
TABLE 1. Risk Factors Used in the Prediction Rule and Outcomes of Interest
Risk Factors No. Without Imputation No. With Imputation
Clinical laboratory values within preceding 30 days
Maximum serum blood urea nitrogen (mg/dL) 8,484 22.7 (17.7) 9,312 22.3 (16.9)
Minimum hemoglobin, g/dL, 8,750 12.5 (2.4) 9,312 12.4 (2.4)
Minimum platelet count, 1,000/UL 8,737 224.1 (87.4) 9,312 225.2 (84.7)
Maximum white blood count, 1,000/UL 8,750 10.3 (5.8) 9,312 10.3 (5.6)
Maximum serum lactate, mEq/L 1,749 2.2 (1.8) 9,312 0.7 (1.1)
Minimum serum albumin, g/dL 4,057 3.4 (0.7) 9,312 3.2 (0.5)
Minimum arterial pH 509 7.36 (0.10) 9,312 7.36 (0.02)
Minimum arterial pO2, mm Hg 509 73.6 (25.2) 9,312 98.6 (8.4)
Maximum serum troponin, ng/mL 3,217 0.5 (9.3) 9,312 0.2 (5.4)
Demographics and diagnoses
Age, y 9,312 65.2 (17.0)
Female sex 9,312 5,006 (53.8%)
Previous hospitalization within past 365 days 9,312 3,995 (42.9%)
Emergent admission 9,312 7,288 (78.3%)
Admitted to a medicine service 9,312 5,840 (62.7%)
Current or past atrial fibrillation 9,312 1,526 (16.4%)
Current or past cancer without metastases, excluding leukemia or lymphoma 9,312 1,356 (14.6%)
Current or past history of leukemia or lymphoma 9,312 145 (1.6%)
Current or past metastatic cancer 9,312 363 (3.9%)
Current or past cognitive deficiency 9,312 844 (9.1%)
Current or past history of other neurological conditions (eg, Parkinson’s disease, multiple sclerosis, epilepsy, coma, stupor, brain damage) 9,312 952 (10.2%)
Injury such as fractures or trauma at the time of admission 9,312 656 (7.0%)
Sepsis at the time of admission 9,312 406 (4.4%)
Heart failure at the time of admission 9,312 776 (8.3%)
Respiratory failure on admission 9,312 557 (6.0%)
Outcomes of interest
Unplanned transfer to an ICU (for those not admitted to an ICU) within 24 hours of admission 8,377 86 (1.0%)
Ever in an ICU during the hospitalization 9,312 1,267 (13.6%)
Development of a condition not present on admission (complication) 9,312 834 (9.0%)
Within hospital mortality 9,312 188 (2.0%)
Mortality within 30 days of admission 9,312 466 (5.0%)
Mortality within 180 days of admission 9,312 1,070 (11.5%)
Receipt of palliative care by the end of the hospitalization 9,312 314 (3.4%)
Readmitted to the hospital within 30 days of discharge (patients alive at discharge) 9,124 1,302 (14.3%)
Readmitted to the hospital within 30 days of discharge (patients alive on admission) 9,312 1,302 (14.0%)
NOTE: Data are presented as mean (standard deviation) or number (%). Abbreviations: ICU, intensive care unit.
association with the risk for 30-day readmissions and
unplanned transfers to intensive care, and weak asso-
ciations with receipt of intensive unit care ever within
the hospitalization or the development of a new diag-
nosis that was not present on admission (complica-
tion). The frequency of these events per mortality risk
strata is shown in Table 3. The level 1 stratum con-
tains a higher frequency of these events, whereas the
level 5 stratum contains relatively few, reflecting the
Pareto principle by which a relatively small propor-
tion of patients contribute a disproportionate fre-
quency of the events of interest.
FIG. 2. Calibration of the prediction rule. The horizontal axis displays inter- DISCUSSION
vals of 5 percentile increments of the predicted risk of dying within 30 days
of admission (prospectively collected covariates). The vertical axis indicates Emergency physicians and surgical preparation center
the proportion of patients who actually died. The red dash marks represent nurses generated predictions by the time of hospital
the mean predicted mortality risk (and corresponding 95% confidence limits) admission for over 90% of the target population dur-
for patients within the interval. The blue solid dot represents the actual pro-
portion of patients within the interval who died, with the blue vertical hash ing usual workflow, without the addition of staff or
marks indicating the 95% confidence limits for the proportion dying. resources. The discrimination of the prospectively
724 An Official Publication of the Society of Hospital Medicine Journal of Hospital Medicine Vol 9 | No 11 | November 2014Generating Mortality Predictions | Cowen et al
TABLE 2. Area Under the Receiver Operating Our study has a number of limitations, some of
Characteristic Curve Secondary Outcomes which were noted in our original publication, and
of Interest Associated With 30-Day Mortality Risk although still relevant, will not be repeated here for
In-hospital mortality 0.841 (0.814–0.869)
space considerations. This is a single-site study that
180–day mortality 0.836 (0.825–0.848) used a prediction rule developed by the same site, albeit
Receipt of palliative care by discharge 0.875 (0.858–0.891) on a patient population 4 to 5 years earlier. It is not
30–day readmission (patients alive at discharge) 0.649 (0.634–0.664) known how well the specific rule might perform in
Unplanned transfer to an ICU (for those not 0.643 (0.590–0.696) other hospital populations; any such use should there-
admitted to an ICU) within 24 hours
Ever in an ICU during the hospitalization 0.605 (0.588–0.621)
fore be accompanied by independent validation studies
Development of a condition not present 0.555 (0.535–0.575) prior to implementation. Our successful experience
on admission (complication) should motivate future validation studies. Second,
because the prognoses of patients scored from the emer-
NOTE: Data are presented as Mann–Whitney (95% Wald confidence limits) using the calculated probability gency department are likely to be worse than those of
of dying within 30 days and its logarithm as the explanatory variable. Abbreviations: ICU, intensive care elective surgery patients, our rule should be recalibrated
unit.
for each subgroup separately. We plan to do this in the
near future, as well as consider additional risk factors.
generated predictions was very good to excellent, with Third, the other events of interest might be predicted
an AROC of 0.850 (95% CI: 0.833-0.866), similar to more accurately if rules specifically developed for each
that obtained from the retrospective version. Calibra- were deployed. The mortality risk by itself is unlikely to
tion was excellent. The prospectively calculated mor- be a sufficiently accurate predictor, particularly for
tality risk was associated with a number of other complications and intensive care use, for reasons out-
events. As shown in Table 3, the differing frequency lined in our original publication.3 However, the varying
of events within the risk strata support the develop- levels of events within the higher versus lower strata
ment of differing intensities of multidisciplinary strat- should be noted by the clinical team as they design their
egies according to the level of risk.5 Our study team-based processes. A follow-up visit with a physi-
provides useful experience for others who anticipate cian within a few days of discharge could address the
generating real-time predictions. We consider the key concurrent risk of dying as well as readmission, for
reasons for success to be the considerable time spent example. Finally, it is too early to determine if the avail-
achieving consensus, the technical development of the ability of mortality predictions from this rule will bene-
Web application, the brief clinician time required for fit patients.2,8,10 During the study period, we
the scoring process, the leadership of the chief medical implemented only 2 new care processes based on the
and nursing officers, and the requirement that a pre- level of risk. This lack of interventions allowed us to
diction be generated before assignment of a hospital evaluate the prediction accuracy with minimal addi-
room. tional confounding, but at the expense of not yet
TABLE 3. Events Occurring Within Strata Defined by Risk of 30-Day Mortality
Unplanned Diagnosis Not
30-Day Transfers to ICU Present on Admission, Palliative Status
Risk Mortality, Within 24 Hours, Complication, at Discharge, Death in Hospital,
Strata Count/Cases (%) Count/Cases (%) Count/Cases (%) Count/Cases (%) Count/Cases (%)
1 155/501 (30.9%) 6/358 (1.7%) 58/501 (11.6%) 110/501 (22.0%) 72/501 (14.4%)
2 166/1,316 (12.6%) 22/1,166 (1.9%) 148/1,316 (11.3%) 121/1,316 (9.2%) 58/1,316 (4.4%)
3 117/2,977 (3.9%) 35/2,701 (1.3%) 271/2,977 (9.1%) 75/2,977 (2.5%) 43/2,977 (1.4%)
4 24/3,350 (0.7%) 20/3,042 (0.7%) 293/3,350 (8.8%) 6/3,350 (0.2%) 13/3,350 (0.4%)
5 4/1,168 (0.3%) 3/1,110 (0.3%) 64/1,168 (5.5%) 2/1,168 (0.2%) 2/1,168 (0.2%)
Total 466/9,312 (5.0%) 86/8,377 (1.0%) 834/9,312 (9.0%) 314/9,312 (3.4%) 188/9,312 (2.0%)
Death or Readmission
Ever in ICU, 30-Day Readmission, Within 30 Days, 180-Day Mortality,
Risk Strata Count/Cases (%) Count/Cases (%) Count/Cases (%) Count/Cases (%)
1 165/501 (32.9%) 106/429 (24.7%) 243/501 (48.5%) 240/501 (47.9%)
2 213/1,316 (16.2%) 275/1,258 (21.9%) 418/1,316 (31.8%) 403/1,316 (30.6%)
3 412/2,977 (13.8%) 521/2,934 (17.8%) 612/2,977 (20.6%) 344/2,977 (11.6%)
4 406/3,350 (12.1%) 348/3,337 (10.4%) 368/3,350 (11.0%) 77/3,350 (2.3%)
5 71/1,168 (6.1%) 52/1,166 (4.5%) 56/1,168 (4.8%) 6/1,168 (0.5%)
Total 1,267/9,312 (13.6%) 1,302/9,124 (14.3%) 1,697/9,312 (18.2%) 1,070/9,312 (11.5%)
NOTE: Abbreviations: ICU, intensive care unit.
An Official Publication of the Society of Hospital Medicine Journal of Hospital Medicine Vol 9 | No 11 | November 2014 725Cowen et al | Generating Mortality Predictions
knowing the clinical impact of this work. After the 3. Cowen ME, Strawderman RL, Czerwinski JL, Smith MJ,
Halasyamani LK. Mortality predictions on admission as a context for
study period, we implemented a number of other inter- organizing care activities. J Hosp Med. 2013;8:229–235.
ventions and plan on evaluating their effectiveness in 4. Kellett J, Deane B. The simple clinical score predicts mortality for 30
days after admission to an acute medical unit. QJM. 2006;99:771–781.
the future. We are also considering an evaluation of the 5. Amarasingham R, Patel PC, Toto K, et al. Allocating scare resources
potential information gained by updating the predic- in real-time to reduce heart failure readmissions: a prospective, con-
trolled study. BMJ Qual Saf. 2013;22:998–1005.
tions throughout the course of the hospitalization.14 6. Burke RE, Coleman EA. Interventions to decrease hospital readmis-
In conclusion, it is feasible to have a reasonably sions: keys for cost-effectiveness. JAMA Intern Med. 2013;173:695–
accurate prediction of mortality risk for most adult 698.
7. Ravikumar TS, Sharma C, Marini C, et.al. A validated value-based
patients at the beginning of their hospitalizations. The model to improve hospital-wide perioperative outcomes. Ann Surg.
availability of this prognostic information provides an 2010;252:486–498.
8. Grady D, Berkowitz SA. Why is a good clinical prediction rule so hard
opportunity to develop proactive care plans for high- to find? Arch Intern Med. 2011;171:1701–1702.
and low-risk subsets of patients. 9. Escobar GJ, LaGuardia JC, Turk BJ, Ragins A, Kipnis P, Draper D.
Early detection of impending physiologic deterioration among patients
who are not in intensive care: development of predictive models using
Acknowledgements data from an automated electronic medical record. J Hosp Med. 2012;
The authors acknowledge the technical assistance of Nehal Sanghvi and 7(5):388–395.
Ben Sutton in the development of the Web application and related data- 10. Siontis GCM, Tzoulaki I, Ioannidis JPA. Predicting death: an empiri-
bases, and the support of the Chief Nursing Officer, Joyce Young, RN, cal evaluation of predictive tools for mortality. Arch Intern Med.
PhD, the emergency department medical staff, Mohammad Salameh, 2011;171:1721–1726.
MD, David Vandenberg, MD, and the surgical preparation center staff. 11. Lindenauer PK, Lagu T, Shieh M-S, Pekow PS, Rothberg MB. Associ-
ation of diagnostic coding with trends in hospitalizations and mortal-
Disclosure: Nothing to report. ity of patients with pneumonia, 2003–2009. JAMA. 2012;307:1405–
1413.
References 12. Health Level Seven International website. Available at: http://
1. Goldman L, Caldera DL, Nussbaum SR, et al. Multifactorial index of www.hl7.org/. Accessed June 21, 2014.
cardiac risk in noncardiac surgical procedures. N Engl J Med. 1977; 13. Blume, JD. Bounding sample size projections for the area under a
297:845–850. ROC curve. J Stat Plan Inference. 2009;139:711–721.
2. Stiell IG, Wells GA. Methodological standards for the development of 14. Wong J, Taljaard M, Forster AJ, Escobar GJ, von Walraven C. Deri-
clinical decision rules in emergency medicine. Ann Emerg Med. 1999; vation and validation of a model to predict daily risk of death in hos-
33:437–447. pital. Med Care. 2011;49:734–743.
726 An Official Publication of the Society of Hospital Medicine Journal of Hospital Medicine Vol 9 | No 11 | November 2014You can also read