Polymorphism of The Regulatory Region of the ITGAM Gene (-323G A) as a Novel Predictor of a Poor Nutritional Status in Head and Neck Cancer ...
←
→
Page content transcription
If your browser does not render page correctly, please read the page content below
Journal of
Clinical Medicine
Article
Polymorphism of The Regulatory Region of the
ITGAM Gene (-323G>A) as a Novel Predictor of a Poor
Nutritional Status in Head and Neck Cancer Patients
Subjected to Intensity-Modulated Radiation Therapy
Marcin Mazurek 1, *, Radosław Mlak 1 , Iwona Homa-Mlak 1 , Tomasz Powrózek 1 ,
Anna Brzozowska 2 , Paweł Goł˛ebiowski 2 and Teresa Małecka-Massalska 1
1 Department of Human Physiology, Medical University of Lublin, 20-059 Lublin, Poland;
radoslaw.mlak@gmail.com (R.M.); iwona.homa.mlak@gmail.com (I.H.-M.);
tomasz.powrozek@gmail.com (T.P.); teresa.malecka-massalska@umlub.pl (T.M.-M.)
2 II Department of Radiotherapy, Center of Oncology of the Lublin Region St. John of Dukla, 20-059 Lublin,
Poland; annabrzo@poczta.onet.pl (A.B.); golebiowski.pawel@wp.pl (P.G.)
* Correspondence: marcinmazurek1212@gmail.com; Tel.: +48-81-448-60-80
Received: 13 November 2020; Accepted: 13 December 2020; Published: 14 December 2020
Abstract: Background: The most serious disturbance of the nutritional status is neoplastic cachexia.
The main factor contributing to the development of cachexia is the ongoing inflammatory process.
The gene associated with the development of the inflammatory response is ITGAM. Therefore, the aim
of the study was to assess the relationship between a single nucleotide polymorphism (SNP)-323G>A
of the ITGAM gene and the occurrence of nutritional disorders in patients undergoing radiotherapy
(RT) due to head and neck cancers (HNC). Methods: The study involved 71 patients with HNC
treated with intensity-modulated radiotherapy (IMRT). SNP analysis of the ITGAM gene (-323G>A)
was performed using commercial molecular probes and Real-Time PCR. Results: The presence of
the A allele of the ITGAM gene significantly (over 14-fold) reduced the risk of severe disturbances
in nutritional status assessed according to the subjective global assessment (SGA) scale (odds ratio
(OR) = 0.07; p = 0.0213). The GG genotype of this gene was associated with an over three-fold higher
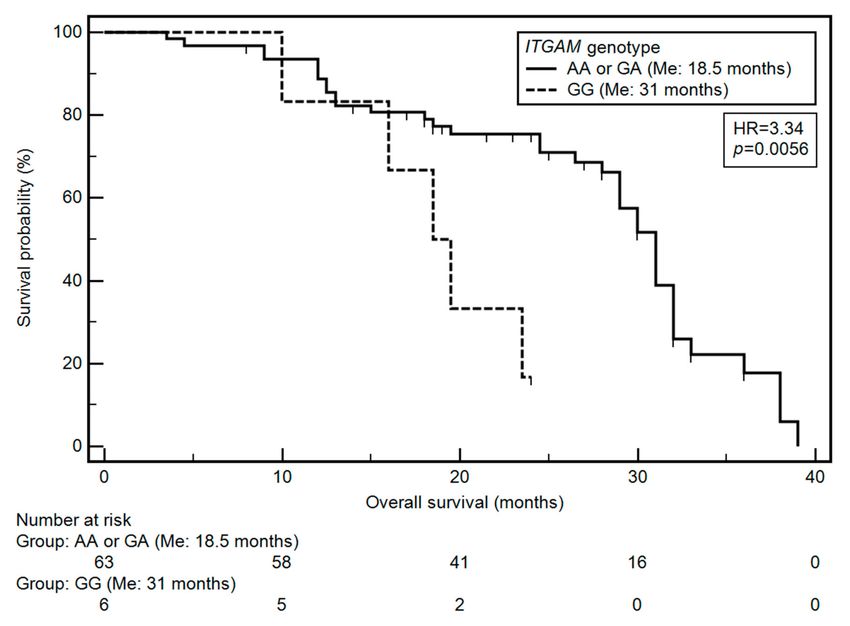
risk of shortened overall survival (OR = 3.01; p = 0.0376). Conclusions: Determination of the SNP
(-323G>A) of the ITGAM gene may prove to be a useful marker in the assessment of the risk of
nutritional disorders in patients with HNC undergoing RT.
Keywords: head and neck cancer; cancer cachexia; malnutrition; polymorphism; radiotherapy;
IMRT; ITGAM
1. Introduction
Head and neck cancers (HNC) are mainly located in the pharynx, nasopharynx, larynx and
oral cavity. Smoking, alcohol abuse and, in the case of oropharyngeal cancers, human papillomavirus
(HPV) infection are considered to be the main risk factors for developing HNC [1]. According to
epidemiological data, approximately 630,000 new cases of HNC are diagnosed annually, and the most
common histological form is squamous cell carcinoma, accounting for 90% of cases [1]. In recent years,
developing countries have seen a nearly two-thirds increase in the incidence of HNC [2]. Worldwide,
350,000 people die from HNC every year [1].
HNC treatment is based primarily on the use of surgery, radiotherapy (RT), chemotherapy
(CTH) and chemoradiotherapy (C-RT) depending on the stage of cancer progression. However,
since most patients are diagnosed when the cancer is at an advanced stage, RT is the axis of treatment
J. Clin. Med. 2020, 9, 4041; doi:10.3390/jcm9124041 www.mdpi.com/journal/jcm
Pobrano z Repozytorium Uniwersytetu Medycznego w Lublinie / Downloaded from Repository of Medical University of Lublin 2021-11-17J. Clin. Med. 2020, 9, 4041 2 of 14
in clinical practice. More and more often, in HNC therapy, traditional RT is abandoned and its
modifications (e.g., intensity-modulated radiotherapy, IMRT) are used in order to reduce the side
effects of the therapy. In the case of IMRT, tumor tissue is exposed to sufficiently high doses of
ionizing radiation. Therefore, in the case of sensitive tissues, especially in the area of the head and neck
(brain stem, spinal cord, parotid glands, and optic nerve), the use of IMRT contributes to increasing
safety and shortening the treatment time [3–5].
More precise radiation dose targeting at the tumor tissue while protecting healthy tissues reduces
the risk of early and late toxicity symptoms: oral mucositis (OM), dysphagia, and xerostomia [6].
The onset of dysphagia symptoms is observed already with a dose of 50–60 Gy [6]. The use of IMRT
contributes to the reduction of the risk of the development of OM, but does not rule out the occurrence
of other toxicities [7]. Malnutrition symptoms arising during RT or C-RT treatment occur in 44–88%
of patients. Critical weight loss (CWL) is much more common in patients with HNC undergoing RT
(>5% during RT and >7.5% by week 12 following treatment). In addition, the development of
CWL is associated with poor long-term prognosis [8]. The use of IMRT alone translates into a
reduction in the percentage of patients who require a “feeding tube” compared to patients with
HNC treated with three-dimensional conformal radiation therapy (3DC-RT) (49% vs. 72%). A similar
relationship is observed in the group of patients treated with chemo-IMRT compared to 3DC-RT
(63% vs. 82%) [9]. Cancer cachexia has a multifactorial basis; it is characterized by the predominance
of catabolic processes, which result in the progressive loss of fat and muscle tissue. It can develop
to the subsequent, irreversible stage of malnutrition [8,10]. It is suspected that the main mechanism
responsible for the development of neoplastic cachexia is the increased inflammation manifested
by an increase in pro-inflammatory cytokines: TNFα, INF-γ and IL-6. When tissues are exposed
to a beam of ionizing radiation, the NFκ-B pathway activation occurs, the production of cytokines
responsible for the induction of inflammation and the generation of large amounts of free radicals.
The resulting cytokines participate in the pathways activating the processes related to the destruction
of muscle fibers as well as the reduction of adipose tissue [8]. IL-6 participates in the development
of inflammation in the course of many cancers: breast, prostate, colon, lung, stomach and brain [11].
The overproduction of IL-6 contributes to the promotion of processes conducive to the breakdown
of muscle tissue (attempts have been made to use this parameter to monitor the nutritional status
of the patient), but it is worth noting that in some cases, cachexia may develop without a marked
increase in typical pro-inflammatory cytokines (including IL-6) [12,13]. This prompts the search for
other markers specific to HNC-related eating disorders. In the case of patients with HNC, it was found
that nutritional disorders contribute to a worse response to treatment, deterioration of the quality of
life, toxic effects of therapy, longer hospitalization and shorter survival time [8]. This is an important
premise for the search and determination of prognostic factors for patients with nutritional disorders.
One of the genes associated with the development of the inflammatory response is ITGAM,
also known as CD11b, Mac-1 integrin alpha chain or complement receptor 3, located on the 16p11.2
chromosome [14]. The protein product of the ITGAM gene is responsible for the functioning of INF-γ
receptors and the regulation of the secretion of inflammatory mediators. When ITGAM expression
is low on the surface of antigen-presenting cells (APCs), interleukin (IL) production is increased,
including IL-6 and IL-17 [14,15]. The effect of single nucleotide polymorphism (SNP) rs114367 on the
level of both the ITGAM transcript and protein on monocytes’ surface in patients with systemic lupus
erythematosus (SLE) has been demonstrated. The mRNA level depended on the genotype (and the
amount of protein was proportional to the level of the transcript). More than a two-fold decrease in
protein levels occurred in patients with AA genotype (predisposing them to higher risk) compared to
patients with GG genotype (lower risk group). Differences in the expression of this protein may result
from the allele-specific decrease in transcription repression [16]. However, to our knowledge, there are
no studies on the correlation between the ITGAM gene status and the development of nutritional
disorders in patients with HNC. The aim of this study was to assess the relationship between SNPs
Pobrano z Repozytorium Uniwersytetu Medycznego w Lublinie / Downloaded from Repository of Medical University of Lublin 2021-11-17J. Clin. Med. 2020, 9, 4041 3 of 14
located in the regulatory region of the ITGAM gene (-323G>A) and the occurrence of nutritional
disorders in patients with HNC undergoing IMRT.
2. Materials and Methods
2.1. Study Group
69 patients diagnosed with advanced HNC and treated at the Department of Oncology of the
Medical University of Lublin in 2014–2017 were qualified for the study. The following inclusion
criteria were used: age over 18, both women and men, and histopathologically confirmed head and
neck cancer.
The study included patients with histologically confirmed advanced HNC in stage III (28.98%)
or IV (71.02%) according to the TNM classification. The median age of patients was 63 years
(range: 42–87 years). Men predominated in the study group (85.51%). HNC was located in the larynx
in 52.17% of patients and in the nasopharynx in 42.03%. A total of 42.03% of patients were treated
with surgery and RT, 26.09% were treated with surgery and C-RT, 13.04% were treated only with RT,
4.35% received induced CTH with RT and 8.69% were treated with C-RT. Treatment with the induced
CTH method and C-RT was used in 4.35% of patients, and in the case of 1.45%, this method was
supplemented with surgery. The decision to implement parenteral nutrition was made in 11.59% of
patients. 63.77% of the subjects experienced critical weight loss (CWL). The study group characteristics
are presented in Table 1.
Table 1. General characteristics of the study group.
Factor Study Group (n = 69)
Male 59 (85.51%)
Gender
Female 10 (14.49%)
Mean ± standard deviation, 63.5 ± 9.3,
Age [years]
median (range) 63 (42–87)
≥65 29 (42.03%)
1 10 (14.49%)
Surgery + RT 29 (42.03%)
Surgery + C-RT 18 (26.09%)
RTH alone 9 (13.04%)
Type of treatment Induction CTH +RT 3 (4.35%)
C-RT 6 (8.69%)
Induction CTH +C-RT 3 (4.35%)
Induction CTH + Surgery + C-RT 1 (1.45%)
Pobrano z Repozytorium Uniwersytetu Medycznego w Lublinie / Downloaded from Repository of Medical University of Lublin 2021-11-17J. Clin. Med. 2020, 9, 4041 4 of 14
Table 1. Cont.
Factor Study Group (n = 69)
Yes 29 (42.03%)
Alcohol consumption
No 40 (57.97%)
Smoker 51 (73.91%)
Non-smoker 18 (26.09%)
Smoking status Current smoker 47 (92.16%)
Former smoker 4 (7.84%)
Smoking during treatment 43 (91.49%)
Does not smoke during treatment 4 (8.51%)
Yes 8 (11.59%)
Parenteral nutrition
No 61 (88.41%)
Mean ± standard deviation, 65.2 ± 11.4,
Weight [kg]
median (range) 66 (43–9)
Mean ± standard deviation, 23 ± 4,3, 22.8
BMI [kg/m2 ]
median (range) (14.5–34.4)
A 15 (21.74%)
SGA B 32 (46.38%)
C 22 (31.88%)
2 47 (68.12%)
3 19 (27.54%)
NRS
4 2 (2.90%)
5 1 (1.44%)
Yes 25 (36.23%)
CWL
No 44 (63.77%)
2.2. IMRT
Patients undergoing IMRT were subsequently included in the study group (patients could have
previously undergone surgery and/or CTH). On the other hand, people diagnosed with other types
of cancer (melanoma, lymphoma) and previous cancer cases, including HNC located in the RT site,
were excluded from the study. The Eastern Cooperative Oncology Group (ECOG) scale was used to
assess the patient’s physical performance level. Alcohol consumption was assessed according to the
International Statistical Classification of Disease and Related Health Problems (ICD). The nutrition
risk screening (NRS) scale was used to assess patients’ nutritional risk, while the subjective global
assessment (SGA) was used to assess the degree of nutrition. Based on the SGA scale, patients were
divided into those with good nutritional status (SGA-A) and the ones with moderate (SGA-B) or
severe (SGA-C) malnutrition. Based on the work of Langius et al., critical weight loss (CWL) was
defined as a weight loss of >5% from the start of RT to week 4 or >6.25% to week 7 of RT [17].
The following groups were distinguished among smokers: former and current smokers. A non-smoker
is a person who has never smoked tobacco or a person who has smoked less than 100 cigarettes in their
lifetime. The current smoker or ex-smoker is defined as an adult who has smoked at least 100 cigarettes
during his life or is still smoking. The treatment was based on the IMRT technique using ONCOR
(Siemens, München, Germany) linear accelerator at the dose of 54–70 Gy (the daily dose was 2 Gy).
In patients in advanced stages, a total dose of 70 Gy was used in 35 fractions per tumor and enlarged
lymph nodes. The 66 Gy irradiation dose in 33 fractions was received by patients with high volume
risk who underwent surgery. In contrast, patients with an average and low risk received 60 and 54 Gy,
respectively. Doses of 54 Gy or 60 Gy were used to treat elective lymph nodes. In some patients,
in addition to irradiation, treatment with cisplatin and 5-fluorouracil (1–4 cycles of chemotherapy)
was used.
2.3. Genotyping
Prior to the commencement of the study, 5 mL of peripheral blood were collected from each
person participating in the study and stored at −80 ◦ C until laboratory analysis. DNA isolation
was performed using the column method with a dedicated kit according to the manufacturer’s
recommendations (DNA Blood Mini Kit, Quiagen, Canada). Subsequently, the spectrophotometric
Pobrano z Repozytorium Uniwersytetu Medycznego w Lublinie / Downloaded from Repository of Medical University of Lublin 2021-11-17J. Clin. Med. 2020, 9, 4041 5 of 14
evaluation of the concentration and quality of the obtained DNA was performed using the NanoDrop
Lite Spectrophotometer (Thermo Fisher Scientific, Waltham, MA, USA). The genotyping reaction
based on the Real-Time PCR technique was performed on a StepOnePlus device (Applied Biosystems,
Foster City, CA, USA) according to the manufacturer’s protocol using Genotyping Master Mix and
TaqMan probes specific for ITGAM SNP (rs7193943) (Thermo Fisher Scientific, Waltham, MA, USA).
For genotyping, we chose the Real-Time PCR method, which is commonly used both in scientific
research and in routine genetic diagnostics (many tests have the necessary diagnostic certification) and
the necessary probes are commercially available, which makes the results obtained by different research
teams comparable. The qPCR was performed in 10 µL reaction volume on 96-well plates. To each well
reaction mix containing 5 µL of Taqman Genotyping Master Mix, 0.5 µL of Taqman SNP assay (20×)
and 4.5 µL 0.2 ng/µL diluted DNA template were added. The thermal cycling conditions consisted
of enzyme activation at 95 ◦ C, 40 cycles of denaturation at 95 ◦ C for 15 s and annealing at 60 ◦ C
for 1 min. All sample tests were performed in triplicates. After amplification, the genotypes variants
were obtained and analyzed on StepOne Software v2.3 (Applied Biosystems, Foster City, CA, USA).
In addition, 10% randomly selected samples were re-analyzed by sequencing technology (3500 Genetic
Analyzer, Life Technologies, Carlsbad, CA, USA); results are 100% consistent. The manufacturer has
validated the selected probe.
2.4. Statistical Analysis
The statistical analysis of the results was performed using the MedCalc 12.7 software (MedCalc Software,
Belgium). Results of p < 0.05 were considered statistically significant. In order to assess the risk of
malnutrition (SGA), nutritional risk (NRS) and CWL depending on demographic, clinical and genetic factors,
an analysis was performed using the odds ratio (OR) test with 95% Confidence Interval (95% CI). Univariate
overall survival (OS) analysis was performed with the use of the two-side log-rank test (with the calculation
of the risk coefficient–hazard ratio, HR) and visualized with the use of Kaplan–Meier estimation, whereas
Cox logistic regression models were used in multivariate OS analysis with statistically significant factors from
univariate analysis (α < 0.05) as included variables. Comparisons of the distribution of demographic and
(continuous) nutritional variables depending on the genotype of the studied gene, nutritional status assessed
by SGA, nutritional risk (NRS scale) and the occurrence of CWL were performed using the non-parametric
Mann–Whitney U test.
3. Results
3.1. Factors Affecting the Risk of Malnutrition According to SGA Scale
In the group diagnosed with non-squamous cell carcinoma, there was a 6.67-fold lower risk of
moderate and severe malnutrition (SGA) approaching significance (OR = 0.15; p = 0.0530). According
to the SGA scale, there was a significant 5.5-fold higher risk of moderate and severe malnutrition in the
non-oropharyngeal group (OR = 5.50; p = 0.0089). In patients with cancer located outside the larynx,
a significant, 4-fold lower risk of moderate and severe malnutrition was found according to SGA
scale compared to other locations (OR = 0.25; p = 0.0319). A 48-fold higher risk of a diagnosis of
moderate and severe disturbances in nutritional status was noted in the case of people with the T4
trait (OR = 48.30; p = 0.0080). The risk of moderate or severe malnutrition significantly higher than
two-fold was observed in non-smokers (OR = 2.29; p = 0.0466). Moreover, the risk of moderate or
severe malnutrition significantly higher than 5.5-fold was observed in patients with allele G (OR = 5.50;
p = 0.0089).
According to the SGA scale, more than 4.5 times higher risk of severe malnutrition was observed
in patients with stage T4 neoplasm (OR = 4.71; p = 0.0063). The G allele presence was associated with a
significantly higher (approximately 31-fold) risk of severe malnutrition (OR = 30.95; p = 0.0013). On the
other hand, the presence of the A allele significantly reduced (more than 14-fold) the risk of severe
disturbances in the nutritional status (OR = 0.07; p = 0.0213) (Table 2).
Pobrano z Repozytorium Uniwersytetu Medycznego w Lublinie / Downloaded from Repository of Medical University of Lublin 2021-11-17J. Clin. Med. 2020, 9, 4041 6 of 14
Table 2. Impact of the clinical-demographic, nutritional and genetic factors on the subjective global assessment (SGA) score.
SGA
Variable p p
A B or C A or B C
OR [95%CI] OR [95%CI]
Male 11 (18.64%) 48 (81.36%) 0.1418 39 (66.10%) 20 (33.90%) 0.3907
Gender
Female 4 (40.00%) 6 (60.00%) 0.34 [0.08–1.43] 8 (80.00%) 2 (20.00%) 0.49 [0.09–2.51]
≥65 9 (31.03%) 20 (68.67%) 0.1173 18 (62.07%) 11 (37.93%) 0.3603
Age (years)
1 3 (30.00%) 7 (70.00%) 0.60 [0.13–2,65] 5 (50.00%) 5 (50.00%) 2.47 [0.63–9.64]
Yes 5 (17.24%) 24 (82.76%) 0.4428 16 (55.17%) 13 (44.83%) 0.0530
Alcohol consumption
No 10 (25.00%) 30 (75.00%) 0.62 [0.19–2.08] 31 (77.50%) 9 (22.50%) 0.36 [0.13–1.01]
Smoker 8 (15.69%) 43 (84.31%) 0.0466 * 32 (62.75%) 19 (37.25%) 0.1178
Smoking status
Non-smoker 7 (38.89%) 11 (61.11%) 2.29 [0.09–0.98] 15 (83.33%) 3 (16.67%) 0.34 [0.09–1.32]
Yes 8 (28.57%) 20 (71.43%) 0.4967 19 (67.86%) 9 (32.14%) 0.9696
Concurrent C-RT
No 7 (17.07%) 34 (82.93%) 1.94 [0.61–6.17] 28 (68.29%) 13 (31.71%) 0.98 [0.35–2.75]
AA 11 (37.93%) 18 (62.07%) 0.0089 * 28 (96.55%) 1 (3.45%) 0.0013 *
GA or GG 4 (10.00%) 36 (90.00%) 5.50 [1.53–19.71] 19 (47.50%) 21 (52.50%) 30.95 [3.83–249.96]
ITGAM genotype
GG - 6 (100.00%) 0.3412 1 (16.67%) 5 (83.33%) 0.0213 *
AA or GA 15 (23.81%) 48 (76.19%) 0.24 [0.01–4.52] 46 (73.02%) 17 (26.98%) 0.07 [0.01–0.68]
*-statistically significant results.
Pobrano z Repozytorium Uniwersytetu Medycznego w Lublinie / Downloaded from Repository of Medical University of Lublin 2021-11-17J. Clin. Med. 2020, 9, 4041 7 of 14
3.2. Factors Affecting the Nutritional Risk According to NRS Scale
None of the examined factors (demographic, clinical, genetic) had a statistically significant
influence on the risk of a higher degree (≥3) of nutritional risk according to the NRS scale (Table 3).
Table 3. Impact of the clinical-demographic, nutritional and genetic factors on the nutrition risk
screening (NRS).
NRS
Variable pJ. Clin. Med. 2020, 9, 4041 8 of 14
Table 4. Impact of the clinical-demographic, nutritional and genetic factors on the critical weight
loss (CWL).
Critical Weight Loss (CWL)
Variable p
No Yes
OR [95%CI]
Male 38 (64.41%) 21 (35.59%) 0.7888
Gender
Female 6 (60.00%) 4 (40.00%) 1.21 [0.31–4.76]
≥65 18 (62.07%) 11 (37.93%) 0.8026
Age (years)J. Clin. Med. 2020, 9, 4041 9 of 14
Figure 1. Impact of ITGAM on patients’ overall survival: differences in overall survival between groups
of patients with GG and AA or GA genotype.
Table 5. Factors affecting overall survival.
Log-Rank Test
Factor Univariate Analysis Multivariate Analysis #
HR [95%CI] p HR [95%CI] p
Gender (male) 1.35 [0.58–3.11] 0.4710 1.18 [0.41–3.40] 0.7599
Age (≥65 years) 1.92 [0.99–3.71] 0.0225 * 1.62 [0.83–3.17] 0.1618
Smoking history (yes) 0.69 [0.34–1.40] 0.2290 0.66 [0.32–1.36] 0.2631
Smoking during treatment (yes) 1.50 [0.28–7.91] 0.6838 0.85 [0.42–1.72] 0.6572
Alcohol consumption (yes) 0.78 [0.42–1.44] 0.4063 0.79 [0.41–1.54] 0.4972
Performance status (>0) 1.83 [0.71–4.75] 0.1029 1.05 [0.39–2.80] 0.9283
Tumor location (oropharyngeal) 1.05 [0.56–1.94] 0.8787 0.98 [0.50–1.94] 0.9587
Tumor location (larynx) 0.93 [0.51–1.70] 0.7967 0.95 [0.50–1.83] 0.8860
T stage (T4) 1.21 [0.66–2.23] 0.5045 0.95 [0.48–1.86] 0.8714
N stage (N1–3) 1.15 [0.62–2.16] 0.6391 1.11 [0.54–2.26] 0.7781
17.19
M stage (M1) 0.0001 * 6.03 [0.52–69.64] 0.1520
[0.01–53382.20]
TNM stage (IV) 5.82 [0.93–36.55]J. Clin. Med. 2020, 9, 4041 10 of 14
normal nutritional status, significantly higher Body Mass Index (BMI) values were observed compared
to patients with moderate or severe malnutrition (SGA A vs. B or C) (25.0 vs. 21.5 kg/m2 ; p = 0.0001).
In patients with good nutritional status, significantly higher albumin values were noted compared
to subjects with moderate or severe malnutrition (SGA A vs. B or C) (3.8 vs. 3.3 g/l; p < 0.0001).
In the group of patients with moderate or severe malnutrition, the value of the Normalized Fat-Free
Mass Index (nFFMI) index was lower than in the group of patients with normal nutritional status
(SGA B or C vs. A) (16.4 vs. 17.4 kg/m2 ; p < 0.0275). In patients with normal nutritional status and
with moderate malnutrition, a significantly higher BMI was demonstrated compared to the group with
severe malnutrition (SGA A or B vs. C) (24.4 vs. 21.2 kg/m2 ; p < 0.0234). In the group of patients
without malnutrition and with moderate malnutrition, the concentration of albumin was significantly
higher than in patients with severe malnutrition (SGA A vs. B or C) (3.4 vs. 3.2 g/l; p < 0.0011)
(Supplementary Table S2).
3.7. Comparisons of Demographic, Clinical and Nutritional Variables According to NRS
Patients at low risk of being subjected to nutritional treatment had a higher body weight compared
to patients at high risk of getting nutritional treatment (NRS < 3 vs. ≥3) (68.0 vs. 59.5 kg; p < 0.0208).
Patients at low risk of being subjected to nutritional treatment had a higher BMI compared to patients
at high risk of getting nutritional treatment (NRS < 3 vs. ≥3) (23.1 vs. 19.7 kg/m2 ; p < 0.0026). In the
group of patients at low risk of receiving nutritional treatment, the FFMI index was significantly higher
than in patients with high risk of getting nutritional treatment (NRS < 3 vs. ≥3) (16.7 vs. 16.1 kg/m2 ;
p < 0.0353). The nutritional value of the nFFMI index was significantly higher compared to patients at
high risk of being subjected to nutritional treatment (NRS < 3 vs. ≥3) (17.4 vs. 16.5 kg/m2 ; p < 0.0291)
(Supplementary Table S3).
3.8. Comparisons of Demographic, Clinical and Nutritional Variables According to CWL
The group of patients with CWL showed significantly lower body weight compared to those
without CWL (61.5 vs. 69.0 kg; p = 0.0400). A significantly lower value of the FFM index was also
demonstrated in patients with CWL (45.6 vs. 53.1 kg/m2 ; p = 0.0123). In the case of CWL patients,
significantly lower FFMI values were demonstrated (16.5 vs. 17.3 kg/m2 ; p = 0.0206). Patients with
CWL showed a significantly lower value of the nFFMI parameter compared to patients without critical
weight loss (17.1 vs. 18.5 kg/m2 ; p = 0.0425) (Supplementary Table S3).
4. Discussion
A characteristic process associated with neoplastic disease development is malnutrition, which
often turns into cancerous cachexia. This condition is associated primarily with a significant loss
of muscle mass and adipose tissue. Cancer cachexia is usually irreversible even after nutritional
treatment has been instituted and is the leading cause of death in the group of patients diagnosed with
cancer [1–4]. Additional symptoms that are characteristic of neoplastic cachexia are emerging anemia,
anorexia, weakness and deterioration of the patient’s mental state. The treatment used in patients
diagnosed is less effective and in the case of radiotherapy or chemotherapy is associated with a higher
risk of adverse effects [6,7]. This disease is characteristic of cancers of the lung, liver or the head and
neck region. Symptoms of cancerous cachexia are diagnosed in 52% of patients with advanced-stage
HNC disease. If the available cancer treatment is used: RT, CTH or C-RT, this percentage ranges from
44% to 88% in patients with HNC [18,19]. The pathomechanism of neoplastic cachexia is based mainly
on the increased demand of the body’s cells for energy, leading to the predominance of catabolic
processes while reducing appetite. The development of inflammation has a great influence on the
mechanism of the development of nutritional disorders [1–4]. Then, the following inflammatory
cytokines increase the increase of production: INF-γ, TNF-α, IL-1β and IL-6. These mediators have
been found to be involved in the mechanisms responsible for the breakdown of muscle fibers in the
Ubiquitin-Proteasome Pathway (UPP) by activating the muscle atrophy F box (MAFbx) ligase and
Pobrano z Repozytorium Uniwersytetu Medycznego w Lublinie / Downloaded from Repository of Medical University of Lublin 2021-11-17J. Clin. Med. 2020, 9, 4041 11 of 14
muscle ring-finger 1 (MuRF1) genes. Inflammation has also been confirmed to be important in the
breakdown of adipose tissue. Increased production of TNF-α is associated with an increase in the
number of fat cells undergoing apoptosis and a decrease in the rate of lipogenesis.
Interacting with IL-1 reduces the transport of glucose and free fatty acids into cells, which is
associated with reduced synthesis of adipose tissue. IL-6 is also involved in the catabolism of both
adipose tissue and muscle tissue. Determining the level of this interleukin may be of great importance
in assessing the nutritional status and further prognosis [8,14,15].
Treatment and other clinical or genetic factors may contribute to weight loss in patients with HNC.
In the case of RT, i.a., Baseline BMI, tumor location, histopathological type, age, or gender may cause
differences in the level of weight loss in individual patients. CWL usually develops in patients treated
with C-RT, exposed to higher doses of ionizing radiation (>65 Gy) [20]. CWL is also found at BMI > 25
(OR: 3.00; p < 0.0001), more often in patients with advanced HNC (T3-T4) (OR: 1.68; p = 0.0300) and
with cancer of the throat or mouth (OR: 3.12; p < 0.0001) [21].
The main task of the ITGAM gene is coding the αMβ2-integrin chain. Therefore, it is of key
importance in the activation of leukocytes, their migration and adhesion. CD11b is involved in the
regulation of B-cell signaling and the function of INF-γ receptors, Toll-like receptors, B-cell receptors and
Fcγ receptors. This molecule is essential in the pathomechanism of autoimmune diseases, most often
SLE [14]. ITGAM may influence the production of inflammatory cytokines. High expression of ITGAM
is observed on APCs. In the case of low expression of ITGAM on the surface of APCs, there is an
increased production of IL-6 and, as a consequence, activation of T lymphocytes and an increase in the
production of IL-17 [15]. A similar correlation has been found in the case of the increased production
of the other pro-inflammatory factors, i.e., IL-1β, TNF α and IFN β [22].
The increased levels of IL-6 contribute to the increased activation of the JAK/STAT pathway,
especially the STAT-3 domain, which is involved in the breakdown of muscle fibers. The involvement
of IL-6 in STAT-3 signaling and its participation in sarcopenia development translates into increased
weight loss. Additionally, this mechanism contributes to the development of malnutrition and cachexia
in patients diagnosed with cancer. The study by GuneyEskiler et al. involved 18 patients with lung,
stomach or breast cancer with concomitant neoplastic cachexia, 30 patients without accompanying
symptoms of cachexia and 25 healthy people. A higher IL-6 gene expression level was confirmed
in patients with cachexia developing during the studied neoplasms compared to the group without
cachexia and healthy people. A similar correlation was noted in the case of transcription factor STAT-3
expression in the group of patients with breast, lung or stomach cancer with neoplastic cachexia
compared to patients with these types of neoplasms without cachexia and healthy people [11]. Another
study assessed the level of IL-6 (protein) in serum samples of 94 people with cachexia and in a group
of 16 people not diagnosed with cachexia. Higher levels of IL-6, IL-8, IL-1β and TNFα have been
demonstrated in patients with confirmed cachexia. There was also a positive correlation between IL-6
levels and weight loss [23]. In another study, 26 male BALB/c mice had colon cancer cells injected
subcutaneously to induce neoplastic disease, causing the development of severe cachexia. In some
of the mice, subcutaneous injections of antibodies against the IL-6 receptor were performed, and the
control group consisted of mice subcutaneously injected with saline. The study assessed the level
of IL-6 and the level of free fatty acids (FFA) to assess the effect of this cytokine on the breakdown
of adipose tissue in the initial and advanced stages of cancer. Increased IL-6 and FFA levels were
noted in mice with developing neoplasm, both in the early and late stages. On the other hand, in mice
with anti-IL-6 receptor antibodies, inhibition of cytokine-dependent lipolysis and browning of adipose
tissue was observed. Additionally, an increase in the expression of genes responsible for the decay of
the carcass tissue was found in cachexia’s initial phase (Hsl, Cgi58 and Atgl) [24]. In addition to Il-6,
other cytokines play a significant role in disturbing the metabolism of adipose tissue, thus determining
both the reduction of fatty acid production (IL-1) and adipocyte apoptosis (TNF-α) [25].
The study by Zhang et al. concerned the role of SNP -634C>G of the IL-6 gene in a group
of 128 patients diagnosed with pancreatic cancer in the assessment of cancer cachexia. Cachexia
Pobrano z Repozytorium Uniwersytetu Medycznego w Lublinie / Downloaded from Repository of Medical University of Lublin 2021-11-17J. Clin. Med. 2020, 9, 4041 12 of 14
was confirmed in 67.46% of the patients. A significantly more frequent cachexia occurrence was
found in carriers of the G allele (20% vs. 8%, p = 0.021). Moreover, OS in patients with GG and CG
genotypes was significantly shorter than in patients with CC variant of this gene (p = 0.023). However,
no significant correlation was confirmed between the -634C>G polymorphism of the IL-6 gene and
other demographic and clinical factors (e.g., age, weight, degree of advancement or C Reactive Protein
(CRP) level). The above study did not show a significant correlation between the other tested IL-6
SNPs and the occurrence of cachexia in the course of pancreatic cancer [26].
In the study by Powrózek et al., SNP for TNF-α –1031T/C (rs 1799964) was determined in a
group of 62 patients with HNC undergoing RT. Patients with the CC genotype had a significantly
higher risk of cachexia (OR = 3.724 p = 0.019). According to the SGA scale, significantly higher risk
of disturbances in nutritional status occurred in patients with the C allele (CC and CT) compared
to TT homozygotes (OR = 13.29; p = 0.0001). A significant decrease in body weight was found in
patients with the CC genotype (p = 0.045) compared to the other variants. In patients with the CC
genotype, a significant increase in serum TNF-α level (p = 0.006) and a decrease in total protein
level (p = 0.044) were confirmed. Moreover, the authors showed a significant correlation between
the C allele’s presence and an increased risk of developing nutritional disorders, including cachexia,
in patients with HNC (OR = 9.737; p = 0.044). For CC homozygotes, a 38-fold increase in the risk
of qualifying for grade 3 or 4 risk of malnutrition on the NRS scale was demonstrated (p = 0.015).
The same genotype also determined the shortening of the OS compared to the CT and TT genotypes
(28 vs. 38 months, HR = 3.63; p = 0.013) [27].
In the case of determining the SNP for SELP - 2028 C/T (rs3917647), the study group consisted of
66 people diagnosed with and treated for HNC. According to the SGA scale, HNC patients with the CC
genotype had a significantly higher risk of severe malnutrition (OR = 4.04, p = 0.015). In patients with the
CC genotype receiving parenteral nutrition, a higher risk of low BMI values (A) may be a
useful marker in assessing the risk of nutritional disorders in patients with HNC undergoing RT.
Pobrano z Repozytorium Uniwersytetu Medycznego w Lublinie / Downloaded from Repository of Medical University of Lublin 2021-11-17J. Clin. Med. 2020, 9, 4041 13 of 14
Described limitations (including mainly small sample size) do not allow indisputable conclusions to be
drawn and our results should be further investigated in a larger study group for confirmation.
5. Conclusions
Determination of the ITGAM SNP (-323G>A) may be a useful marker in the assessment of the risk
of nutritional disorders in patients with HNC undergoing RT.
Supplementary Materials: The following are available online at http://www.mdpi.com/2077-0383/9/12/4041/s1,
Table S1. Distribution of demographic, clinical and nutritional variable saccording to ITGAM genotypes. Table S2.
Distribution of demographic, clinical and nutritional variables according to SGA. Table S3. Distribution of
demographic, clinical and nutritional variables according to NRS and CWL.
Author Contributions: Conceptualization, M.M., R.M., T.P. and T.M.-M.; data curation, M.M., R.M., I.H.-M., T.P.,
A.B. and P.G.; investigation, M.M., R.M., I.H.-M., T.P., A.B. and P.G.; methodology, M.M., R.M., I.H.-M., T.P., A.B.,
P.G. and T.M.-M.; software, M.M.; writing—original draft, M.M., R.M. and T.M.-M.; Writing—review and editing,
R.M. and T.M.-M. All authors have read and agreed to the published version of the manuscript.
Funding: This research received no external funding.
Acknowledgments: This research received no grant from any funding agency in public, commercial or
not-for-profit sectors.
Conflicts of Interest: The authors declare no conflict of interest.
References
1. Vigneswaran, N.; Williams, M.D. Epidemiologic trends in head and neck cancer and aids in diagnosis.
Oral Maxillofac. Surg. Clin. N. Am. 2014, 26, 123–141. [CrossRef]
2. Marur, S.; Forastiere, A.A. Head and neck cancer: Changing epidemiology, diagnosis, and treatment.
Mayo Clin. Proc. 2008, 83, 489–501. [CrossRef] [PubMed]
3. Marur, S.; Forastiere, A.A. Head and Neck Squamous Cell Carcinoma: Update on Epidemiology, Diagnosis,
and Treatment. Mayo Clin. Proc. 2016, 91, 386–396. [CrossRef] [PubMed]
4. Kouloulias, V.; Thalassinou, S.; Platoni, K.; Zygogianni, A.; Kouvaris, J.; Antypas, C.; Efstathopoulos, E.; Nikolaos, K.
The treatment outcome and radiation-induced toxicity for patients with head and neck carcinoma in the IMRT era:
A systematic review with dosimetric and clinical parameters. Biomed. Res. Int. 2013, 2013. [CrossRef]
5. Ghosh, G.; Gupta, G.; Malviya, A.; Saroj, D. Comparison three-dimensional conformal radiotherapy versus
intensity modulated radiation therapy in local control of head and neck cancer. J. Cancer Res. Ther. 2018. [CrossRef]
6. Wang, X.; Eisbruch, A. IMRT for head and neck cancer: Reducing xerostomia and dysphagia. J. Radiat. Res.
2016, 57, i69–i75. [CrossRef]
7. Ghosh-Laskar, S.; Yathiraj, P.H.; Dutta, D.; Rangarajan, V.; Purandare, N.; Gupta, T.; Budrukkar, A.;
Murthy, V.; Kannan, S.; Agarwal, J.P. Prospective randomized controlled trial to compare 3-dimensional
conformal radiotherapy to intensity-modulated radiotherapy in head and neck squamous cell carcinoma:
Long-term results. Head Neck 2016, 38, E1481–E1487.
8. Gorenc, M.; Kozjek, N.R.; Strojan, P. Malnutrition and cachexia in patients with head and neck cancer treated
with (chemo)radiotherapy. Rep. Pract. Oncol. Radiother. 2015, 20, 249–258. [CrossRef]
9. Al-Mamgani, A.; Van Rooij, P.; Verduijn, G.M.; Mehilal, R.; Kerrebijn, J.D.; Levendag, P.C. The impact of
treatment modality and radiation technique on outcomes and toxicity of patients with locally advanced
oropharyngeal cancer. Laryngoscope 2013. [CrossRef]
10. Ni, J.; Zhang, L. Cancer cachexia: Definition, staging, and emerging treatments. Cancer Manag. Res. 2020,
12, 5597–5605. [CrossRef]
11. Guney Eskiler, G.; Bezdegumeli, E.; Ozman, Z.; Deveci Ozkan, A.; Bilir, C.; Kucukakca, B.; Ince, M.; Men, A.;
Aktas, O.; Horoz, Y.; et al. IL-6 mediated JAK/STAT3 signaling pathway in cancer patients with cachexia.
Bratisl. Lek. Listy 2019, 120, 819–826. [CrossRef]
12. Narsale, A.; Carson, J. Role of IL-6 In Cachexia—Therapeutic Implications. Curr. Opin. Support. Palliat. Care
2015, 8, 321–327. [CrossRef]
Pobrano z Repozytorium Uniwersytetu Medycznego w Lublinie / Downloaded from Repository of Medical University of Lublin 2021-11-17J. Clin. Med. 2020, 9, 4041 14 of 14
13. Jager-Wittenaar, H.; Dijkstra, P.U.; Dijkstra, G.; Bijzet, J.; Langendijk, J.A.; van der Laan, B.F.A.M.;
Roodenburg, J.L.N. High prevalence of cachexia in newly diagnosed head and neck cancer patients:
An exploratory study. Nutrition 2017, 35, 114–118. [CrossRef] [PubMed]
14. Rosetti, F.; De La Cruz, A.; Crispín, J.C. Gene-function studies in systemic lupus erythematosus.
Curr. Opin. Rheumatol. 2019, 31, 185–192. [CrossRef] [PubMed]
15. Fan, Y.; Li, L.H.; Pan, H.F.; Tao, J.H.; Sun, Z.Q.; Ye, D.Q. Association of ITGAM polymorphism with systemic
lupus erythematosus: A meta-analysis. J. Eur. Acad. Dermatol. Venereol. 2011, 25, 271–275. [CrossRef]
16. Maiti, A.K.; Kim-Howard, X.; Motghare, P.; Pradhan, V.; Chua, K.H.; Sun, C.; Arango-Guerrero, M.T.;
Ghosh, K.; Niewold, T.B.; Harley, J.B.; et al. Combined protein-and nucleic acid-level effects of rs1143679
(R77H), a lupus-predisposing variant within ITGAM. Hum. Mol. Genet. 2014. [CrossRef]
17. Langius, J.A.E.; Bakker, S.; Rietveld, D.H.F.; Kruizenga, H.M.; Langendijk, J.A.; Weijs, P.J.M.; Leemans, C.R.
Critical weight loss is a major prognostic indicator for disease-specific survival in patients with head and
neck cancer receiving radiotherapy. Br. J. Cancer 2013, 109, 1093–1099. [CrossRef]
18. Maria, O.M.; Eliopoulos, N.; Muanza, T. Radiation-Induced Oral Mucositis. Front. Oncol. 2017, 7, 89.
19. Le, Z.; Niu, X.; Chen, Y.; Ou, X.; Zhao, G.; Liu, Q.; Tu, W.; Hu, C.; Kong, L.; Liu, Y. Predictive single nucleotide
polymorphism markers for acute oral mucositis in patients with nasopharyngeal carcinoma treated with
radiotherapy. Oncotarget 2017. [CrossRef]
20. Langius, J.A.E.; Twisk, J.; Kampman, M.; Doornaert, P.; Kramer, M.H.H.; Weijs, P.J.M.; Leemans, C.R. Prediction
model to predict critical weight loss in patients with head and neck cancer during (chemo)radiotherapy.
Oral Oncol. 2016, 52, 91–96. [CrossRef]
21. Lønbro, S.; Petersen, G.B.; Andersen, J.R.; Johansen, J. Prediction of critical weight loss during radiation
treatment in head and neck cancer patients is dependent on BMI. Support. Care Cancer 2016, 24, 2101–2109.
[CrossRef] [PubMed]
22. Khan, S.Q.; Khan, I.; Gupta, V. CD11b activity modulates pathogenesis of lupus nephritis. Front. Med. 2018,
5, 1–7. [CrossRef] [PubMed]
23. Hou, Y.-C.; Wang, C.-J.; Chao, Y.-J.; Chen, H.-Y.; Wang, H.-C.; Tung, H.-L.; Lin, J.-T.; Shan, Y.-S. Elevated Serum
Interleukin-8 Level Correlates with Cancer-Related Cachexia and Sarcopenia: An Indicator for Pancreatic
Cancer Outcomes. J. Clin. Med. 2018, 7, 502. [CrossRef] [PubMed]
24. Haddad, F.; Zaldivar, F.; Cooper, D.M.; Adams, G.R. IL-6-induced skeletal muscle atrophy. J. Appl. Physiol.
2005, 98, 911–917. [CrossRef]
25. George, J.; Cannon, T.; Lai, V.; Richey, L.; Zanation, A.; Hayes, D.N.; Shores, C.; Guttridge, D.; Couch, M.
Cancer cachexia syndrome in head and neck cancer patients: Part II. Pathophysiology. Head Neck 2007,
29, 497–507. [CrossRef]
26. Zhang, D.; Zhou, Y.; Wu, L.; Wang, S.; Zheng, H.; Yu, B.; Li, J. Association of IL-6 gene polymorphisms
with cachexia susceptibility and survival time of patients with pancreatic cancer. Ann. Clin. Lab. Sci. 2008,
38, 113–119.
27. Powrózek, T.; Mlak, R.; Brzozowska, A.; Mazurek, M.; Goł˛ebiowski, P.; Małecka-Massalska, T. Relationship
between TNF-α-1031T/C gene polymorphism, plasma level of TNF-α, and risk of cachexia in head and neck
cancer patients. J. Cancer Res. Clin. Oncol. 2018, 144, 1423–1434. [CrossRef]
28. Powrózek, T.; Mlak, R.; Brzozowska, A.; Mazurek, M.; Goł˛ebiowski, P.; Małecka-Massalska, T. Relationship
between—2028 C/T SELP Gene Polymorphism, Concentration of Plasma P-Selectin and Risk of Malnutrition
in Head and Neck Cancer Patients. Pathol. Oncol. Res. 2019, 25, 741–749. [CrossRef]
Publisher’s Note: MDPI stays neutral with regard to jurisdictional claims in published maps and institutional
affiliations.
© 2020 by the authors. Licensee MDPI, Basel, Switzerland. This article is an open access
article distributed under the terms and conditions of the Creative Commons Attribution
(CC BY) license (http://creativecommons.org/licenses/by/4.0/).
Pobrano z Repozytorium Uniwersytetu Medycznego w Lublinie / Downloaded from Repository of Medical University of Lublin 2021-11-17You can also read