Characteristics, Comorbidities, and Data Gaps for Coronavirus Disease Deaths, Tennessee, USA
←
→
Page content transcription
If your browser does not render page correctly, please read the page content below
SYNOPSIS

       Characteristics, Comorbidities,
       and Data Gaps for Coronavirus
      Disease Deaths, Tennessee, USA
                   John James Parker, Rany Octaria, Miranda D. Smith, Samantha J. Chao,
             Mary Beth Davis, Celia Goodson, Jon Warkentin, Denise Werner, Mary-Margaret A. Fill

                                                                   hypertension, diabetes, respiratory disease, cancer,
  As of March 2021, coronavirus disease (COVID-19)
                                                                   kidney disease, and obesity have been associated
  had led to >500,000 deaths in the United States, and
  the state of Tennessee had the fifth highest number of           with death; however, the strength of this association
  cases per capita. We reviewed the Tennessee Depart-              has differed among studies (5,7). Although world-
  ment of Health COVID-19 surveillance and chart-ab-               wide racial and ethnic minorities account for a higher
  straction data during March 15‒August 15, 2020. Pa-              proportion of COVID-19 deaths, the independent im-
  tients who died from COVID-19 were more likely to be             pact of race and ethnicity is unclear (8).
  older, male, and Black and to have underlying condi-                   Challenges with data collection and reporting
  tions (hereafter comorbidities) than case-patients who           have made it difficult to delineate some characteris-
  survived. We found 30.4% of surviving case-patients              tics of COVID-19 deaths. According to an assessment
  and 20.3% of deceased patients had no comorbid-                  of surveillance data reported to the Centers for Dis-
  ity information recorded. Chart-abstraction captured
                                                                   ease Control and Prevention (CDC), 58.9% of patients
  a higher proportion of deceased case-patients with
                                                                   had missing comorbidity information (6). Because
  >1 comorbidity (96.3%) compared with standard sur-
  veillance deaths (79.0%). Chart-abstraction detected             public health agencies gather their surveillance in-
  higher rates of each comorbidity except for diabetes,            formation from local laboratories and healthcare fa-
  which had similar rates among standard surveillance              cilities; the completeness of their data are contingent
  and chart-abstraction. Investing in public health data           on the local agencies obtaining and transmitting the
  collection infrastructure will be beneficial for the CO-         information (9,10). Consequently, mortality rate stud-
  VID-19 pandemic and future disease outbreaks.                    ies often focus on medical record reviews from single
                                                                   institutions and urban centers (11–13).

A    s of March 5, 2021, the total of deaths from coro-
     navirus disease (COVID-19) reached 2,564,560
worldwide, 515,013 in the United States (1), and
                                                                         To better distinguish the characteristics of
                                                                   COVID-19 deaths, during March 15, 2020–May 19,
                                                                   2020, the Tennessee Department of Health (TDH) im-
11,534 in Tennessee (2). Tennessee has been particu-               plemented a supplemental chart-abstraction process
larly affected by the pandemic; as of March 5, 2021,               for COVID-19 deaths in Tennessee. This study re-
this state had the fifth highest number of cases per               views TDH COVID-19 surveillance data and the sup-
100,000 residents in the United States (3). The mortal-            plemental chart review data to describe the character-
ity rate for COVID-19 infection varies greatly based               istics of COVID-19 deaths in Tennessee. In addition,
on patient characteristics (4,5). Age and preexist-                this study evaluates the value of a supplemental chart
ing health conditions (hereafter comorbidities) have               review process during disease outbreak surveillance.
been associated with increased risk for death from
COVID-19 (5–7). Cardiovascular disease (CVD),                      Methods
                                                                   Our study describes TDH public health data that was
Author affiliations: Tennessee Department of Health, Nashville,      collected as part of COVID-19 surveillance. Defini-
Tennessee, USA (J.J. Parker, R. Octaria, M.D. Smith, S.J. Chao,    tions and protocols in place were defined by the TDH,
M.B. Davis, C. Goodson, J. Warkentin, D. Werner, M.-M.A. Fill);    who used CDC guidelines for their definitions of con-
Vanderbilt University Medical Center, Nashville (J.J. Parker)      firmed cases, probable cases, and COVID-19 deaths
                                                                   (14). Confirmed case-patients in Tennessee were de-
DOI: https://doi.org/10.3201/eid2710.211070
                                                                   fined as persons who had SARS-CoV-2 detected by

                           Emerging Infectious Diseases • www.cdc.gov/eid • Vol. 27, No. 10, October 2021            2521
SYNOPSIS
using real-time reverse transcription PCR. Probable other underlying conditions. Therefore, we believe
case-patients were persons who had a positive anti- there is value in comparing comorbidity frequencies
gen test result for a respiratory specimen or persons between the data collection groups.
who had no positive PCR result but met the vital re- Next, we added the additional chart-abstraction
cords criteria or clinical criteria and had close contact comorbidities to NBS to enable data entry. We then
to a COVID-19 case-patient during the 14 days before requested the medical records of all COVID-19 pa-
illness onset (15). COVID-19 deaths were defined as tients who died before May 19, 2020; 5 physicians
case-patients whose death certificate lists COVID-19 and 1 family medicine nurse practitioner reviewed
or SARS-CoV-2 as an underlying cause of death or a the available medical records. The provider group
major condition contributing to death (16). only reviewed complete records that included at least
The sample included confirmed and probable a complete history and physical or complete death
cases in Tennessee residents who had COVID-19. We summary. This provider group abstracted the in-
conducted investigations during March 15, 2020–Au- formation from the charts and added comorbidities
gust 15, 2020. Data analysis began on September 15; found in the medical records to the NBS database. If
we used a minimum 4-week lag time to best ensure there was no mention of a comorbidity, we assumed
that case-patients were categorized as alive or de- that the person did not have an underlying condition.
ceased. Our primary objective was to evaluate the However, when charts had gaps in documentation,
baseline characteristics and comorbidities of persons the medical providers included comorbidities if there
who died from COVID-19 in Tennessee. A secondary was clear evidence that the patient had a condition.
objective was to compare the type and quantity of For example, if a patient’s chart had minimal medical
data obtained through standard disease surveillance history documented but had chronic problems listed
and a supplemental chart review process. The TDH in a note’s plans, those problems were recorded as
Institutional Review Board (TDH-IRB# 2020–0251) preexisting conditions. The group met and decided
approved this study as minimal risk and waived the on definitions of diseases, and if there was any ques-
need for individualized consent. tion on how a disease should be categorized, the in-
dividual provider would consult the group. For haste
Data Collection of getting this information to public health leader-
As part of routine data entry for all COVID-19 cases, ship, the provider’s chart-abstraction work was not
trained TDH employees completed the Human Infec- reviewed by a second party. After completing their
tion with 2019 Novel Coronavirus Case Report Form review, the providers updated the information from
(CRF) (https://www.cdc.gov/coronavirus/2019- the CRF and added additional comorbidity data into
ncov/downloads/pui-form.pdf) (17) and entered the NBS. Data from the supplemental chart review proj-
information into the National Electronic Disease Sur- ect were labeled as chart-abstracted. Preliminary data
veillance System Base System (NBS; https://www. from the chart review project were presented to TDH
cdc.gov/nbs/index.html). Information gathered in- leadership at the end of May 2020.
cluded patient characteristics, symptoms, comorbidi-
ties, and clinical course. (The terms preexisting condi- Data Characterization and Analysis
tion and comorbidity were used by TDH to indicate We grouped COVID-19 case-patients into 3 groups:
medical conditions that were present before COVID-19 alive (living) case-patients, standard surveillance
infection; these terms are used interchangeably in this COVID-19 deaths, and chart-abstracted COVID-19
article.) Data collected through the CRF was the TDH deaths (Figure 1). All COVID-19 cases (n = 130,040)
standard COVID-19 disease surveillance. during the study period were included in demograph-
In addition, during the first few months of the pan- ic analysis (Table 1). The comorbidity analysis (Tables
demic, the TDH created a supplemental chart review 2, 3; Appendix 2, https://wwwnc.cdc.gov/EID/
process to better classify the comorbidities and char- article/27/10/21-1070-App2.pdf) excluded case-pa-
acteristics of deceased patients. This chart-abstraction tients who had no comorbidity information recorded
project began with a group of public health profes- by only selecting cases with >1 answers completed in
sionals creating a list of 20 comorbidities to supple- the comorbidity or preexisting condition sections (n
ment the information in the standard CRF (Appendix = 89,270). In both the standard surveillance and the
1, https://wwwnc.cdc.gov/EID/article/27/10/21- chart-abstraction process, if comorbidity data in the
1070-App1.pdf). The chart review process creates line CRF was partially completed, blank items were listed
items for additional comorbidities. However, the CRF as not having that condition. For race/ethnicity, we
has 2 free text items for other chronic diseases and defined White as White race, non-Hispanic ethnicity,
2522 Emerging Infectious Diseases • www.cdc.gov/eid • Vol. 27, No. 10, October 2021Characteristics for Coronavirus Disease Deaths
Figure 1. Data categorization
flow diagram for characteristics,
comorbidities, and data gaps
for coronavirus disease deaths,
Tennessee, USA. COVID-19,
coronavirus disease; EMS,
emergency medical services; TDH,
Tennessee Department of Health.
and Black as Black race, non-Hispanic ethnicity. We χ2 or Fisher exact tests, as appropriate, for categori-
defined Hispanic as all races that selected Hispanic cal variables and t-test for continuous variables and
ethnicity. For our race/ethnicity comorbidity analysis performed statistical analyses by using SAS version
(Tables 2, 3; Appendix 2), we excluded all other races 9.4 (SAS Institute, https://www.sas.com).
because there were only 6 case-patients in the chart-
abstracted group who were not identified as White, Results
Black, or Hispanic. During the study period, we identified 131,854
We converted comorbidities from CRFs and the COVID-19 case-patients. We excluded 1,813 case-
chart-abstraction protocol into dichotomous variables patients because of either non-Tennessee residency
for each condition. For the chart-abstracted deaths, we or death from other causes. Of the 130,040 included
provided definitions of CVD and chronic lung disease case-patients, 1,812 (1.4%) died from COVID-19.
(CLD) (Table 3) (18–20); for standard surveillance of Deaths of COVID-19 case-patients were more likely
COVID-19 deaths, we selected preexisting conditions, to be in older, male, and Black case-patients than liv-
including CVD and CLD, on the basis of self-reports. ing case-patients (Table 1). The prevalence of >1 un-
Obesity was not included in the comorbidity analysis derlying condition was higher for deceased patients
because the body mass index cutoffs differed between (64.8%) than for living patients (22.6%), and this trend
CRF and the chart-abstraction process. We calculated was true for all age groups. There were 38,949 (30.4%)
days to hospitalization by determining the difference living case-patients and 369 (20.3%) deceased case-
in days between illness onset date and hospitalization patients who did not have any comorbidity informa-
admission date for patients who were hospitalized; tion recorded. Therefore, for the comorbidity analysis
we counted negative values (i.e., tested positive af- (Tables 2, 3; Appendix 2), we excluded case-patients
ter hospitalization) as 0 and excluded probable cases who did not have comorbidity data (Figure 1).
from this calculation. We calculated days to specimen We found a difference in the case-fatality rate
collection by determining the difference between the (CFR) for COVID-19 by race and ethnicity (White
first specimen collection date for the PCR that had a 1.9%, Black 2.6%, and Hispanic 0.5%) (Table 2). The
positive result for SARS-CoV-2 and the illness onset mean age of living and deceased patients also dif-
date among for confirmed case-patients; probable fered by race; for deceased patients the average age
case-patients were excluded from this calculation. was 75.6 years for White patients, 69.5 years for Black
We report patient characteristics as frequencies patients, and 61.3 years for Hispanic patients. After
and proportions for categorical variables and median stratifying by age, we found that Black patients con-
and interquartile range for continuous variables. We tinued to have the highest CFR. However, Hispanic
compared characteristics between groups by using case-patients >65 years of age had a CFR similar to or
Emerging Infectious Diseases • www.cdc.gov/eid • Vol. 27, No. 10, October 2021 2523SYNOPSIS
Table 1. Characteristics of coronavirus disease patients in Tennessee, USA, March 15–August 15, 2020
Characteristic Living, n = 128,228 Deceased, n = 1,812
Race and ethnicity, no. (%)
White, non-Hispanic 56,271 (43.9) 1,093 (60.3)
Black, non-Hispanic 26,697 (20.8) 540 (29.8)
Hispanic (all races) 21,390 (16.7) 126 (7.0)
All other races 8,155 (6.4) 49 (2.7)
Unknown 15,715 (12.3) 4 (0.2)
Sex, no. (%)
F 64,966 (50.7) 789 (43.5)
M 62,100 (48.4) 1,023 (56.5)
Unknown 1,162 (0.9) 0
Age group, y, no. (%)
0–20 21,703 (16.9) 4 (0.2)
21–64 93,486 (72.9) 451 (24.9)
65−80 10,080 (7.9) 706 (39.0)
>81 2,820 (2.2) 651 (35.9)
Unknown 139 (0.1) 0
Age group, y, has any comorbidity, no. (%)*
21–64† 20,844 (22.3) 252 (55.9)
65–80 5,043 (50.0) 467 (66.2)
>81 1441 (51.1) 454(69.7)
All age groups 28,925 (22.6) 1,174 (64.8)
Incomplete comorbidity data, no. (%)‡ 38,949 (30.4) 369 (20.3)
Mean (SD) days to hospitalization§ 3.9 (5.4) 3.2 (5.8)
Mean (SD) days for obtaining specimen 1.8 (3.7) 1.8 (4.1)
*Includes persons who have incomplete comorbidity; data counted as having no comorbidity.
†Cell percent is the percentage within that age group (i.e., for living case-patients 21–64 years of age, the percentage is 20,844/94,486).
‡Incomplete comorbidity data were defined as any chart without a single recorded response for any preexisting condition or comorbidity.
§Days to hospitalization for living patients are only calculated for case-patients hospitalized because of coronavirus disease (n = 5,379).
higher than that for White patients (Table 2). Hispan- 40.6%), CLD (29.8% vs. 20.5%), cancer (10.6% vs. 4.3%),
ic patients had the lowest rate of underlying medi- and chronic renal disease (27.1% vs. 19.0%). However,
cal conditions (64.3%) compared with White patients there was minimal difference in proportion of case-
(85.7%) and Black patients (91.3%). However, His- patients who had diabetes (39.9% vs. 36.6%). Data for
panic case-patients had the highest percent increase chart-abstracted deaths showed a higher proportion of
in number of comorbidities when comparing stan- current/former smoking (30.3% vs. 15.3%) when com-
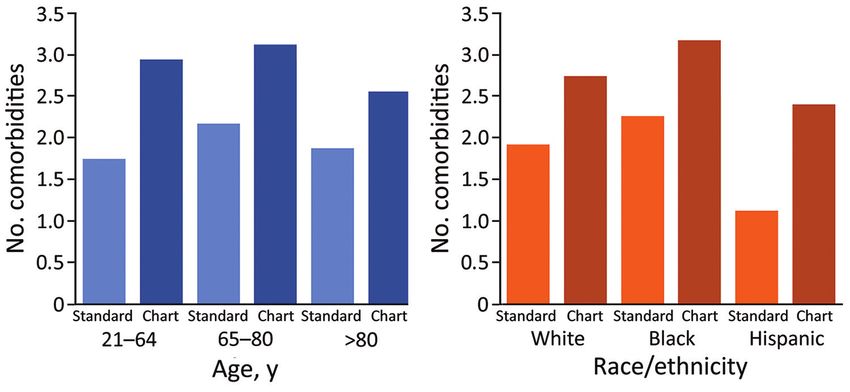
dard surveillance and chart-abstraction (Figure 2). pared with the standard surveillance group.
During March 15, 2020–May 19, 2020, there were
355 deaths; 188 of these patients who died had com- Discussion
plete medical records available for chart abstraction. Our findings demonstrate that Tennessee has similar
Standard surveillance and chart abstraction had com- COVID-19 demographic trends to those that have been
parable frequencies of race/ethnicity, proportion of found throughout the United States (21,22). In our sam-
females, and age (Table 3). Chart abstraction detected ple, the average age of case-patients who died was 72.9
a higher proportion of case-patients with >1 comor- years compared with 38.4 years for the surviving cas-
bidity (96.3%) compared with standard surveillance es. Black patients were disproportionately affected by
deaths (79.0%) (Table 3). After stratifying by race and COVID-19; at the time of our analysis, 29.8% of deaths
age, we found that chart abstraction still found more were in Black persons , but only 17.1% of the population
comorbidities in each age group and race group (Fig- of Tennessee identifies as Black (23). Hispanic patients
ure 2; Appendix 2). Compared with standard surveil- accounted for 7.0% of deaths and 5.7% of the population
lance, chart-abstracted deaths had a higher proportion in Tennessee; White patients represented 60.3% of the
of hypertension (76.6% vs. 50.2%), CVDs (54.3% vs. deaths but 73.5% of the population (23).
Table 2. Case-fatality rate stratified by race and age for characteristics, comorbidities, and data gaps for coronavirus disease deaths, Tennessee, USA
Characteristic White, non-Hispanic, n = 46,677 Black, non-Hispanic, n = 16,669 Hispanic, n = 17,084
Mean age, y (interquartile range) 40 (25‒57) 37 (25‒52) 32 (21‒45)
Age group, y, case-fatality rate, no. (%)* 896 (1.9) 428 (2.6) 84 (0.5)
21‒64† 145 (0.4) 140 (1.1) 42 (0.3)
65‒80 344 (5.9) 176 (12.1) 31 (9.0)
>81 406 (19.6) 112 (28.6) 10 (18.2)
*There was 1 death for a White patient (Characteristics for Coronavirus Disease Deaths
Table 3. Characteristics and comorbidities for patients with coronavirus disease, Tennessee, USA*
Coronavirus disease deaths
Characteristic Standard surveillance, n = 1,255 Chart-abstracted, n = 188
Race and ethnicity, no. (%)†
White, non-Hispanic 787 (62.7) 109 (58.0)
Black, non-Hispanic 365 (29.1) 63 (33.6)
Hispanic (all races) 74 (5.9) 10 (5.3)
Sex, no. (%)
F 549 (43.7) 79 (42.0)
M 706 (56.3) 109 (58.0)
Mean age, y, (SD) 73.6 (13.9) 72.7 (14.4)
Current/former smoker, no. (%) 192 (15.3) 57 (30.3)
Mean no. (SD) comorbidities 2.0 (1.5) 2.9 (1.6)
Age group, y, has any comorbidity, no. (%)†
21–64: Nss = 284; Nca = 50 205 (72.2) 47 (94.0)
65–80: Nss = 505; Nca = 63 404 (80) 62 (98.4)
>81: Nss = 465; Nca = 74 382 (82.2) 72 (97.3)
All ages: Nss = 1,254; Nca = 188 991 (79.0) 181 (96.3)
Comorbidities, no. (%)
Hypertension 630 (50.2) 144 (76.6)
Cardiovascular disease‡ 509 (40.6) 102 (54.3)
Chronic lung disease§ 257 (20.5) 56 (29.8)
Diabetes mellitus 459 (36.6) 75 (39.9)
Obesity 156 (12.4) 42 (22.3)
Cancer 54 (4.3) 20 (10.6)
Chronic renal disease 238 (19.0) 51 (27.1)
Chronic liver disease 34 (2.7) 6 (2.7)
Immunocompromised 76 (6.1) 18 (9.6)
Autoimmune diseases 21 (1.7) 8 (4.3)
HIV/AIDS 5 (0.4) 1 (0.5)
*Nca, no. patients who had chart abstraction for that age group; Nss, no. patients who had standard surveillance for that age group.
†Cell percent is the percentage in that age group (i.e., for standard surveillance case-patients 21–64 years of age, the percentage is 205/284).
‡Defined as coronary artery disease, cerebrovascular, peripheral artery disease, heart failure, cardiomyopathies, valvular disease, myocarditis, and
arrythmias. Hypertension is listed separately.
§Defined as asthma, chronic obstructive pulmonary disease, emphysema, pulmonary hypertension, interstitial fibrosis, or sarcoidosis.
We also found major differences in CFRs for ary to systemic health and social inequities that have
race/ethnicity: Hispanic patients had the lowest CFR limited access to chronic disease management and
(0.5%) compared with that for White patients (1.9%) increased the rate of COVID infection for these popu-
and Black patients (2.6%). The lower CFR for Hispanic lations, rather than inherent difference between races
patients differs from US aggregate data, in which His- and ethnicities (28).
panic patients have a 2.8 times higher rate of death The trend in Tennessee for comorbidities for
than do White patients (24). In Tennessee, Hispanic COVID-19 patients who died also mirrors the rest of
patients were younger than Black and White patients, the nation (29); 22.6% of surviving case-patients had
and because age is the strongest predictor of death comorbidities, compared with 64.8% of those who
from COVID-19 (5,11,25), the age difference might died. After stratifying by age, we found that a higher
explain this difference in CFR for Hispanic patients percentage of deceased case-patients still had an un-
in Tennessee. After stratifying by age, we found that derlying condition than did living case-patients. Hy-
Hispanic case-patients had CFRs similar to those for pertension, CVD, CLD, cancer, chronic renal disease,
White case-patients, but Black case-patients main- diabetes, and a history of smoking were more com-
tained the highest CFR. In a similar fashion, CDC mon among deceased case-patients (Appendix 1).
data have demonstrated that Hispanic patients had These correlations have been found in other studies
the largest increase in CFR once adjusted for age (21). and systemic reviews in the United States and world-
Studies have demonstrated that race and ethnicity are wide, which have had major implications for public
associated with COVID-19 infection and death (8,26). health messaging and vaccine allocation (29).
However, several reviews of in-hospital death data The chart review process detected higher num-
have demonstrated that race/ethnicity is not an in- bers of comorbidities than standard surveillance.
dependent risk factor for death after admission to the In the standard surveillance group, 79.0% had a
hospital (11,26,27). Taken together, these data sug- comorbidity, compared with 96.3% in the chart-
gest that the disproportionate burden of COVID-19 abstracted group. The difference between the standard
deaths among racial and ethnic minorities is second- surveillance and chart-abstracted group probably
Emerging Infectious Diseases • www.cdc.gov/eid • Vol. 27, No. 10, October 2021 2525SYNOPSIS
Figure 2. Number of
comorbidities by age, race, and
type of review for characteristics,
comorbidities, and data gaps
for coronavirus disease deaths,
Tennessee, USA.
reflects issues with self-reporting and data collection. abstractions to obtain accurate information for His-
In a CDC review of COVID-19 deaths during Febru- panic and non–English speaking patients during dis-
ary 12–May 18, 2020, a total of 58.9% of patients had ease surveillance.
missing comorbidity information according to CRF- We observed notable trends in the prevalence
based surveillance data (6). In our study, 30.4% of liv- of certain comorbidities in the standard surveillance
ing case-patients and 20.3% of deceased case-patients deaths compared with the chart-abstracted deaths.
had no comorbidity data recorded. The prevalence of For example, hypertension, CVD, and CLD were de-
deceased patients who had an underlying condition tected in higher frequencies in the chart-abstracted
in our chart-abstracted group (96.3%) is similar to that group, and diabetes had similar rates in chart-abstrac-
for CDC COVID-19 hospitalization records (COVID- tion and standard surveillance. Similarly, in multiple
NET), which found 405 (96.4%) of 420 deaths had an studies worldwide comparing self-reports and medi-
underlying medical condition (25). This finding em- cal records, diabetes was the disease with the highest
phasizes that medical chart-abstraction data collects concordance (32–34); hypertension and CVD are fre-
higher rates of comorbidity data than does standard quently underreported in self-reports (32,35). There-
public health surveillance and is a more comprehen- fore, diabetes is probably better captured by standard
sive representation of baseline characteristics among interview-based surveillance than other comorbidities.
COVID-19 patients. A meta-analysis of 87 studies determined that diabetes
For each race and age group, we found a higher was the comorbidity that had the highest association
number of comorbidities recorded with chart abstrac- with COVID-19 deaths (36). Diabetes certainly increas-
tion than with standard surveillance (Figure 2). In the es risk for COVID-19 deaths, but it is possible that the
standard surveillance group, Hispanic patients had a high accuracy of diabetes disease reporting could dis-
lower number of comorbidities than White and Black proportionately increase the association between dia-
patients. Other studies have reported mixed results; betes and COVID-19 death compared with other co-
Hispanic COVID-19 patients who died had more morbidities. In addition, there is mixed evidence about
or fewer comorbidities than non-Hispanic patients whether hypertension is an independent risk factor for
(25,27). In our chart-abstracted group, the total num- death (29); part of this difference could be explained
ber of comorbidities for Hispanic patients was twice by data collection and inaccurate reporting by patients.
that of the standard surveillance group, which was One limitation of our study is that we used a
the largest increase for race/ethnicity (Appendix 2). convenience sample of COVID-19 cases collected by
For the standard surveillance group, information was the TDH, which led to collection biases. For our co-
gathered by in person or telephone conversations. morbidity analysis, we excluded cases without any
Therefore, language barriers and concerns about dis- comorbidity information, which led to selection bias.
closure of information are 2 possible explanations for Our chart-abstracted study occurred at the beginning
the lower number of comorbidities recorded. It has of the pandemic and does not capture the burden of
been shown that non-English–speaking patients are COVID-19 for certain ethnic and geographic groups
more likely to have inaccurate medical information, who had more cases later in the pandemic. For ex-
to receive lower quality care, and are at a higher risk ample, there were 126 deaths in Hispanic COVID-19
for medical errors that result in harm (30,31). Taken patients and only 10 patients in the Hispanic chart-
together, our findings demonstrate the value of chart abstracted group. Furthermore, our chart-abstracted
2526 Emerging Infectious Diseases • www.cdc.gov/eid • Vol. 27, No. 10, October 2021Characteristics for Coronavirus Disease Deaths
study relied on medical charts, which created selec- In addition, certain diseases and patient groups are
tion bias and missed patients who died outside hos- frequently underreported in standard surveillance,
pitals. There might be certain groups who are more which skews public health data. These data gaps can
likely to have out-of-hospital deaths, but these deaths miss at risk groups and can lead to unadvised pub-
were not evaluated in our study. The data collection lic health action. Investment in data collection infra-
process was different for the standard surveillance structure that collects more timely and complete data
deaths and the chart-abstracted deaths, which limited will equip public health institutions, governmental
the validity of comparing the frequencies of charac- organizations, and the scientific community with ac-
teristics and comorbidities. Despite these limitations, curate information required to mitigate disease bur-
we analyzed a large number of patients, and ana- den in COVID-19 and future outbreaks.
lyzed COVID-19 demographic trends for Tennessee
for comparison to other states. In addition, our chart- Acknowledgments
abstraction analysis is a description of a public health We thank members of the Division of Communicable and
study that met its goal to capture additional informa- Environmental Disease and Emergency Preparedness,
tion compared with standard surveillance. Tennessee Department of Health for their support in data
Our chart-based analysis showed that comorbidi- collection and storage.
ties related to COVID-19 deaths are more prevalent
than those identified by standard public health disease
About the Author
surveillance. Furthermore, certain patient informa-
tion tends to be reported less accurately in standard Dr. Parker is an internal medicine and pediatric resident at
surveillance than in chart-based analysis. However, Vanderbilt University Medical Center, Nashville, TN. His
chart-based reviews are labor and time intensive, and primary research interest is COVID-19.
the COVID-19 pandemic has highlighted how public
health agencies are understaffed and underfunded (9). References
One solution for the challenges of data collection in 1. World Health Organization. Coronavirus disease, 2020 [cited
public health disease surveillance is expansion of elec- 2021 Mar 5]. https://covid19.who.int
2. Tennessee Department of Health. Data dashboard, Jan 10,
tronic case reporting. This type of reporting uses an
2020 [cited 2021 Mar 5]. https://www.tn.gov/health/cedep/
interoperable, shared service infrastructure to enable ncov/data.html
automated real-time exchange of information from 3. Johns Hopkins Coronavirus Resource Center. All state
electronic medical records to public health agencies comparison of testing efforts, Jul 6, 2021 [cited 2021 Mar 5].
https://coronavirus.jhu.edu/testing/states-comparison
(37). In traditional case reporting, the most cases are
4. Jin J, Agarwala N, Kundu P, Harvey B, Zhang Y,
reported from laboratories who lack detailed informa- Wallace E, et al. Individual and community-level risk for
tion on case demographics and often send their reports COVID-19 mortality in the United States. Nat Med.
by paper copy. Therefore, public health departments 2021;27:264–9. https://doi.org/10.1038/s41591-020-01191-8
5. Williamson EJ, Walker AJ, Bhaskaran K, Bacon S, Bates C,
receive incomplete information, which creates data
Morton CE, et al. Factors associated with COVID-19-related
gaps and distorted data, which is also apparent in our death using OpenSAFELY. Nature. 2020;584:430–6.
findings. In contrast, electronic case reporting provides https://doi.org/10.1038/s41586-020-2521-4
faster and more complete data from healthcare insti- 6. Wortham JM, Lee JT, Althomsons S, Latash J, Davidson A,
Guerra K, et al. Characteristics of persons who died with
tutions while decreasing the burden on reporters and
COVID-19—United States, February 12–May 18, 2020.
public health departments (37). During the COVID-19 MMWR Morb Mortal Wkly Rep. 2020;69:923–9.
pandemic, there has been increased uptake in electron- https://doi.org/10.15585/mmwr.mm6928e1
ic case reporting, and continuing this trend is essential 7. Deng G, Yin M, Chen X, Zeng F. Clinical determinants
for fatality of 44,672 patients with COVID-19. Crit Care.
for effective disease surveillance (38).
2020;24:179. https://doi.org/10.1186/s13054-020-02902-w
Throughout the COVID-19 pandemic, data col- 8. Pan D, Sze S, Minhas JS, Bangash MN, Pareek N, Divall P,
lected by public health agencies have been integral et al. The impact of ethnicity on clinical outcomes in COVID-19:
in identifying trends and providing information to a systematic review. EClinicalMedicine. 2020;23:100404.
https://doi.org/10.1016/j.eclinm.2020.100404
health agencies (39). The surveillance data from Ten-
9. Dixon BE, Caine VA, Halverson PK. Deficient response to
nessee demonstrate trends in age, comorbidities, and COVID-19 makes the case for evolving the public health
race/ethnicity that mirror the rest of the country, system. Am J Prev Med. 2020;59:887–91. https://doi.org/
and this data been used to protect those at highest 10.1016/j.amepre.2020.07.024
10. Centers for Disease Control and Prevention. Improving
risk for severe COVID-19 disease. Our study showed
public health Surveillance, 2020 [cited 2021 Jun 2].
that chart abstraction collects more comorbidity data https://www.cdc.gov/surveillance/improving-surveil-
than standard public health disease surveillance. lance/index.html
Emerging Infectious Diseases • www.cdc.gov/eid • Vol. 27, No. 10, October 2021 2527SYNOPSIS
11. Price-Haywood EG, Burton J, Fort D, Seoane L. COVID-19 mortality. EClinicalMedicine. 2020;25:100455.
Hospitalization and mortality among black patients and https://doi.org/10.1016/j.eclinm.2020.100455
white patients with COVID-19. N Engl J Med. 2020;382:2534– 27. xKabarriti R, Brodin NP, Maron MI, Guha C, Kalnicki S,
43. https://doi.org/10.1056/NEJMsa2011686 Garg MK, et al. Association of race and ethnicity with
12. Richardson S, Hirsch JS, Narasimhan M, Crawford JM, comorbidities and survival among patients with COVID-19
McGinn T, Davidson KW, et al.; Northwell COVID-19 at an urban medical center in New York. JAMA Netw
Research Consortium. Presenting characteristics, Open. 2020;3:e2019795. https://doi.org/10.1001/
comorbidities, and outcomes among 5,700 patients jamanetworkopen.2020.19795
hospitalized with COVID-19 in the New York City 28. Centers for Disease Control and Prevention. Communities,
area. JAMA. 2020;323:2052–9. https://doi.org/10.1001/ schools, workplaces, and events, 2020 [cited 2020 Dec 13].
jama.2020.6775 https://www.cdc.gov/coronavirus/2019-ncov/
13. Mueller JT, McConnell K, Burow PB, Pofahl K, Merdjanoff AA, community/health-equity/race-ethnicity.html
Farrell J. Impacts of the COVID-19 pandemic on rural 29. Centers for Disease Control and Prevention. COVID-19 and
America. Proc Natl Acad Sci U S A. 2021;118:2019378118. your health, 2020 [cited 2020 Dec 12]. https://www.cdc.gov/
https://doi.org/10.1073/pnas.2019378118 coronavirus/2019-ncov/need-extra-precautions/
14. Centers for Disease Control and Prevention. Coronavirus evidence-table.html
disease 2019 (COVID-19), 2020. Interim case definition, 30. Divi C, Koss RG, Schmaltz SP, Loeb JM. Language
approved August 5, 2020 [cited 2021 Feb 13]. proficiency and adverse events in US hospitals: a pilot study.
https://ndc.services.cdc.gov/case-definitions/ Int J Qual Health Care. 2007;19:60–7. https://doi.org/
coronavirus-disease -2019-2020-08-05 10.1093/intqhc/mzl069
15. Council of State and Editorial Epidemiologists. Interim- 31. Green AR, Nze C. Language-based Inequity in health care: who
20-ID-02_COVID-19. [cited 2020 Sep 8]. https://cdn.ymaws. is the “poor historian”? AMA J Ethics. 2017;19:263–71.
com/www.cste.org/resource/resmgr/ps/positionstatement https://doi.org/10.1001/journalofethics.2017.19.3.medu1-1703
2020/Interim-20-ID-02_COVID-19.pdf 32. Frost M, Wraae K, Gudex C, Nielsen T, Brixen K, Hagen C,
16. Tennessee Department of Health. COVID-19 case definition et al. Chronic diseases in elderly men: underreporting
[cited 2021 Jul 6]. https://www.tn.gov/content/dam/tn/ and underdiagnosis. Age Ageing. 2012;41:177–83.
health/documents/cedep/novel-coronavirus/COVID- https://doi.org/10.1093/ageing/afr153
Case-Definition.pdf 33. van den Akker M, van Steenkiste B, Krutwagen E,
17. Centers for Disease Control and Prevention. pui-form [cited Metsemakers JFM. Disease or no disease? Disagreement on
2020 Jun 6]. https://www.cdc.gov/coronavirus/2019-ncov/ diagnoses between self-reports and medical records of adult
downloads/pui-form.pdf patients. Eur J Gen Pract. 2015;21:45–51. https://doi.org/
18. American Heart Association. What is cardiovascular 10.3109/13814788.2014.907266
disease? [cited 2020 Dec 14]. https://www.heart.org/en/ 34. Kriegsman DM, Penninx BW, van Eijk JT, Boeke AJ, Deeg DJ.
health-topics/consumer-healthcare/what-is-cardiovascular- Self-reports and general practitioner information on the
disease presence of chronic diseases in community dwelling elderly.
19. World Health Organization. About cardiovascular diseases A study on the accuracy of patients’ self-reports and on
[cited 2020 Dec 14]. https://www.who.int/cardiovascular_ determinants of inaccuracy. J Clin Epidemiol. 1996;49:1407–
diseases/about_cvd/en/ 17. https://doi.org/10.1016/S0895-4356(96)00274-0
20. World Health Organization. Chronic respiratory diseases 35. Peterson KL, Jacobs JP, Allender S, Alston LV, Nichols M.
[cited 2020 Dec 14]. https://www.who.int/westernpacific/ Characterising the extent of misreporting of high blood
health-topics/chronic-respiratory-diseases pressure, high cholesterol, and diabetes using the
21. Centers for Disease Control and Prevention. COVID-19 Australian Health Survey. BMC Public Health. 2016;16:695.
provisional counts: health disparities, 2020 [cited 2020 Dec https://doi.org/10.1186/s12889-016-3389-y
13]. https://www.cdc.gov/nchs/nvss/vsrr/covid19/ 36. Corona G, Pizzocaro A, Vena W, Rastrelli G, Semeraro F,
health_disparities.htm Isidori AM, et al. Diabetes is most important cause for
22. Centers for Disease Control and Prevention. COVID-19 mortality in COVID-19 hospitalized patients: systematic
provisional counts: weekly updates by select demographic review and meta-analysis. Rev Endocr Metab Disord.
and geographic characteristics, 2020 [cited 2020 Dec 13]. 2021;22:275–96. https://doi.org/10.1007/s11154-021-09630-8
https://www.cdc.gov/nchs/nvss/vsrr/covid_weekly/ 37. Centers for Disease Control and Prevention. How does
index.htm electronic case reporting work? 2020 [cited 2021 Feb 15].
23. US Census Bureau. Quick Facts Tennessee [cited 2020 Dec https://www.cdc.gov/ecr/index.html
12]. https://www.census.gov/quickfacts/TN 38. American Medical Association. Why it’s essential to
24. Centers for Disease Control and Prevention. COVID-19 improve data collection and reporting [cited 2021 Feb 15].
hospitalization and death by race/ethnicity, 2020 [cited 2020 https://www.ama-assn.org/delivering-care/public-health/
Dec 23]. https://www.cdc.gov/coronavirus/2019-ncov/ why-it-s-essential-improve-data-collection-and-reporting
covid-data/investigations-discovery/hospitalization- 39. Centers for Disease Control and Prevention. Coronavirus
death-by-race-ethnicity.html disease 2019 (COVID-19): transmission, 2020 [cited 2020
25. Kim L, Garg S, O’Halloran A, Whitaker M, Pham H, Dec 26]. https://www.cdc.gov/coronavirus/2019-ncov/
Anderson EJ, et al. Risk Factors for intensive care unit covid-data/faq-surveillance.html
admission and in-hospital mortality among hospitalized
adults identified through the U.S. coronavirus disease Address for correspondence: J.J. Parker, Attn: Mary-Margaret
2019 (COVID-19)–associated Hospitalization Surveillance
Fill, 710 James Robertson Pkwy, 4th Fl, Andrew Johnson
Network (COVID-NET). Clin Infect Dis. 2021;72:e206–14.
https://doi.org/10.1093/cid/ciaa1012 Tower, Communicable and Environmental Diseases and
26. Golestaneh L, Neugarten J, Fisher M, Billett HH, Emergency Preparedness, Nashville, TN 37243, USA; email:
Gil MR, Johns T, et al. The association of race and jjparker847@gmail.com
2528 Emerging Infectious Diseases • www.cdc.gov/eid • Vol. 27, No. 10, October 2021Article DOI: https://doi.org/10.3201/eid2710.211070
Characteristics, Comorbidities, and Data
Gaps for Coronavirus Disease Deaths,
Tennessee, USA
Appendix 1
Case Report Form, Preexisting Conditions Section
This form was completed in standard surveillance and chart-abstraction
Supplemental Chart Review: Additional comorbidity questions
Page 1 of 2Page 2 of 2
Article DOI: https://doi.org/10.3201/eid2710.211070

        Characteristics, Comorbidities, and Data
         Gaps for Coronavirus Disease Deaths,
                   Tennessee, USA
Appendix 2

Table 1. Characteristics and comorbidities of living and deceased patients who had coronavirus disease and completed comorbidity
information
                                                                                        Outcome
 Characteristic                                                 Living, n = 89,279                 Deceased, n = 1,443
 Race and ethnicity, no. (%)*
    White, non-Hispanic                                           46,677 (52.3)                          896 (62.1)
    Black, non-Hispanic                                           16,699 (18.7)                          428 (29.7)
    Hispanic (all races)                                          17,084 (19.1)                            84 (5.8)
 Sex, no. (%)
    F                                                             45,857 (51.4)                          628 (43.5)
    M                                                             42,950 (48.1)                          815 (56.5)
     Unknown                                                         472 (0.5)                              0 (0.0)
 Age, y (mean)                                                      38.9 (19.3)                          73.5 (13.9)
 Current/former smoker, no. (%)                                   10,731 (12.0)                          249 (17.3)
 Mean (SD) no. comorbidities                                         0.5 (0.9)                            2.1 (1.6)
 Age group, y, has any comorbidity, no. (%)                       28,898 (32.4)                         1,172 (81.2)
    81 (living = 2,122, deceased = 539)                           1,437 (67.7)                          453 (84.0)
     Pending (living = 41, deceased 0)                                5 (12.2)                         Not available
 Comorbidities, no. (%)
    Hypertension                                                  11,675 (12.1)                          774 (53.6)
    Cardiovascular disease†                                         4,672 (5.2)                          611 (42.3)
    Chronic lung disease‡                                           5,935 (6.7)                          313 (21.7)
    Diabetes mellitus                                               7,393 (8.3)                          534 (37.0)
    Obesity                                                         2,899 (3.3)                          198 (13.7)
    Cancer                                                           330 (0.4)                             74 (5.1)
    Chronic kidney disease                                          1,112 (1.3)                           289 (2.0)
    Chronic liver disease                                            614 (0.7)                             39 (2.7)
    Immunocompromised                                               1,309 (1.5)                            94 (6.5)
    Autoimmune diseases                                             1,089 (1.2)                            29 (2.0)
    HIV/AIDS                                                         21 (0.02)                              6 (0.4)
*Race and ethnicity breakdown for other races is the remaining group breakdown not listed.
†Defined as coronary artery disease, cerebrovascular, peripheral artery disease, heart failure, cardiomyopathies, valvular disease, myocarditis, and
arrythmias. Hypertension is listed separately.
‡Defined as asthma, chronic obstructive pulmonary disease, emphysema, pulmonary hypertension, interstitial fibrosis, or sarcoidosis.

                                                                  Page 1 of 3
Table 2. Breakdown of race-stratified comorbidities among living and deceased coronavirus disease patients who had comorbidities and
ethnicity information*
Living, n = 80,460 Deceased, n = 1,408
White, non- Black, non- White, non- Black, non-
Hispanic, n Hispanic, n = Hispanic, n Hispanic, n = Hispanic, n = Hispanic,
Characteristic = 46,677 16,669 = 17,084 896 428 n= 84
Median age, y, (interquartile range) 40 (25–57) 37 (25–52) 32 (21–45) 78 (69–86) 71 (61–80) 63 (51–73)
Mean (SD) days to hospitalization 4.2 (5.6) 3.7 (5.3) 4.4 (4.9) 3.6 (5.8) 3.2 (6.5) 5.2 (4.9)
Mean (SD) days to specimen collection 2.3 (3.8) 2.3 (4.2) 2.8 (4.7) 2.1 (4.6) 2.3 (4.3) 3.2 (3.9)
Age group, y, median (interquartile range)
21–64 0 (0–1) 0 (0–1) 0 (0–0) 2 (0–3) 2 (1–3) 1 (0–2)
65–80 1 (0–2) 1 (0–2) 1(0–1) 2 (1–3) 3 (1–4) 1 (0–2)
>81 1 (0–2) 2 (1–3) 1 (0–2) 2(1–3) 2 (1–3) 1 (0–2)
All ages 0 (0–1) 0 (0–1) 0 (0–0) 2 (1–3) 2 (1–3) 1 (0–2)
Comorbidities, no.(%)
Current/former smoker 6,543 (14.0) 2,076 (12.4) 1,458 (8.5) 162 (18.1) 71 (16.6) 8 (9.5)
Hypertension 6,908 (14.8) 3.268 (19.6) 904 (5.3) 454 (50.7) 280 (65.4) 27 (32.1)
Cardiovascular disease 3,197 (6.9) 974 (5.8) 238 (1.4) 404 (45.1) 182 (42.5) 14 (16.7)
Chronic lung disease 3,676 (7.9) 1,394 (8.4) 511 (3.0) 217 (24.2) 77 (18.0) 11 (13.1)
Diabetes mellitus 4,036 (8.7) 1,959 (11.7) 949 (5.6) 289 (32.3) 200 (46.7)) 34 (40.5)
Cancer 239 (0.5) 64 (0.4) 16 (0.1) 34 (3.7) 36 (8.4) 2 (2.4)
Chronic renal disease 695 (1.5) 300 (1.8) 66(0.4) 151 (16.9) 124 (28.9) 7 (8.3)
Chronic liver disease 422 (0.9) 94 (0.6) 67 (0.4) 20 (2.2) 14 (3.3) 2 (2.4)
Immunocompromised 851 (1.8) 301 (1.8) 79(0.5) 56 (6.3) 31 (7.3) 2 (2.4)
Autoimmune diseases 841 (1.8) 144 (0.9) 44 (0.3) 23 (2.6) 5 (1.2) 0 (0)
Table 3. Breakdown of race-stratified comorbidities for and deceased coronavirus disease patients who had comorbidities and ethnicity
information
White, non-Hispanic, n = 896 Black, non-Hispanic, n = 428 Hispanic, all races, n = 84
Standard, n = Chart, n Standard, n = Chart, n = Standard, n Chart, n =
Characteristic 787 =109 365 63 = 74 10
Age, mean (SD) 76.6 (12.1) 75.8 (12.5) 69.6 (14.8) 69.4 (14.2) 61.3 (16.0) 60.8 (24.1)
Mean no. comorbidities (SD) 1.9 (1.5) 2.7 (1.4) 2.2 (1.5) 3.1 (1.7) 1.2 (1.3) 2.4 (1.4)
Mean no. days to hospitalization (SD) 2.6 (5.3) 2.7 (4.4) 2.7 (6.4) 2.5 (4.2) 4.2 (4.8) 4.2 (5.0)
Mean (SD) days to specimen collection 2.0 (4.6) 2.5 (4.1) 2.2 (4.3) 2.5 (4.0) 3.2 (3.9) 3.5 (4.4)
Current/former smoker, no. (%) 127 (16.1) 35 (32.1) 52(14.3) 19 (30.2) 7 (9.5) 1 (10.0)
Comorbidities, no. (%)
Hypertension 371 (47.2) 83 (76.2) 227 (62.2) 53 (84.1) 21 (28.4) 6 (60.0)
Cardiovascular disease 343 (43.6) 6 (56.0) 148 (40.6) 34 (55.0) 9 (12.2) 5 (50.0)
Chronic lung disease 187 (23.8) 30 (27.5) 56 (15.3) 21(33.3) 8 (10.8) 3 (30.0)
Diabetes mellitus 255 (32.4) 34 (31.2) 167 (45.8) 33 (52.4) 28 (37.8) 6 (60.0)
Cancer 20 (2.5) 13 (11.9) 30 (8.2) 6 (9.5) 2 (2.7) 0 (0)
Chronic renal disease 125 (15.9) 26 (23.9) 102 (28.0) 22 (34.9) 5 (6.8) 2 (20.0)
Chronic liver disease 17 (2.2) 3 (2.8) 12 (3.3) 2 (3.2) 2 (2.7) 0 (0)
Immunocompromised 47 (6.0) 9 (8.3) 24 (6.6) 7 (11.1) 1 (1.4) 1 (10.0)
Autoimmune diseases 19 (2.4) 4 (3.7) 2 (0.6) 3 (4.8) 0 0
Page 2 of 3Table 4. Breakdown of age-stratified comorbidities for deceased coronavirus disease 19 patients who had comorbidities and ethnicity
information
Standard, n Standard, n Chart, n = Standard, n
Characteristic = 284 Chart, n =50 = 505 63 = 545 Chart, n = 74
Mean no. comorbidities (SD) 1.7 (1.5) 2.9 (1.8) 2.2 (1.6) 3.2 (1.7) 1.9 (1.4) 2.5 (1.2)
Mean no. days to hospitalization (SD) 3.3 (5.2) 3.4 (4.9) 3.3 (6.7) 3.3 (4.5) 1.8 (4.2) 1.7 (3.6)
Mean no. days to specimen collection (SD) 2.8 (4.6) 3.0 (4.3) 2.2 (4.2) 2.9 (4.3) 1.6 (4.5) 2.0 (3.8)
Current/former smoker, no. (%) 37 (13.0) 22 (44.0) 112 (22.2) 21 (33.3) 43 (9.3) 13 (18.9)
Obesity, no. (%) 72 (25.3) 19 (38.0) 62 (12.3) 16 (25.4) 22 (4.7) 7 (9.5)
Comorbidities, no. (%)
Hypertension 132 (46.5) 35 (70.0) 246 (48.7) 49 (77.8) 252 (54.2) 60 (81.1)
Cardiovascular disease 65 (22.9) 18 (36) 224 (44.4) 40 (63.5) 220 (47.3) 43 (58.1)
Chronic lung disease 47 (16.6) 16 (32.0) 116 (23.0) 22 (34.9) 94 (20.2) 17 (23.0)
Diabetes mellitus 113 (39.8) 28 (56.0) 208 (41.2) 32 (50.8) 138 (29.7) 15 (20.3)
Cancer 12 (4.2) 6 (12.0) 27 (5.4) 7 (11.1) 15 (3.2) 7 (9.5)
Chronic renal disease 41 (14.4) 11 (22.0) 104 (20.6) 17 (27.0) 93 (20.0) 23 (31.1)
Chronic liver disease 12 (4.2) 2 (4.0) 17 (3.4) 3 (4.8) 5 (1.1) 0 (0)
Immunocompromised 28 (9.9) 6 (12.0) 27 (5.4) 8 (12.7) 21 (4.5) 4 (5.4)
Autoimmune diseases 5 (1.8( 2 (4.0) 13 (2.6) 3 (4.8) 3 (0.7) 3 (4.1)
Page 3 of 3You can also read