Our New World 2020 BOND - April 2020 - Visual Capitalist

Page created by Harold Schmidt
 
CONTINUE READING
Our New World 2020 BOND - April 2020 - Visual Capitalist
Our New World
    2020
       BOND
     April 2020
Our New World 2020 BOND - April 2020 - Visual Capitalist
April 17, 2020

We are in an environment the likes of which we have not experienced before...

In this informal note, we have compiled observable trends that help form our views of the present and
should provide insights into the future.

Relevant reference points from Internet Trends plus USA, Inc. can be found at bondcap.com.

– Mary, Noah, Mood, Juliet, Daegwon, Paul & the BOND team

Our New World (Outline)
1) Covid-19 = Shock + Aftershocks
2) Viruses + Microbes = Consistent + Periodic Agents of Disaster
3) Creative Innovators (Globally + Together) Will Rise Above the Virus
4) Rapid Changes Drive Growth in Both Directions…
   •   Scientists / Engineers / Domain Experts Get Back More Seats at The Tables
   •   Work-Life Re-Balanced
   •   Digital Transformation Accelerating
   •   Rise of On-Demand Services as Economic Growth Driver Continues (for Consumers + Workers)
   •   Government’s Role in Stabilizing / Stimulating Economy (& Jobs) Must Be Enabled by Modern
       Technologies
   •   2020 = Step-Function Year for Technology + Healthcare?
   •   Traditional Sports = Post Covid-19 Evolution Provides Real-Time Engagement Clues for Other
       Businesses
5) ‘The World Just Doesn’t End That Often’ = We Will Get Through This…But Life Will Be Different…

                                                                                                        1
Our New World 2020 BOND - April 2020 - Visual Capitalist
Our New World

1) Covid-19 = Shock + Aftershocks

Earthquakes are like high-speed zippers that rip open the earth – they can run 138 miles in a minute1 as the San
Francisco Earthquake did in 1906. The big ones transform the way people live.

The shock from Covid-19’s high-speed spread / impact has similarities – as of 4/16/20, in the 94 days since the first
known cases outside of China were reported, 2.1MM people have tested positive globally and 145K have died. 93% of
the world’s 193 countries have reported cases, and governments’ only choice has been to impose unprecedented
social control policies with the hope of ‘flattening the curve.’

                           Covid-19 =
                           Rapid Globalization

                                                                                Number of Countries With Confirmed
                                                                                        Community Cases
                                                            180

                                                            160

                                                            140
                                      Number of Countries

                                                            120

                                                            100

                                                             80

                                                             60

                                                             40

                                                             20

                                                              0
                                                                  1/23   1/30    2/6       2/13      2/20      2/27      3/5      3/12      3/19      3/26       4/2   4/9
                                                                  N=1     1       2           5        5        12        27        47        94       123      149    175

                                                                                  Week (Starting 1/23, Week of China's Lockdown)

                                                                                      Source: Internal analysis as of 4/13/20, John Hopkins University, Worldometer

The top 20 countries by GDP have all implemented some form of social distancing and/or quarantine – in aggregate,
this represents 80% of global GDP and a large portion of the population. Covid-19 has upended our modern lives in
ways we’re just starting to understand.
With an abrupt shock, many of us – other than those who are infected or serving those in need of care – have shifted
from navigating the ‘rat race’ to moving at a relative snail’s pace. We are living in a hunkered down world that in many
ways seems more attuned to life from another era – but in 24x7 streaming global color.
In the face of an enemy on our shores, America has stepped up. Neighbors are looking out for each other.
Philanthropic initiatives (often local) are rolling out to provide stopgap help to those in need until more sustainable
solutions are optimized. And, over 18MM2 healthcare workers are tirelessly and heroically serving on our front lines.
In the aftershock, the economy has also ground to a halt, and job losses are rising rapidly. At current course and
speed, in a few months unemployment could reach levels not seen since the Great Depression almost a century ago.
Nearly one in four American workers are employed in the most affected face-to-face jobs like food service, hospitality,
retail and other services3. As of one month ago, one in five Americans had already lost working hours or jobs4.
Seventy-three percent of Americans have indicated their household income has been reduced5.

         1
             U.S. Geological Survey (USGS) – The Northern California Earthquake, 4/18/1906. 8,300 miles per hour illustratively converted to miles per minute.
                          2
                            CDC. 3 Pew Research 3/27/20. 4 NPR/PBS NewsHour/Marist poll on 3/17/20. 5 FT-Peterson poll, 3/24/20 – 3/27/20.                                   2
                          Note: Throughout we use Covid-19 to refer to both the disease, and the virus (SARS-CoV-2) that causes the disease.
Our New World 2020 BOND - April 2020 - Visual Capitalist
Comparing U.S. unemployment and the stock market of the past 43 trading days with September 1929 – December
1936 (the Great Depression), one finds terrifyingly similar trends in stock market movements while today’s
unemployment levels are spiking at a materially faster clip. Similar shocks have taken place in other advanced
economies, amplifying the knock-on effects to trade that may worsen the global downturn.

                    Unemployment vs. Stock Market Trends =
                    2020 (2/12 – Current) vs. 1929 – 1936

                                                                                                                             USA Unemployment Rate vs.
                                                                                                                         Dow Jones Industrial Average (Indexed)
                                                                                                 120                                                                                                                               30%
                                                  Dow Jones Industrial Average Indexed Returns

                                                                                                 100                                                                                                                               25%

                                                                                                                                                                                                                                           USA Unemployment Rate (%)
                                                                                                  80                                                                                                                               20%

                                                                                                  60                                                                                                                               15%

                                                                                                             >10%
                                                                                                           (Q2:20E)
                                                                                                  40                                                                                                                               10%

                                                                                                                 4.4%
                                                                                                                (3/20)
                                                                                                  20                                                                                                                               5%

                                                                                                   0                                                                                                                               –
                                                                                                    9/1/29            9/1/30        9/1/31         9/1/32           9/1/33                         9/1/34      9/1/35     9/1/36

                                                                                                             DJIA Returns (Peak(Peak
                                                                                                                  DJIA Returns   9/29 Indexed)
                                                                                                                                       9/3/1929 Indexed)                                         DJIA Returns (Peak
                                                                                                                                                                                                  Unemployment      2/12/20
                                                                                                                                                                                                                 Rate (1929 Indexed)
                                                                                                                                                                                                                            - 1936)
                                                                                                                  DJIA Returns
                                                                                                             Unemployment   Rate(Peak
                                                                                                                                 (19292/12/2020
                                                                                                                                        - 1936) Indexed)                                         Umployment  RateRate
                                                                                                                                                                                                  Unemployment    2020(2020)

                                                                                                               Source: St. Louis FRED, BLS, CBO (including Q2:20E unemployment projection from 4/2/20), CapitalIQ as of 4/14/20.

Recent government-imposed containment actions have necessitated government-funded lending / liquidity / stimulus
programs at unprecedented speed, scope, scale and complexity. In its effort to stabilize and stimulate the weakening
economy, the U.S. government has committed over $2 trillion in aid to consumers and the economy while the Federal
Reserve has committed up to $2.3 trillion to expand an existing corporate lending program for small and medium-sized
businesses along with the purchase of municipal bonds. These numbers will likely continue to rise.

                    USA CARES Act (2020) =
                    Largest & Fastest Stimulus Package Ever
                                          Historical USA Stimulus Bills ($B)                                                                                                                 Historical USA Stimulus Bills ($B)
                                                                                                           Nominal Dollars                                                                             Inflation Adjusted Dollars

                                              $3,000                                                                                               40%                                        $3,000
                      Stimulus Dollars ($B)

                                                                                                                                                                     Stimulus Dollars ($B)

                                                                                                   $2,000                                          30%                                                    $2,000
                                              $2,000                                                                                                                                          $2,000                    $1,788
                                                                                                                                                            % GDP

                                                                                                                      $1,500
                                                                                                                                                   20%

                                              $1,000                                                                                                                                          $1,000                                    $826
                                                                                                                                                   10%

                                                                                                                                      $42
                                                 $0                                                                                                –                                             $0
                                                                                                    2020Act Recovery
                                                                                                 CARES          2008 Act New
                                                                                                                          NewDeal
                                                                                                                               Deal                                                                    2020 CARES
                                                                                                                                                                                                        CARES  Act    2008 Act New
                                                                                                                                                                                                                   Recovery       New Deal
                                                                                                                                                                                                                                        Deal
                                                                                                 CARES        & TARP (1933
                                                                                                   (2020)Act Recovery         - 1940)
                                                                                                                          (1933  -                                                                      Act (2020) Recovery
                                                                                                                                                                                                          (2020)     & TARPAct (1933
                                                                                                                                                                                                                                (1933 -- 1940)
                                                                                                                                                                                                                                         1940)
                                                                                                   (2020)      (2009)
                                                                                                                 Act       1940)                                                                                        (2009)
                   Months to Implement 1st
                   Stimulus Package From                                                               1                 10             42
                      Stock Market Peak

                                                                                                                                      Stimulus Dollars ($B)                                        % of GDP

                                                                                                       Source: St. Louis FRED. 2009 – 2020 assumes 1.77% annual inflation. 1933 – 2020 assumes 3.52% annual inflation based on CPI.

                                                                                                                                                                                                                                                                       3
Our New World 2020 BOND - April 2020 - Visual Capitalist
We have a hydra-like crisis – health / economic / psychological – that occurred at a time when many things were
humming (economic growth / consumer spending / employment / wages…) but there weren’t huge margins for error.

 Personal Saving Rate = Rising But 8% vs. 12% Fifty Years Ago…                                                                                                                  USA Public Debt / GDP Level =
 Debt-to-Annual-Income Ratio = 23% vs. 15%                                                                                                                                      8th Highest vs. Major Economies (2018)

          Personal Saving Rate & Debt-to-Annual-Income* Ratio                                                                                                                                           Government Debt                                                   Government Debt
                                                                                                                                                                                    Country           % of GDP          2018 ($B)               Country                   % of GDP   2018 ($B)
                        30%                                                                                                                                                        1) Japan             236%                 $4,971            16) Angola                   89%         $106
                                                                                                                                                                                   2) Sudan              186                     41            17) Brazil                    87         1,869
                                                                                                                                                                                   3) Greece             185                    218            18) Argentina                 86           520
                                                                                     Debt-to-Annual-Income* Ratio
                                                                                                                                                                                   4) Italy              135                  2,084            19) UK                        86         2,855
                                                                                                                                                                                   5) Portugal           122                    241            20) Sri Lanka                 84            89
                                                                                                                                                                                   6) Singapore          110                    364            21) Croatia                   75            61
           Ratio, USA

                                                                                                                                                                                   7) Mozambique         107                     15            22) Zambia                    75            27
                        15%
                                                                                                                                                                                   8) USA                106                 20,544            23) Austria                   74           455
                                                                                                                                                                                   9) Cyprus             101                     25            24) Pakistan                  72           315
                                                                                                                                                                                   10) Belgium           100                    543            25) Slovenia                  70            54
                                                                                                                                                                                   11) France             98                  2,778            26) Hungary                   70           158
                                                                                                                                                                                   12) Spain              98                  1,419            27) India                     69         2,719
                                                                                                       Personal Saving Rate
                                                                                                                                                                                   13) Egypt              93                    251            28) Morocco                   65           118
                        0%                                                                                                                                                         14) Congo              90                     11            29) Ireland                   64           382
                          1969                  1979                  1989                   1999                  2009                   2019
                                                                                                                                                                                   15) Canada             90                  1,713            30) Yemen                     63            27

       Source: St. Louis Federal Reserve FRED Database, USA Federal Reserve Bank. *Consumer debt-to-annual-income ratio = outstanding credit extended to individuals for                                                Source: IMF 2018 Estimate, World Bank GDP data.
         household, family & other personal expenditures, excluding loans secured by real estate vs. average annual personal income. Personal saving rate = percentage of
               disposable personal income (DPI), frequently referred to as “the personal saving rate.” (i.e. the annual share of disposable income dedicated to saving)

For context, the $4.3 trillion in government monetary and fiscal responses is the equivalent of 124% of the American
government’s revenue in 2019 and 20% of GDP. Simplistically, it would take total debt / GDP level to 127% vs. 107%
in 2019. The speck of relative good news here is that interest rates are near record low levels so the near-term annual
cost of the new debt will be relatively low.

                                                 USA Income Statement = Expenses > Revenue for Years…
                                                 -19% Average Net Margin Over 30 Years

                                                                                                                                         USA Income Statement
                                                                                                               F1989             F1994             F1999              F2004     F2009     F2014     F2019     Comments
                                                           Revenue ($B)                                         $991            $1,259              $1,827          $1,880      $2,105    $3,021    $3,463
                                                              Y/Y Growth                                          9%                9%                 6%               5%        (17%)       9%        4%    +5% Y/Y average over 25 years

                                                                Individual Income Taxes*                        $446              $543               $879              $809      $915     $1,395    $1,718    Largest driver of revenue
                                                                   % of Revenue                                  45%               43%                48%               43%       43%        46%       50%
                                                                Social Insurance Taxes                          $359              $461               $612              $733      $891     $1,023    $1,243    Social Security & Medicare payroll tax
                                                                  % of Revenue                                   36%               37%                33%               39%       42%        34%       36%
                                                                Corporate Income Taxes*                         $103              $140               $185              $189      $138      $321      $230     Fluctuates with economic conditions
                                                                  % of Revenue                                   10%               11%                10%               10%        7%       11%        7%
                                                                Other                                             $83             $114               $151              $148      $161      $283      $272     Estate & gift taxes, duties / fees…
                                                                  % of Revenue                                     8%               9%                 8%                8%        8%        9%        8%
                                                           Expense ($B)                                      $1,144             $1,462            $1,702            $2,293      $3,518    $3,506    $4,448
                                                              Y/Y Growth                                         7%                 4%                3%                6%         18%        1%        8%

                                                                Entitlement / Mandatory                         $486              $717               $900           $1,238      $2,093    $2,098    $2,735    Risen owing to rising healthcare costs +
                                                                  % of Expense                                   42%               49%                53%              54%         60%       60%       61%    aging population

                                                                Non-Defense Discretionary                       $208              $255               $312              $463      $846      $573      $853     Education / law enforcement /
                                                                  % of Expense                                   18%               17%                18%               20%       24%       16%       19%     transportation / general government…

                                                                Defense                                         $304              $282               $275              $456      $661      $603      $686     2009 increase driven by War on Terror
                                                                  % of Expense                                   27%               19%                16%               20%       19%       17%       15%
                                                                Net Interest on Public Debt                     $169              $203               $230              $160      $187      $229      $375     Recent benefit of historic low interest
                                                                  % of Expense                                   15%               14%                14%                7%        5%        7%        8%
                                                           Surplus / Deficit ($B)                             ($153)            ($203)               $126            ($413)    ($1,413)   ($485)    ($985)    -19% average net margin, 1989-2019
                                                              Net Margin (%)                                    (15%)             (16%)                7%              (22%)      (67%)     (16%)     (28%)

                                                                                                         Source: Congressional Budget Office, White House Office of Management and Budget.
                                                                      *Individual & corporate income taxes include capital gains taxes. Note: USA federal fiscal year ends in September. Non-defense discretionary includes federal
                                                                                                                spending on education, infrastructure, law enforcement, judiciary functions.

                                                                                                                                                                                                                                                                                                 4
Our New World 2020 BOND - April 2020 - Visual Capitalist
USA Total Federal Debt as % of GDP =                                                                                                       USA Interest Rates =
 @ 107% & Rising (2019)                                                                                                                     Near Historic Lows…Total Federal Debt at Historic High

                                                              Total Federal Debt % of US GDP                                                               Effective Federal Funds Rate (%) vs. Total Federal Debt ($B)
                                         140%
                                                                                                                                                                                                  20%                                                                             $25,000

                                                                                                                                                   Effective Federal Funds Rate (%) – Blue Line
                                                WWII

                                                                                                                                                                                                                                                                                            Total Federal Debt ($B) – Black Shading
                                         120%
                                                                                                                                                                                                                                                                                  $20,000
        Total Federal Debt % of US GDP

                                                                                                                                                                                                  15%
                                         100%

                                                                                                                                                                                                                                                                                  $15,000
                                         80%
                                                                                                                                                                                                  10%

                                         60%                                                                                                                                                                                                                                      $10,000

                                         40%                                                                                                                                                      5%
                                                                                                                                                                                                                                                                                  $5,000

                                         20%

                                                                                                                                                                                                  0%                                                                              $0
                                          0%                                                                                                                                                            1954 1959 1964 1969 1974 1979 1984 1989 1994 1999 2004 2009 2014 2019
                                            1940       1950    1960        1970          1979         1989             1999   2009   2019

                                                              Source: St. Louis FRED, Office of Management & Budget.                                                                                                     Source: St. Louis FRED, Office of Management & Budget.

These are all big numbers. The biggest / fastest such intervention ever from Washington DC – by a long shot. For
better or worse, given the circumstances, the boosters – or bazookas (a term used by Hank Paulson, U.S. Treasury
Secretary, during the financial crisis in 2008) are needed for the attempt to stabilize and restart our rapidly
deteriorating economy.

These large numbers may not be large enough – after all, one person’s lost revenue is also another person’s lost
revenue and so on and so on…a problematic cascade on multiple dimensions that is still in its early stages.

We are all participating in an unproven test for fiscal and monetary policy of a magnitude we have not experienced
before. Can a rapid response of this scale using lots of capital stabilize rapidly declining business trends and help them
resume growth in short order? The money is one thing; human confidence is another. We will know soon enough – we
suspect business trends in Q3 will be better than Q2 but that will be a low bar…

Key challenges of this multi-sided situation include:
1) Understanding when people can safely leave their homes, resume some version of their former lives, and restart
   the economy…all while balancing privacy and civil liberties
2) Ensuring government funding efficiently gets in the right hands and helps the economy weather the sudden
   slowdown
3) Helping businesses gradually get up and running again, while mindful of the potential for periodic shutdowns
4) Ensuring sufficient and creative ways for people to get back to work (and/or receive support) that sustain long-term
   economic growth
5) Managing government debt – which unfortunately has risen in good times – so that the financial overhang does not
   overburden our future

                                                                                                                                                                                                                                                                                                                                      5
Our New World 2020 BOND - April 2020 - Visual Capitalist
2) Viruses + Microbes = Consistent + Periodic Agents of Disaster
The battle of humans vs. infectious disease has been going on forever and humanity’s ever-increasing proximity is the
primary facilitator. Viruses are commonplace, epic viruses are rare – these are the big ones that changed the world…
                                                                                                                          Mortality                                                                                                                  Region Most
Pandemic                                                        Type          # Deaths        # Infected                   Rate                    Duration                  Years                                              Origin                 Affected  Stopping Mechanism
Bubonic Plague                                                Bacterial         200MM           ~333MM                        60%                            5 years         1347-51                                                China                     Europe                    Quarantine / Survivor Immunity
Small Pox                                                        Viral         56MM             ~185MM                        30%                 431 years                 1520-1951                                           Europe                         Global                   Vaccine
Spanish Flu                                                      Viral        40-50MM           ~500MM                          8%                           2 years         1918-19                                           Unknown                         Global                   Quarantine / Survivor Immunity
Plague of Justinian                                           Bacterial       30-50MM            ~80MM                        50%                            2 years         541-542                                         Middle East                      Europe                    Survivor Immunity
HIV / AIDS                                                     Viral          25-35MM            ~70MM                        35%                  39 years 1981 - Present                                                          Africa                     Global                   Testing / Antivirals
Third Plague                                                  Bacterial        12MM                NA                          NA                   1 year      1885                                                                Asia                       Asia                     Quarantine / Survivor Immunity

Sources: Visual Capitalist, CDC, History.com, TIME

Additional viruses over the last century have been material killers, all originating outside America: Asian Flu killed
1.1MM people in 1957-58 primarily in Asia; Hong Kong Flu killed 1MM in 1968-70 primarily in Asia; Swine Flu killed
200K in 2009-2010 globally, Ebola killed 11.3K in 2014-2016 in West Africa1 and SARS killed 8K people in 2003.
While other regions (primarily Asia) have experienced easily spread viruses with high mortality rates in recent history,
America’s last pandemic experience (at scale) was the Spanish Flu one-hundred years ago. Unfortunately, 3-4
generations are long enough for many people to have forgotten the pain and to be ill-prepared for the next attack.
Our world had become increasingly porous, handing a coronavirus the perfect setup for global impact.
As digital connectivity, air travel, cross-border movement and trade have ramped steadily upward, our population has
become untethered physically, darting from place to place with limited geographic constraints. Furthermore, people
have migrated from rural, isolated regions to more densely populated, connected urban areas.

 Global Internet Users (2018) =                                                                                                                                            Global Air Travel (2018) =
 3.8B vs. 4.2B Passengers, +7% Y/Y

                                                                Internet Users vs. Y/Y Growth                                                                                                                                                Global Air Passengers (Millions)
                                                                                                                                                                                                                     5,000
                                              4B                                                                                           20%
                                                                                                                                                                                  Global Air Passengers (millions)

                                                                                                                                                                                                                     4,000
          Internet Users, Global (Blue Bar)

                                                                                                                                                   Y/Y Growth (Red Line)

                                                                                                                                                                                                                                                                                                         Global
                                                                                                                                                                                                                     3,000
                                                                                                                                                                                                                                                                                                     Financial Crisis

                                              2B                                                                                           10%                                                                                                                                              WTC
                                                                                                                                                                                                                                                                                           Attacks
                                                                                                                                                                                                                     2,000
                                                                                                                                                                                                                                                                      Gulf War I
                                                                                                                                                                                                                                                                      Recession
                                                                                                                                                                                                                                               Oil Shock
                                                                                                                                                                                                                                               Recession
                                                                                                                                                                                                                                                                                               Dot Com
                                                                                                                                                                                                                     1,000                                                                      Bubble
                                                                                                                                                                                                                                                                                   Asian Financial
                                                                                                                                                                                                                                                                                       Crisis

                                               0                                                                                           0%                                                                           –
                                                   1990 1994 1996 1998 2000 2002 2004 2006 2008 2010 2012 2014 2016 2018                                                                                                     1970    1974    1978   1982      1986     1990     1994     1998   2002     2006   2010    2014   2018

                     Internet user data is as of mid-year. Source: United Nations / International Telecommunications Union, USA Census Bureau.                                                                                                             Source: World Bank, CLEAR.
        Pew Research (USA), China Internet Network Information Center (China), Islamic Republic News Agency / InternetWorldStats / Bond estimates (Iran), Bond
                                                       estimates based on IAMAI data (India), & APJII (Indonesia).

                                                                                                                 1
                                                                                                                     CDC, Visual Capitalist and Encyclopedia Britannica.                                                                                                                                                              6
Our New World 2020 BOND - April 2020 - Visual Capitalist
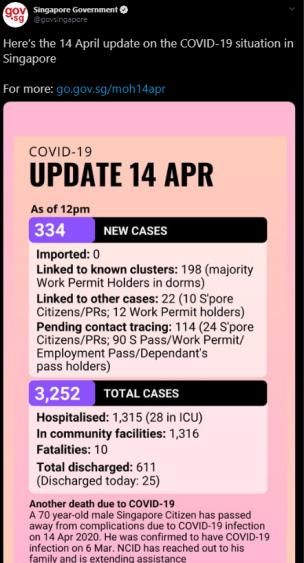
Global Cross-Border Air Travel (2018) =                                                                                                                                            Global Cross-Border Trade (2018) =
 1.4MM Arrivals, +6% Y/Y                                                                                                                                                            $25T @ 29% of Global GDP

                                                                        International Flight Arrivals (Millions)                                                                                                                                                                Trade as % of Global GDP
                                                        1,500
                                                                                                                                                                                                                                                        40%
       Total International Flight Arrivals (millions)

                                                        1,000

                                                                                                                                                                                                                                      % of Global GDP
                                                                                                                                                                                                                                                        20%

                                                         500

                                                                                                                                                                                                                                                        0%
                                                           –                                                                                                                                                                                                  1960 1965 1970 1975 1980 1985 1990 1995 2000 2005 2010 2015 2018
                                                                1995      1998          2001           2004          2007          2010          2013           2016   2018

                                                                                                       Source: World Bank                                                                                                                                                                          Source: World Bank.
                                                                                                                                                                                                                                               Note: ‘World Trade’ refers to the average of Imports & Exports (to account for goods in-transit between years) for all nations.

 Global Relative GDP (Current $) =                                                                                                                                                  Global Population (2018) =
 China + USA Rising…Europe Falling (2018)                                                                                                                                           On-Going Migration to Urban Areas

                                                                                                                                                                                                                                                                Urban Population (% of Total Population)
                                                                            Global GDP Contribution (Current $)
                                                                                                                                                                                                                                          100%
                                                                40%

                                                                                                                                                                                           Urban Population (% of Total Population)
                                                         40%
                                                                                                                                                                                                                                                                                                                                                                            USA 82%
                                                                                                                                                                                                                                                   80%
                                                                                                                                                                                                                                                                                                                                                                            Europe 75%
                               % of Global GDP

                                                                                                                                                                                                                                                   60%                                                                                                                      China 59%
                                                           26%                                                                                                                24%
                                                                                                                                                                                                                                                                                                                                                                            World 55%
                                                                                                                                                                              22%
                                                         20%
                                                                                                                                                                                                                                                   40%
                                                                                                                                                                              16%

                                                                                                                                                                                                                                                   20%
                                                          6%                                                                                                                  7%
                                                          4%
                                                          3%                                                                                                                  3%
                                                          0%                                                                                                                                                                                             –
                                                             1960              1970                1980                 1990                2000                2010      2018                                                                               1960         1970               1980               1990                2000               2010            2018
                                                                                                                                                                                                                                                                                    USA            China            World           Europe
                                                                              USA           Europe            China           India          Latin America

                                                                       Source: World Bank (GDP in current $). Other countries account for ~30% of global GDP.                                                                                                                      Source: Qatalyst Partners (March 2020) & World Bank

All these trends set up a virus’ dream – hitchhike on a human or surface, and travel hundreds of miles per hour across
land and sea to get to a whole new world. When there, quietly multiply before anyone can contain you. The virus is
clever, and it has evolved perfectly for the global environment through its long incubation time, asymptomatic
transmission and symptoms so mild that most carriers just keep working and milling about.
Its impact on a human is a toxic cocktail of the unpredictable: from nothing...to sniffles…to coughing…to breathing
difficulties…to death.
The capriciousness sows fear, not just of the infected, but of every human interaction. It creates a feeling of being
helpless in a war – with an invisible enemy.
We are all focused on the duration and severity of our crisis and watching / waiting / praying for the ebb of coronavirus
cases so we can begin to go out without fear of infection.
The good news is that social distancing appears to work and governments around the world have embraced it. In an
unprecedented and rapid global response, 100% of the 20 largest economies are now in some form of lockdown, with
19 of those countries taking action within a 4-week window.

                                                                                                                                                                                                                                                                                                                                                                                         7
Our New World 2020 BOND - April 2020 - Visual Capitalist
Social Distancing =
                  Rapidly Implemented by World’s Largest 20 Economies

                                                                                                   The World's 20 Largest Economies &
                                                                                                  Government-Mandated Social Distance

                              Count of 20 Largest Economies with Social Distancing
                                                                                     20

                                                                                     15

                                                                                     10

                                                                                     5

                                                                                     0
                                                                                          1/23   1/30     2/6        2/13         2/20         2/27         3/5         3/12            3/19   3/26
                                                                                          N=1     1        1            1           1            2            2           5              15     20

                                                                                                        Week (Starting 1/23, Week of China's Lockdown)

                                                                                                        Source: Internal analysis as of 4/13/20, John Hopkins University, Worldometer

From the epidemiological data emerging from around the world, we now know more about this agent of disaster, much
faster than ever before in pandemic history:
1) In the absence of intervention, Covid-19 infections will grow exponentially…
   Early consensus is that each person infected with Covid-19 will lead to 2 to 3 additional people becoming infected.
   In a world where the average person physically interacts with 10-15 others1 per day, there are hundreds of
   opportunities for transmission during the infectious stage of the disease. Empirically, that was proven in almost
   every country around the world, where a doubling time of every three days was observed in the weeks prior to
   social distancing. This doubling time is what produced the early warnings of hundreds of millions of infections.

2) Extreme social distance measures work...
   After implementing control measures, countries consistently see an improvement to ~6 days of doubling time within
   two weeks, and ~11 days within three weeks. The earliest countries to enter lockdown have now hit their peak
   hospitalization and death rates, approximately four weeks after implementing strict social controls. As a result,
   worldwide new daily cases largely stabilized in April and the world’s case count doubling time of ~15 days suggests
   we may be near the peak of this outbreak.

3) We don’t know what to expect ‘in between’...
   We know the two extremes, but we don’t know what will happen when we start to let down our guard. To do so, we
   need 100% available diagnostic testing with much faster turn-around (measured in minutes, not days). We need the
   systems and the tools to take action one step at a time, measure the impact, and iterate to find the most effective
   ways to contain Covid-19 until we have a vaccine.

                    1
                        ’Mixing patterns between age groups in social networks’ S.Y. Del Valle et al. / Social Networks 29 (2007) 539–554.                                                            8
Our New World 2020 BOND - April 2020 - Visual Capitalist
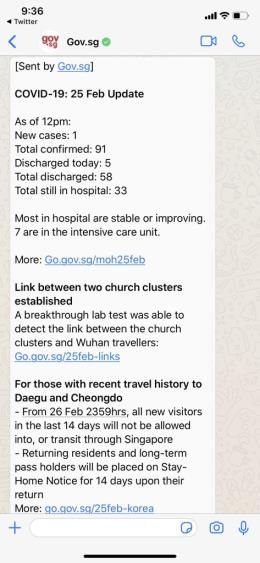
Impact of Social Distancing =                                                                                                                                                        Daily New Cases =
    Dramatic Reduction of Exponential Growth                                                                                                                                             Largely Plateaued in April

                                                                                                                                                                                                                                                                       World Daily New Cases
                 Average Doubling Times (Days) During Various
                            Phases of Lockdown                                                                                                                                                                           120,000                                                                                                                   100%
                                                                                                                                                                                                                                                                                                                                  Daily new case
                                   T0 = Date Social Distancing is Implemented                                                                                                                                                                                                                                                     growth slowing

                                                                                                                                                                                                                                                                                                                                                           5-Day Trailing Avg. Daily Growth Rate
                                                                                                                                         10.60                                                                                                                                                                                                     80%
                                                                                                                                                                                                                         100,000

                                                                                                                                                                                                                                                                                                                                                   60%
                                                                                                                                                                                                                          80,000

                                                                                                                                                                                                       Daily New Cases
                                                                                                                                                                                                                                                                                                                                                   40%
                                                                                                                                                                                                                          60,000
                                                                               5.82
                                                                                                                                                                                                                                                                                                                                                   20%

                                                                                                                                                                                                                          40,000
                                              3.74                                                                                                                                                                                                                                                                                                 0%
                  3.14
                                                                                                                                                                                                                          20,000
                                                                                                                                                                                                                                                                                                                                                   (20%)

                                                                                                                                                                                                                              0                                                                                                                    (40%)
                                                                                                                                                                                                                                   1/22     1/29     2/5       2/12     2/19     2/26       3/4     3/11      3/18     3/25      4/1     4/8
              T0 = Lockdown        T + 7 Days After Lockdown       T + 14 Days After Lockdown                                   T + 21 Days After Lockdown

                N = 20                         20                               20                                                          17                                                                                                             Daily New Cases                   5-Day Trailing Avg. Daily Growth Rate

                              Source: Internal analysis as of 4/13/20, John Hopkins University, Worldometer                                                                                                                                              Source: Internal analysis as of 4/13/20, John Hopkins University, Worldometer

                                                                     Doubling Time =
                                                                     Dramatic Improvement In April

                                                                                                                                                                World Doubling Times
                                                                                                                                                                Higher Numbers = Slower Spread
                                                                                                                          100
                                                                                                                                               Just China... under
                                                                                                                           90                              control

                                                                                                                           80
                                                                                           3-Day Trailing Doubling Time

                                                                                                                           70

                                                                                                                           60                                                                Exponential growth outside
                                                                                                                                                                                             of China as the virus spreads
                                                                                                                           50                                                                to every country/community

                                                                                                                           40
                                                                                                                                                                                                                              Slowing growth as the
                                                                                                                           30
                                                                                                                                                                                                                              world retreats to social
                                                                                                                                                                                                                                    distancing
                                                                                                                           20

                                                                                                                           10

                                                                                                                            0
                                                                                                                                1/22    1/29      2/5    2/12      2/19     2/26      3/4      3/11          3/18            3/25         4/1      4/8

                                                                                                                                                  Source: Internal analysis as of 4/13/20, John Hopkins University, Worldometer

The riddle for the whole world will be how to walk the fine line between relaxing the right measures at the right time in
the right places, without fanning the flame of infection transmission and exponential case count growth. We believe
that riddle is a problem that technology can help solve.
3) Creative Innovators (Globally + Together) Will Rise Above the Virus
It’s easy to be fearful of how Covid-19 could continue to rage when one looks at the devastating outcomes from the
epic plagues of past centuries.
The difference today, in a world with near 24x7 transparency, is that broad awareness of problems rises faster than
ever, thanks to our real-time global connectedness. Scientists and experts begin discussion / debate; citizens,
businesses, entrepreneurs and governments move with varying levels of urgency. Action and the quest for solutions to
problems can also ramp at record speed.
The world has urgently moved on medical and public health initiatives to halt the spread of Covid-19:

•     Global Information Sharing – ~3K published Covid-19 papers, which is 20x the published research of prior
      infectious diseases at this stage in the public health response
•     Rapid Mobilization of Clinical Research – ~500 clinical trials for Covid-19 interventions underway or completed
      across 34 countries
•     Unprecedented Scale – 5MM expected clinical trial participants

                                                                                                                                                                                                                                                                                                                                                                                                   9
Published Covid-19 Research =                                                                                                                        Covid-19 Clinical Trials =
 Faster Scientific Response Than Any Time In History                                                                                                  ~500 Trials Across 34 Countries
                 # of Research Reports Published in First 3 Months of Outbreak
                                                                                                                                                                                                      Clinical Trials by Country, N=499
                  2,970
   3,000
                                                                                                                                                             371
                                                                                                                                                              35

   2,500
                                                                                                                                                                       27

   2,000

                                                                                                                                                                                                                                                                     Countries With 1 Active Clinical Trial
                                                                                                                                                                                                                                                                     South Korea, Taiwan, Norway, Jordan,
   1,500
                                                                                                                                                                                 13                                                                                    Thailand, USA, Hong Kong, India,
                                                                                                                                                                                           11    11                                                                 Australia, Vietnam, Brazil, French Guiana,
                                                                                                                                                                                                        10                                                             Pakistan, Egypt, Romania, Ireland
                                                                                                                                                                                                                 9
   1,000                                                                                                                                                                                                                  6
                                                                                                                                                                                                                                    4        4
                                                                                                                                                                                                                                                       3
                                                                                                                                                                                                                                                                2        2       2    2       2      2      2
    500
                                                                 164
                                                                                                               41
      0
           COVID-19 (2020 YTD)                   H1N1 (Apr 2009 - Jun 2009)                         SARS (Nov 2002 - Jan 2003)

                          Source: PubMed US National Library of Medicine, National Institutes of Health.                                                                                                     Source: Internal Analysis, clinicaltrials.gov, covid-evidence.org

                                                                    Clinical Trials = 13MM Participants…Primarily Drug / Traditional
                                                                    Medicine / Biologic Trials

                                                                                                                    Breakdown by Intervention Type
                                                                                                            Drug    Traditional Medicine            Biologic       Diagnostic            Other
                                                                                      100%

                                                                                        90%

                                                                                        80%

                                                                                        70%

                                                                                        60%

                                                                                        50%

                                                                                        40%

                                                                                        30%

                                                                                        20%

                                                                                        10%

                                                                                          0%
                                                                                                             Number of Studies                                          # of Participants
                                                                                                              N = 592 Studies                                         N= 5MM Participants

                                                                                                                     Source: Internal Analysis, clinicaltrials.gov, covid-evidence.org

In sports, we often talk about dream teams from different eras like the New York Yankees, UCLA Bruins (Wooden
Basketball), Boston Celtics, Chicago Bulls, New England Patriots, Alabama Crimson Tide (Bryant & Saban Football)
and Golden State Warriors – their choreography, team play and wins have mesmerized.
There’s comfort that a global healthcare dream team of medical professionals is working in unprecedented ways
around the clock, rapidly sharing and iterating information / best practices / feedback in real-time at scale…in effect,
organizing a lot of the world’s relevant information and making it accessible (and useful, one hopes) in record time.
This type of global collective technology-assisted rapid response to a health-related problem has never happened
before, including collaboration and cooperation between the private sector and governments / regulators.
We will soon know if the fast-break attack of the virus can be countered by the global fast-break attack of the experts
(and new thinkers) with their data, technology, machines and passion. We like the odds of the counterattack though
the clock is ticking.

                                                                                                                                                                                                                                                                                                                 10
4) Rapid Changes Drive Growth in Both Directions…

Many of our customary activities have suddenly slowed – or come to complete halts. But the impact of Covid-19 has
also brought accelerating growth and focus in other areas. Most of these represent an acceleration of trends that have
been underway for years. Most have digital tie-ins.

Some trends we see happening now…

Scientists / Engineers / Domain Experts Get Back More Seats at The Table

In our work at BOND, we focus on technology, innovation, and the powerful role of science / engineering / data in
forward progress. We believe the Covid-19 environment creates a moment for the technology sector and its
entrepreneurs to shine.

The sector has consistently driven growth and value creation in the American economy. When one looks at public
market capitalization as a measure of business momentum / success and reviews the top American-based market cap
growers of the past ten years, there are common threads:

1)   Technology / innovation
2)   Digital, often cloud-based, business operations
3)   CEOs with engineering / computer science degrees
4)   Founded over the past ~30 years

The list-toppers are Microsoft, Amazon, Apple, Alphabet / Google and Facebook.

These successful companies are led by planners – they have short and long-term (10-20+ year) visions and business
plans focused on data, execution, iteration, engineering and science.

Events of the past 3-4 months underscore the need for broad-scale data-driven forward planning / execution and the
need for modern technology. In both industry and government, we fully expect greater focus on forward planning with
more scientists / engineers / domain experts who have seats at the table and relevant voices. This would be a good
thing.

                                                                                                                    11
Work-Life Re-Balanced

For those fortunate enough to be working these days, to say ‘shelter-in-place has changed daily routines’ is an
understatement. Technology investors recall the legend of Instagram securing 100MM monthly active users in ~2
years and Fortnite snagging 100MM MAUs in ~18 months, but we have never seen a business-focused app rise from
10MM to 200MM daily meeting participants in three months as Zoom’s video collaboration platform just did. Zoom has
secured its spot in the record books.

                     Zoom Video =
                     200MM Daily Participants in March 2020, +20x in Three Months

                                                                                                  Zoom – Global Daily Meeting Participants
                            Zoom Global Daily Meeting Participants (Free and Paid)

                                                                                     220MM

                                                                                                                                                                                                       200MM

                                                                                     110MM

                                                                                            Zoom
                                                                                        Public Release
                                                                                                                                                                                          10MM
                                                                                         -       -
                                                                                             Dec-13
                                                                                              Jan-13
                                                                                              Jan-13        Dec-14           Dec-15           Dec-16          Dec-17           Dec-18        Dec-19
                                                                                                                                                                                             Dec-19   Mar-20
                                                                                                                                                                                               Dec-19 Mar-20

                                                                                               Source: Zoom, “A Message to Our Users.” April 1, 2020. Represents maximum daily meeting participants.

In the wake of Covid-19, other business-focused apps (messaging & collaboration platforms) have also seen dramatic
usage increases – Slack reported more than a 2x increase in paying customer adds in Q1 plus a 20% increase in
average daily messages sent per user per day, while Microsoft Teams reported 44MM DAUs (daily active users),
+3.7x week-over-week, for the week of March 19.

Over the years, we have spent a lot of time looking at the evolution of work – from entrepreneurs working on online
marketplaces (like eBay / Etsy / Upwork / Airbnb), workers earning money in new ways via on-demand services (like
Uber / DoorDash / Instacart) and office workers working remotely at companies (like Automattic, Zapier and GitLab).

We have often been in large open spaces at technology companies filled with people using laptops at standing desks
while wearing headphones to tune out background noise. Despite the advantage of being in the same space, the
workers often collaborate mostly using digital tools. We have questioned what percentage of workers need to be in the
same place at the same time – is there a better win-win arrangement?

Beginning on March 2, Bay-Area technology companies began to shift to work-from-home owing to Covid-19. Many
workers stuffed their laptops and personal items into bags, took their regular commutes home, had a meal, went to
sleep, woke up in the morning and then began doing those same jobs at a different desk (or kitchen table…or sofa).

In effect, a big experiment started that will likely change the way lots of office work is done.

We tend to invest in technology companies that have been founded in the past ten years. The businesses are
generally run in the cloud using cutting-edge technology. Most are online businesses. Often 40-50% of their
workforces focus on product development and engineering.

                                                                                                                                                                                                               12
We conducted an informal survey of some of the companies…we asked questions about the new remote work
environment.

•    At a high level, do you think your business is running more efficiently?
•    Are your teams and individuals more productive?
•    Are there business units / teams that are more efficient and happier?
•    Are there business units / teams that are less efficient and sadder?
•    What services are you using more – video conferencing / messengers / other?
•    What are the upside surprises of remote work?
•    How are you maintaining your company culture through remote work?
•    What are the downside surprises / challenges of remote work?
•    Assuming your business fundamentals are running as previously planned in 3-6 months, how might you change
     the way your business is run given what you are learning from remote working?

Here’s what we have learned from the first 1½ months of remote work:

•    It’s still early – and the novelty may wear off and things may begin to break – but, so far so good.
•    At the margin, productivity is the same or higher.
•    Video calls, when not overused, are efficient / productive and they tend to start / end on time (or early).
•    Messenger & video-based information sharing / editing is very effective.
•    People outside of headquarters feel more included.
•    It’s easier to bring outsiders in for quick video discussions.
•    Time flexibility / commute time elimination / family meal sharing are big wins for workers.
•    Pre-existing management bottlenecks – around individual performance or organizational design – are only
     amplified in a distributed environment.
•    Biggest productivity and balance challenges come from parents with pre- or school-aged children that had other
     support systems during the working day prior to the implementation of work-from-home mandates. In addition,
     there’s work to be done in understanding potential psychological and physical stress and other challenges related
     to remote work, especially in the current ‘shelter-in-place’ environment.
•    Companies that focus on effective written communication and documentation (dubbed the ‘Amazon way’) – where
     plans are shared in written form for editing – either synchronous / asynchronous – have had an easier time shifting
     to distributed work. Many observe this form of communication can lead to more insightful input and decision
     making.
•    ‘Creating the office’ online can be successful – including regularly scheduled meetings plus active social
     experiences like work-related classes and training plus outlets like live-streamed workouts.

While most companies already had teams working remotely, most believe – after the experience of forced remote work
– they will shift to more distributed work.

Top-of-mind issues with large-scale remote work include questions of how to:

1)   Ensure creativity is captured and productivity is maintained
2)   Determine which teams are optimized by working together in-person all the time / some of the time / rarely
3)   Maintain engagement and culture(s), recruit / train / develop / retain people, and manage human resources
4)   Manage technology / security with rising numbers of remote workers
5)   Think about recruiting if physical proximity to headquarters / office is less relevant
6)   Organize / utilize office space(s)
7)   Evolve business travel and entertainment

One founder said, ‘With newer start-up / founder-led companies, there can be a mindset that nothing is set in stone
and there’s a nimbleness and receptivity to new ideas and change. Distributed work is just another new thing to
embrace and make the best of. We are finding, in many ways, there’s a lot to like.’

                                                                                                                      13
Digital Transformation Accelerating

On a relative basis, when we look back on business trends in the spring of 2020, it is likely that businesses doing the
best tended to have:

1) Cloud-based business functions where workers can take their computing devices and work nearly anywhere
2) Products always in demand but especially so in uncertain times (starting with Maslow’s food / water /
   shelter…extended to entertainment)
3) Easily discoverable online presence that seamlessly helps consumers
4) Efficient ways to distribute products to consumers in limited-contact ways
5) Products that make businesses more digitally efficient
6) Broad (or emerging) social media presence

We have seen it with the likes of:

•     Local restaurants shifting from four-top seating to curbside pick up
•     Local stores adapting to sell products on information-only websites
•     Local communities experiencing rising connectedness
•     Big brands ramping online efforts while offline falters
•     Instructors shifting from in-person to on-demand / virtual classes
•     Students shifting from physical to virtual & digital classes
•     Families + individuals shifting to more digital entertainment
•     Grocery shoppers shifting from going to store to ordering delivery
•     Diners shifting from eating-out to eating-in
•     Doctors shifting from in-person to telehealth appointments
•     CEOs / CTOs accelerating IT spending on cloud-based products / services

Many of these offline-to-online trends have been in place for a while – Covid-19 just accelerated them.

Some highlights / data follow…

    Restaurants =                                             Local Stores =
    Shifting from Four-Top Seating to Curbside Pick Up        Adapting to Sell Products on Information-Only Websites

                                Source: Instagram                                        Source: On Running

                                                                                                                          14
Local Communities =                                                                                                                                                                                                                   Big Brands =
Experiencing Rising Connectedness                                                                                                                                                                                                     Ramping Online Efforts While Offline Falters
                                           Nextdoor Help Map                                                              Nextdoor Worldwide Weekly iOS Active Users
                                                                                                                                         (AppAnnie)                                                                                        So we try to reimagine how we're communicating, how we're working with the consumers.
                                                                                                                                                                                                                                                       If you go to our website, you can get a sense for what we're doing.
                                                                                                                                                                                                                                                   The whole front of the website starts with a letter from me addressing the
                                                                                                                           10,000,000                                                                                                         current situation, letting everybody know our galleries are closed & letting everyone
                                                                                                                                                                                                                                                know that we say our doors may be closed, but our hearts & minds are open…

                                                                                                      Worldwide Active iOS Users
                                                                                                                                   8,000,000                                                                                                We set up virtual appointments using FaceTime, Hangouts, Skype, Zoom, or call –
                                                                                                                                                                                                                                                  it's like we're live innovating, improvising, adapting and overcoming.
                                                                                                                                   6,000,000
                                                                                                                                                                                                                                                                                   And the demand that our teams are generating during this time is –
                                                                                                                                                                                                                                                                                   I think it's extraordinary. If you look back and think about the really
                                                                                                                                   4,000,000                                                                                                                                     big important moves this company & this brand has made in its history,
                                                                                                                                                                                                                                                                                               the most important moves we made, the biggest
                                                                                                                                                                                                                                                                            transformational steps we've taken have been in the times of most uncertainty…
                                                                                                                                   2,000,000
                                                                                                                                                                                                                                                                                                 I think no different then this virus is going to
                                                                                                                                          –
                                                                                                                                                                                                                                                                                                    forever change this country & the world.
                                                                                                                                                                                                                                                                                               This time is going to forever change our company &
                                                                                                                                               4/19
                                                                                                                                                      5/19
                                                                                                                                                             6/19
                                                                                                                                                                    7/19
                                                                                                                                                                           8/19
                                                                                                                                                                                  9/19
                                                                                                                                                                                         10/19
                                                                                                                                                                                                 11/19
                                                                                                                                                                                                         12/19
                                                                                                                                                                                                                 1/20
                                                                                                                                                                                                                        2/20
                                                                                                                                                                                                                               3/20
                                                                                                                                                                                                                                                                                          our way of doing business & in many ways, elevate our culture.
                                                                                                                                                                                                                                                                                                 Gary Friedman – Chairman / CEO, Restoration Hardware Earnings Call (3/30/20)

                                                        Source: Nextdoor, AppAnnie iOS worldwide Nextdoor weekly active user data as of 4/15/2020.                                                                                                                                                           Source: Restoration Hardware FY2019 Q4 earnings transcript

Instructors =                                                                                                                                                                                                                         Students =
Shifting from In-Person to On-Demand / Virtual Classes                                                                                                                                                                                Shifting from Physical to Virtual Classes…
                                                                                                                                                                                                                                       Google Classroom Worldwide Weekly Active Users on iOS (AppAnnie)

                                                                                                                                                                                                                                                                                    25,000,000

                                                                                                                                                                                                                                                Worldwide Weekly Active iOS Users   20,000,000

                                                                                                                                                                                                                                                                                    15,000,000

                                                                                                                                                                                                                                                                                    10,000,000

                                                                                                                                                                                                                                                                                     5,000,000

                                                                                                                                                                                                                                                                                             –
                                                                                                                                                                                                                                                                                                 4/19 5/19 6/19 7/19 8/19 9/19 10/19 11/19 12/19 1/20 2/20 3/20

                                                                                     Source: Core Power Yoga Instagram                                                                                                                                                                      Source: AppAnnie iOS worldwide Google Classroom weekly active users data as of 4/15/2020.

…Students =                                                                                                                                                                                                                           Families + Individuals =
Shifting from Physical to Digital Classes                                                                                                                                                                                             Shifting to More Digital Entertainment

      Duolingo Worldwide Weekly Active Users on iOS (AppAnnie)                                                                                                                                                                                                                    Discord iOS Worldwide Weekly Active Users (AppAnnie)
                                                                                                                                                                                                                                                                                    25,000,000
                                           10,000,000
       Worldwide Weekly Active iOS Users

                                                                                                                                                                                                                                              Worldwide Weekly Active iOS Users

                                                                                                                                                                                                                                                                                    20,000,000
                                            8,000,000

                                            6,000,000                                                                                                                                                                                                                               15,000,000

                                            4,000,000
                                                                                                                                                                                                                                                                                    10,000,000

                                            2,000,000
                                                                                                                                                                                                                                                                                     5,000,000

                                                   –
                                                        4/19      5/19     6/19     7/19     8/19     9/19 10/19 11/19 12/19 1/20                                                   2/20          3/20
                                                                                                                                                                                                                                                                                            –
                                                                                                                                                                                                                                                                                                 4/19    5/19    6/19     7/19     8/19    9/19 10/19 11/19 12/19 1/20                2/20   3/20

                                                               Source: AppAnnie iOS worldwide Duolingo weekly active user data as of 4/15/2020.                                                                                                                                                     Source: AppAnnie iOS worldwide Discord weekly active user data as of 4/15/2020.

                                                                                                                                                                                                                                                                                                                                                                                                    15
Grocery Shoppers =                                                                                                                                                                                           Diners =
Shifting from Going to Store to Ordering Delivery                                                                                                                                                            Shifting from Eating-Out to Eating-In
                            Instacart - 3rd Party iOS App Download Data (AppAnnie)                                                                                                                                                                                                                                             DoorDash – Worldwide Weekly
                                                                                                                                                                                                                                                                                                                               Active Users on iOS (AppAnnie)
                                             800,000
                                                                                                                                                                                                              Our Eats business is an important resource right

                                                                                                                                                                                                                                                                                       Worldwide Weekly Active iOS Users
                                                                                                                                                                                                                                                                                                                           8,000,000
              USA Weekly iOS App Downloads

                                             700,000                                                                                                                                                         now, especially for restaurants that have been hurt
                                                                                                                                                                                                              by containment policies. And in the US, our SMB
                                             600,000                                                                                                                                                         sales team is now closing 2.5x the number of new
                                                                                                                                                                                                                                                                                                                           6,000,000
                                                                                                                                                                                                                    restaurants we normally do per day.
                                             500,000
                                                                                                                                                                                                             And our restaurant self-service website has seen a
                                                                                                                                                                                                             10x increase in sign-ups since last Thursday. Eats                                                            4,000,000
                                             400,000                                                                                                                                                         is becoming all the more important for its partners,
                                                                                                                                                                                                                    and we expect to be there for them.
                                             300,000
                                                                                                                                                                                                                                                                                                                           2,000,000
                                                                                                                                                                                                              Dara Khosrowshahi – CEO of UBER, Shareholder Update Call
                                             200,000                                                                                                                                                                                (3/19/20)

                                             100,000                                                                                                                                                                                                                                                                              –

                                                                                                                                                                                                                                                                                                                                       4/19

                                                                                                                                                                                                                                                                                                                                                                                 10/19
                                                                                                                                                                                                                                                                                                                                                                                         11/19
                                                                                                                                                                                                                                                                                                                                                                                                 12/19
                                                                                                                                                                                                                                                                                                                                              5/19
                                                                                                                                                                                                                                                                                                                                                     6/19
                                                                                                                                                                                                                                                                                                                                                            7/19
                                                                                                                                                                                                                                                                                                                                                                   8/19
                                                                                                                                                                                                                                                                                                                                                                          9/19

                                                                                                                                                                                                                                                                                                                                                                                                         1/20
                                                                                                                                                                                                                                                                                                                                                                                                                2/20
                                                                                                                                                                                                                                                                                                                                                                                                                       3/20
                                                    –
                                                        4/19    5/19     6/19     7/19     8/19                                9/19 10/19 11/19 12/19 1/20                   2/20     3/20     4/20

                                                  Source: AppAnnie iOS US Instacart app weekly download data as of 4/15/2020. Excludes partial week download data.                                                                 Source: AppAnnie iOS worldwide DoorDash weekly active user data as of 4/15/2020; public earnings transcripts

Doctors =                                                                                                                                                                                                    CEOs / CTOs =
Shifting from In-Person to Telehealth Appointments                                                                                                                                                           Accelerating IT Spending on Cloud-Based Products / Services
                                                                                                                                                                                                                                                                                                                              Projects with Largest Spend Increase in 2020
                                                                                                                                    Teladoc – 3rd Party iOS App Download Data                                                                                                                                                            (% of Total Responses)
                                                                                                                                                    (AppAnnie)
                                                                                                                                     50,000
                                                                                                  Global Weekly iOS App Downloads

 The demand has shifted forever on virtual care &
       we’re on the verge of a new era for                                                                                           40,000
      virtual care in the healthcare system.

   We’re certainly seeing a significant increase in
volume & I didn’t exactly expect the president to be                                                                                 30,000
   talking at a White House press briefing about
  telehealth. If you’d asked me that a few months
    ago, I would have said that’s pretty unlikely.
                                                                                                                                     20,000
    Jason Gorevic – CEO, Teladoc Health, CNBC (3/23/20)

                                                                                                                                     10,000

                                                                                                                                         –
                                                                                                                                              4/19 5/19 6/19 7/19 8/19 9/19 10/1911/1912/19 1/20 2/20 3/20

                                             Source: AppAnnie iOS worldwide Teladoc weekly download data as of 4/15/2020. Excludes partial week download data.                                                                                 Source: Morgan Stanley CIO Survey (March 2020, report dated as of 4/2/2020), Twitter

                                                                                                                                                                                                                                                                                                                                                                                                                              16
Rise of On-Demand Services as Economic Growth Driver Continues (for Consumers + Workers)

On-demand services have been on the rise for years. Many of the top on-demand businesses have been negatively
impacted by Covid-19.

Leading on-demand platforms for transportation (Uber / Lyft…), accommodations (Airbnb…) and services have seen
volumes decline as a result of stay-at-home measures, social distancing and border closures.

On the other hand, on-demand platforms that deliver groceries and food (Instacart / DoorDash…) have experienced
surging demand and are aggressively bringing on new workers, in addition to providing demand to local grocers,
restaurants and other essential stores.

Net, we believe on-demand and to-the-door delivery services may be gaining permanent market share in these
unusual times. While the benefits to consumers of on-demand services are relatively obvious, we continue to believe
the importance of on-demand businesses in helping provide workers with work and flexibility is underappreciated in
America. In many regions around the world, especially Asia, on-demand services are more pervasive and advanced
than in America.

The on-demand economy is large and has been expanding in the U.S. – there were an estimated 56MM on-demand
consumers in America in early 20181. Checkr indicated it had 11.5MM unique applicants on its on-demand worker
background checking platform in 2019 and has supported >35MM unique applicants since 2015. This compares with
the Bureau of Labor Statistics tally of 156MM American workers in March.

 On-Demand Consumers =                                                                                                                                                                                                                                                                                                                                                    On-Demand Workers =
 56MM + ~2x in Two Years                                                                                                                                                                                                                                                                                                                                                  >35MM Unique Applicants on Checkr Platform
                                                                                                                                                                                                                                                                                                                                                                                                                                                         Checkr On-Demand Platform Applicants, USA
                                                                                  On-Demand Consumers, USA                                                                                                                  On-Demand Products / Services –
                                                                                                                                                                                                                              Consumer Spend, 2017, USA
                                                                                                                                                                                                                                                                                                                                                                                                                                                                                         12MM
                                                                            60MM

                                                                                                                                                                                                                                                                                                                                                                                                                                                         Annual Checkr Applicants, USA
                                                                                                                                                                56MM                                               Online Marketplaces                                                                                                                                       As the on-demand economy continues to
                                                                                                                                                                                                                                                                                                                                                                             evolve & transform the world around us,
                                                                                                                                                                                                                                                                                                                                                                              we're seeing a rapid increase in new &
                                                                                                                                                                                                                            Transportation
                                                                                                                                                                                                                                                                                                                                                                                    supplemental job creation.
                                                      On-Demand Consumers

                                                                                                                                                                                                                                                                                                                                                                                Increasingly, this type of work has
                                                                                                                                                                                                                                         Housing                                                                                                                             become a key driver of economic growth.

                                                                            30MM
                                                                                                                                                                                                                                                                                                                                                                             Checkr has a front row seat in the on-demand                                                                6MM
                                                                                          25MM                                                                                                                                 Food Delivery                                                                                                                                economy, not only to watch the changes unfold,
                                                                                                                                                                                                                                                                                                                                                                               but also to provide solutions that shape &
                                                                                                                                                                                                                                                                                                                                                                              strengthen it. Our technology is designed to
                                                                                                                                                                                                                         Health & Beauty
                                                                                                                                                                                                                                                                                                                                                                              give employers the information they need to
                                                                                                                                                                                                                                                                                                                                                                            make informed decisions about their candidates,
                                                                                                                                                                                                                                                Other                                                                                                                       while helping them scale & grow their business.

                                                                                    0                                                                                                                                                                                                                                                                                         Daniel Yanisse – Co-Founder / CEO, Checkr, 6/19
                                                                                                                                                                                                                                                            $0                                        $15B              $30B                                                                                                                                                                0
                                                                                               2016               2017                                                     2018
                                                                                                                                                                                                                                                            Consumer Spend, 2017, USA
                                                                                                                                                                                                                                                                                                                                                                                                                                                                                                   2015     2016      2017   2018   2019

                                                                                    Source: National Technology Readiness Survey (4/18). Note: authored by Rockbridge Associates, Inc. & A. Parasuraman & is co-sponsored by the Center for Excellence in                                                                                                                                                                                  Source: Checkr (Q1:20)
                                                                                 Service, Robert H. Smith School of Business, University of Maryland. The study is conducted online among a representative sample of consumers in a national panel & represents
                                                                                     the views of U.S. adults ages 18 & older. The sample size was 1,032 in 2016 & 1,004 in 2017. The margin of error is +/- 3 percentage points. 2018 figures are estimates.

 On-Demand Platforms =                                                                                                                                                                                                                                                                                                                                                    On-Demand Work Basics + Benefits (2017) =
 Big Numbers + High Growth                                                                                                                                                                                                                                                                                                                                                Extra Income + Flexibility, USA per Intuit / Emergent Research
                                                                                 Real-Time                                                                                                                                  Internet-Enabled
                                                                                 Platforms                                                                                                                                    Marketplaces                                                                                                                                                                 Extra Income                                                                                   Flexibility
                                                     Uber @ 5MM Driver-Partners                                                                                                              Etsy @ 3MM Sellers                                                                          Airbnb @ 6MM Listings
                                                          $90B                                                      6MM                                                              $4B                                             4MM
                                                                                                                                                                                                                                                                                                                                                                                                37% = Run Own Business                                                                      71% = Always Wanted To Be Own Boss
                                                                                                                                                                                                                                                                                       250MM                                  6MM
                                                                                                                                                           Gross Merchandise Sales
                                                                                                                           Driver-Partners, Global
                            Gross Bookings, Global

                                                                                                                                                                                                                                                                                                                                                                                                33% = Use Multiple On-Demand Platforms                                                      46% = Want To Control Schedule
                                                                                                                                                                                                                                                                                                                                                Active Listings, Global
                                                                                                                                                                                                                                                              Guest Arrivals, Global
                                                                                                                                                                (GMS), Global

                                                                                                                                                                                                                                          Sellers, Global

                                                          $60B
                                                                                                                                                                                                                                                                                                                                                                            Basics              26% = Employed Full-Time (W2 Wages)                                                         19% = Responsible for Family Care
                                                                                                                    3MM                                                              $2B                                             2MM                                               125MM                                  3MM
                                                          $30B                                                                                                                                                                                                                                                                                                                                  14% = Employed Part-Time (W2 Wages)                                                             9% = Active Student
                                                                                                                                                                                                                                                                                                                                                                                                  5% = Retired
                                                                            $0                                      0                                                                                                                                                                         0                               0
                                                                                 2014 2015 2016 2017 2018 2019                                                                        $0                                             0
                                                                                                                                                                                           2012 2013 2014 2015 2016 2017 2018 2019                                                                2010 2012 2014 2016 2018
                                                                            Gross Bookings              Driver-Partners                                                                                                                                                                       Guest Arrivals        Active Listings
                                                                                                                                                                                                     GMS             Sellers                                                                                                                                                                    57% = Earn Extra Income                                                                     91% = Control Own Schedule
                                                     DoorDash @ 1.3MM Dashers                                                                                                              Wonolo @ 230K Workers                                                                         VIPKid @ 70K Teachers                                                                                  21% = Make Up For Financial Hardship                                                        50% = Do Not Want Traditional Job
                                                     1.4MM                                                                                                                       250K                                                                                                  900K                               110K
                                                                                                                                                                                                                                                                                                                                                                                                19% = Earn Income While Job Searching                                                       35% = Have Better Work / Life Balance
 Lifetime Dashers, Global

                                                                                                                                                     Onboarded Workers, Global

                                                                                                                                                                                                                                                                                                                                                                           Benefits
                                                                                                                                                                                                                                                                                                                                  Teachers, Global
                                                                                                                                                                                                                                                             Students, Global

                                                                                                                                                                                                                                                                                                                                                                                                $34      Average Hourly Income                                                              11 Average Weekly Hours With
                                                     0.7MM                                                                                                                       125K                                                                                                  450K                               55K
                                                                                                                                                                                                                                                                                                                                                                                                                                                                                            Primary On-Demand Platform
                                                                                                                                                                                                                                                                                                                                                                                                $12K Average Annual Income
                                                                                                                                                                                                                                                                                                                                                                                                                                                                                            37 Average Weekly Hours of Work
                                                                                                                                                                                                                                                                                                                                                                                                24% Average Share of Total Income
                                                                            0
                                                                                                                                                                                                                                                                                          0                               0
                                                                                                                                                                                                                                                                                                                                                                                                                                                                                            (All Types / Platforms)
                                                                                 2014 2015 2016 2017 2018 2019                                                                        0
                                                                                                                                                                                           2014      2015     2016      2017     2018                                                              2017   2018   2019
                                                                                          Lifetime Dashers                                                                                               Onboarded Workers                                                                          Teachers       Students

                                                                                    Uber Source: Uber. DoorDash Source: DoorDash. Note: Lifetime Dashers defined as the total number of people that have dashed on the platform through the end of each year.                                                                                                                   Source: Intuit / Emergent Research, 2017. Note: Intuit partnered with 12 On-Demand Economy platforms which provided access to their provider email lists. (n =
                                                                                   2019 figures are as of 5/19. Etsy Source: Etsy. Airbnb Source: Airbnb, Note: Airbnb 2017 & 2018 Guest arrivals based on estimates from total guest arrivals disclosures in 2018 &                                                                                                             6,247 respondents who had worked on-demand within the past 6 months). The survey focused on online talent marketplaces. Airbnb and other online capital
                                                                                                     2019. 500MM guest arrivals have occurred via Airbnb as of 2019. VIPKid Source: Company Press Releases (3/19). Wonolo Source: Wonolo.                                                                                                                                                                                                       marketplaces were not included.

                                                                                                                                                                                                              1
                                                                                                                                                                                                                  4/18 National Technology Readiness Survey conducted by Rockbridge Associates.                                                                                                                                                                                                                                            17
While there’s a lot of uncertainty in the world now, we do know the following:

1)   The ways people work are changing
2)   People are losing jobs
3)   Most people feel less financially secure
4)   We don’t know what our world will look like in 3-24 months

We believe these trends are likely:

•    The nature of work / jobs will continue to evolve rapidly…

     We are experiencing a rapid short-term reallocation of labor not seen since experienced since WWII (1939-1945).
     Covid-19’s impact has caused labor shortages in transportation, supply chains, groceries, and healthcare. Walmart
     announced plans to hire 150K hourly associates on 3/19 and CVS announced plans to add 50K full-time / part-time
     roles on 3/23. Recent job postings from online job marketplaces like ZipRecruiter highlight significant growth in
     transportation (trucking), e-commerce (warehousing / supply-chain) and healthcare.

                     COVID-19 = Driving Significant Increase in Demand for
                     Transportation, E-Commerce + Storage & Healthcare Workers

                                        Job Posting Increases in March 2020, ZipRecruiter

                            Transportation                 E-Commerce + Storage                                  Healthcare

                         CDLFlatbed
                        CDL   Flatbed                       Warehouse
                                                           Warehouse                                    Geriatric
                                                                                                 Geriatric Nursing
                         TruckDriver
                               Driver            999%        Handler                      699%           Nursing
                                                                                                    Assistant         189%
                        Truck                                Handler
                                                                                                      Assistant

                         TruckDriver
                        Truck  Driver                           Online
                                                        Online Merchant            354%                Surgical
                           Trainer        314%                                                     Surgical Nurse    130%
                             Trainer                         Merchant                                     Nurse

                                                                                                     Registered
                                                                                                   Registered
                      CDL A Company
                              CDL A                         Warehouse
                                                           Warehouse
                          Driver        112%                 Attendant            324%              Respiratory
                                                                                                   Respiratory       129%
                          Company                           Attendant                                Therapist
                              Driver                                                                Therapist

                       Over-the-Road                                                                   Intensive
                                                                                                   Intensive Care
                          Over-the-     72%                   Shopper
                                                             Shopper            229%                                 121%
                        TruckTrucker
                              Driver                                                                        Care
                                                                                                        Nurse
                       Road
                                                                                                          Nurse
                              Driver

                                                        GroceryGrocery
                                                                Shopper        186%
                                                             Shopper

                                                                   Source: ZipRecruiter

•    On-demand work / jobs will evolve and become a bigger part of our economy…

     On-demand work can allow displaced workers to sign up for work on multiple platforms and schedule hours around
     life commitments such as childcare and/or education. Owing to the re-accelerating adoption of on-demand
     platforms for grocery, food and e-commerce, there is a surge in demand for labor with recent announcements from
     the likes of Instacart which announced it was looking for 300K full-service shoppers (3/23) and Amazon which
     indicated it was looking for 175K warehouse and delivery workers (3/16 & 4/13).

•    Relevance of tech-enabled multi-way synchronous / asynchronous communication and feedback will rise…

     This kind of immediate, focused communication is foundational to on-demand services (like Uber drivers receiving
     instant feedback on new pick-ups) and is becoming increasingly utilized in more traditional work (thanks to recent
     usage ramps of the likes of Zoom / Slack / Microsoft Teams). And, it can serve as an effective training tool. We
     expect it to become more foundational to business operations of all sorts and it can help improve productivity,
     efficiency and satisfaction.

                                                                                                                              18
Net, Covid-19 has been a forcing function for a rapid re-think about the nature of work and the training / education
necessary to remain agile and relevant in the workforce. On-demand work should be a foundational way that
government helps people get back to work.

                    Uber for Drivers =
                    Synchronous + Asynchronous Communication / Feedback Platform

                                                                         Source: Uber, YouTube

                    Slack for Workers =
                    Synchronous + Asynchronous Communication / Feedback Platform

                     One of the advantages of Slack is the deep level
                    of engagement…Even though the average number
                     of users have [increased], the average messages
                                 per user has increased.

                     [Users] are sending messages, creating channels,
                      adding integrations, uploading files – we want to
                       be integral in how these organizations operate.
                         And the way we get there is simultaneous
                                         connections.
                     Stewart Butterfield – Co-Founder / CEO, Slack, 3/26/20
                              (Interview with RBC Capital Markets)

                                                                                 Source: Slack

                                                                                                                       19
Government’s Role in Stabilizing / Stimulating Economy (& Jobs) Must Be Enabled by Modern Technologies

There will be endless debate about the wisdom and timing of government actions that stopped the economy by
sending people home, and about government efforts to restart the economy by sending people back to work.

But in the here and now, governments face several immediate challenges. As noted earlier, they must:

1) Understand when people can safely leave their homes, resume some version of their former lives, and restart the
   economy…all while balancing privacy and civil liberties
2) Ensure government funding efficiently gets in the right hands and helps the economy weather the sudden
   slowdown
3) Help businesses gradually get up and running again, while mindful of the potential for periodic shutdowns
4) Ensure sufficient and creative ways for people to get back to work (and/or receive support) that sustain long-term
   economic growth
5) Manage government debt – which unfortunately has risen in good times – so that the financial overhang does not
   overburden our future

Covid-19 has attacked humans, and, in effect, it has also attacked our systems. We know that people most vulnerable
to the virus can have pre-existing conditions. Our governments have pre-existing conditions, too. The problem is
beyond partisanship: Our government’s day-to-day operating systems and technology are old / fragile / inefficient and
vulnerable. Covid-19 has exposed this. We are hopeful that Covid-19 can serve as a forcing function to drive long-
overdue upgrades and overhauls of government technology / processes and to help aid the ability to connect with its
taxpayers, voters and citizens.

The restart timing and process is well underway in different regions and we suspect it will be slow and steady with the
potential for rolling lockdowns as virus hotspots emerge following increased social interaction. Around the world, we
have seen success stories of governments taking advantage of technology infrastructure to organize coordinated
methods of keeping citizens informed and help monitor the spread of the virus. Singapore is using WhatsApp, Twitter
and Telegram to publish daily updates on Covid-19 to citizens in four different languages. In Korea, the government
launched the Corona 100M app that publicly informs citizens of known cases within 100 meters of their location.

                  Singapore COVID Communication =
                  Multi-Platform / Language / Format Approach to Maximize Relevance
                           Twitter                        WhatsApp                     Telegram

                                                 Source: Twitter, WhatsApp, Telegram

Efforts, so far, to determine which people and businesses get extra capital – and how they receive it – have varied in
efficiency, but we suspect there will be steady improvement.

                                                                                                                         20
While governments are determining how to get money to people, there are many companies across industries that
have direct / scaled / easy-to-use app-based payment relationships with customers. These include the likes of financial
service (including credit card / payment) companies, communications companies, internet (including API-based)
businesses and utilities. Dialogue is active and promising. And, in the world of small victories, we are encouraged that
the U.S. government is discouraging the use of paper checks with its stimulus payments and including digital financial
technology companies such as Intuit, PayPal and Square to participate in its emergency lending program.

It’s hard to know exactly what return to work will look like. There will be many businesses that never recover. There will
be many (with both small and large tweaks) that come back, some of these stronger than ever (with some doing so in
spaces that will surprise us). And there will be new businesses that would have been inconceivable just a few years
ago.

Businesspeople know it can take a day to shut something down, but it can take years to start it back up. For many
businesses, 2020, in effect, will be a lost year and the challenge will be getting to 2021 when, ideally, many business
patterns we have come to know begin to resume at some scale.

We believe technology infrastructure that has emerged over the past decade with remote work, on-demand
businesses and mobile consumer products and apps will play critical roles in helping to balance public health
considerations with America’s return to work.

The costs of recent fiscal and monetary initiatives plus on-going unemployment payments are unsustainable. People
need to get back to work for peace-of-mind and to help reduce the rising / on-going costs to government and
taxpayers. We are hopeful that government focus in these areas will emerge in the coming weeks, and that our best-
and-brightest companies will be in the mix to help people find old and new types of work, in addition to being more
helpful with healthcare.

2020 = Step-Function Year for Technology + Healthcare?

The front line of the battle with Covid-19 has been the institutions and individuals that make up America’s healthcare
delivery system. From those ranks, millions of healthcare heroes have emerged, putting themselves and their families
at risk to fight the war. America owes them honor and gratitude.

Unfortunately, the pandemic also exposed a number of structural flaws in our healthcare system. Covid-19 may be the
call to arms that we need to fundamentally rethink what amounts to 8% of U.S. GDP and $1.2T of federal spending in
2019 (Medicare / Medicaid / other healthcare services), representing 28% of the federal budget.

Two notable healthcare observations we have had during this crisis:

1) Our healthcare delivery in the U.S. hasn’t changed as much as one would think since the Spanish Flu outbreak of
1918…

Technology and innovation have had little impact on the primary care patient journey. Patient develops symptoms,
patient visits a doctor’s office (possibly infecting others in the case of Covid-19), doctor diagnoses disease largely from
outward symptoms, doctor sends patient home usually under ‘watch and wait,’ patient either recovers or escalates to
the emergency room. That in-person diagnostic/treatment cycle is repeated during the ~500MM visits to primary care
annually in the U.S., and the pattern hasn’t changed much in 100 years.

                                                                                                                          21
You can also read