Outlook for Tungsten - Geologian tutkimuskeskus
←
→
Page content transcription
If your browser does not render page correctly, please read the page content below
Geological Survey of Finland
 KTR Unit
 Espoo Office                                            29.1.2021                   2/2021

                               Outlook for Tungsten

                                              Simon Michaux

Geologian tutkimuskeskus | Geologiska forskningscentralen | Geological Survey of Finland
Espoo • Kokkola • Kuopio • Loppi • Outokumpu • Rovaniemi
www.gtk.fi • Puh/Tel +358 29 503 0000 • Y-tunnus / FO-nummer / Business ID: 0244680-7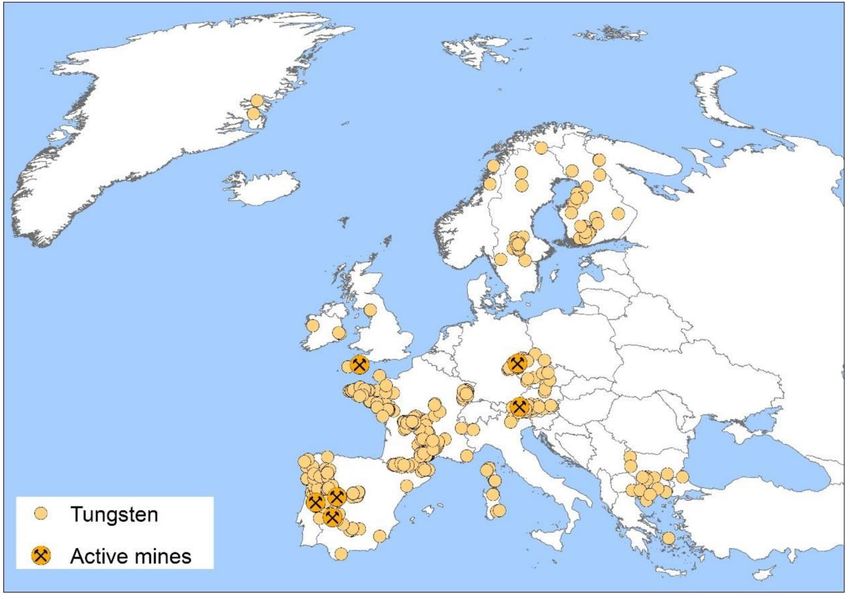
Geological Survey of Finland                            Outlook for Tungsten

GEOLOGICAL SURVEY OF FINLAND                           DOCUMENTATION PAGE
                                                       Date: 29/1/2021

 Authors                                                 Type of report
 Simon Michaux                                           Open file work report
 Associate Professor, GTK
                                                         Commission by
                                                         GTK, KTR unit
 Title of report
 Outlook for Tungsten
 Abstract
 Tungsten is a very unusual metal element that is useful in many applications. Its material
 properties make it ideal as an alloy component, which makes tungsten a technology industrial
 metal.
 Tungsten has been classified as a Critical Raw Material by the European Commission.
 Scheelite and wolframite are the only tungsten minerals mined commercially and are mainly
 found in five types of deposits: skarn, vein/sheeted vein/stockwork, porphyry, disseminated and
 stratabound.
 Tungsten ore can be complex, which can result in challenging beneficiation results. Due to the
 brittle character of both scheelite and wolframite, comminution is carefully designed to avoid
 overgrinding, that is, to minimize formation of fines. Rod milling of scheelite has some
 advantages to ball milling in this context. Gravity concentration and flotation are the
 beneficiation techniques most commonly applied to scheelite ore, and gravity and/or magnetic
 separation for wolframite ore. Magnetic separation of tungsten minerals can be viable in some
 ore specific circumstances. Hydrometallurgy can be used to extract tungsten, depending on the
 ore texture and mineral content. X-ray sorting and gravitational methods can be used for pre-
 concentration. Optical sorting and/or hand-picking methods are also used for pre-concentration
 of wolframite ore.
 Tungsten concentrates are subject to further processes to output a number of saleable tungsten
 products. Recycling can be done technically but is usually not economically viable. There are
 some options for substitution of tungsten in manufacture but not for all applications. This implies
 the best source of tungsten at this time would come from the mining of mineralized resources.

 Keywords
 tungsten, scheelite, wolframite, CRM, beneficiation, recycling, products

 Geographical area
 N/A

Geologian tutkimuskeskus | Geologiska forskningscentralen | Geological Survey of Finland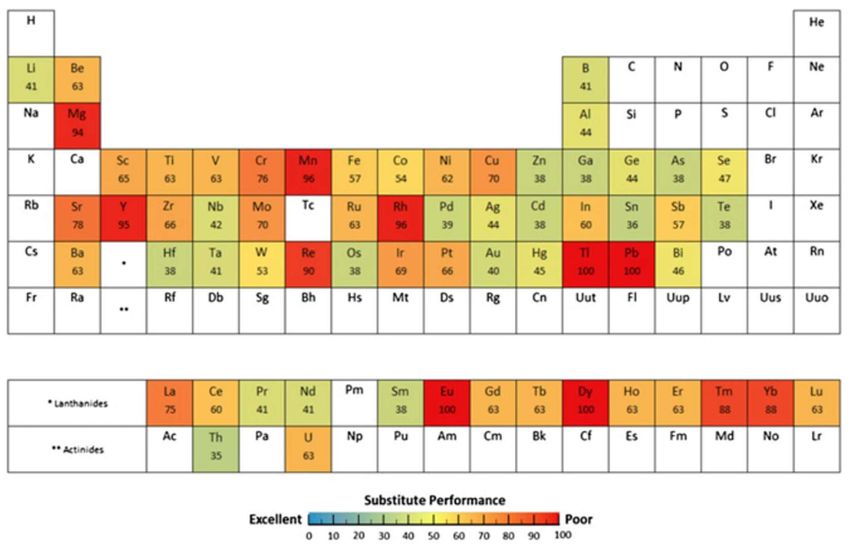
Geological Survey of Finland                            Outlook for Tungsten

 Map sheet
 N/A
 Other information
 N/A
 Report serial                                           Archive code
 2/2021

 Total pages                 Language                    Price                        Confidentiality
 56                          English                     N/A                          N/A
 Unit and section                                        Project code
 KTR
 Signature/Simon Michaux                                 Signature/ Jouko Nieminen

 Associate Professor Geometallurgy                       Jouko Nieminen, Head of Unit, KTR unit

                                                         Head of Unit – Circular Economy Solutions KTR

Geologian tutkimuskeskus | Geologiska forskningscentralen | Geological Survey of Finland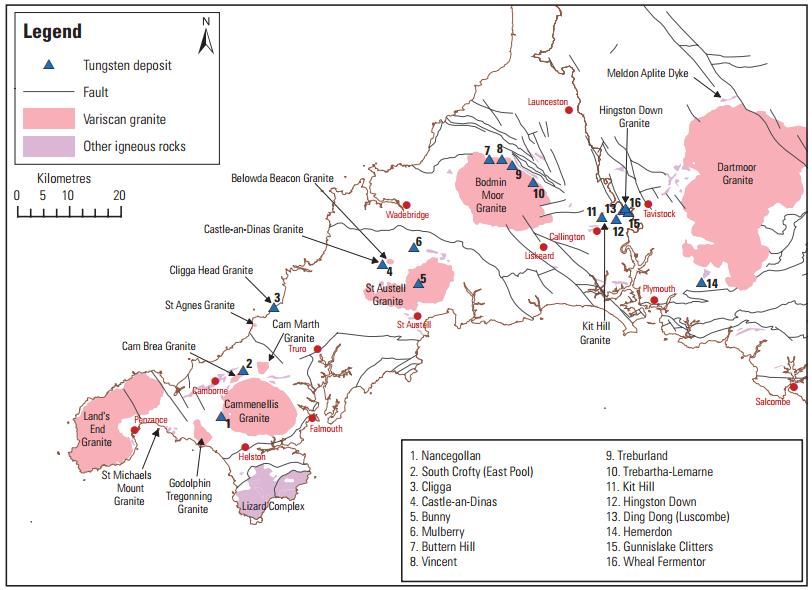
Geological Survey of Finland                            Outlook for Tungsten

Contents
Documentation page
1     Introduction                                                                         1
2     Properties of Tungsten metal                                                         1
3     Use and applications of Tungsten                                                     3
    3.1    Cemented Carbides                                                               4
    3.2    Tungsten in Steel as an Alloy                                                   4
    3.3    Lamp Industry                                                                   5
    3.4    Chemical Applications                                                           5
    3.5    Electronics and Electrical Industry                                             6
    3.6    Military use and Application of Tungsten                                        6
4     Tungsten demand consumption                                                          7
    4.1    European Import Reliance for Tungsten                                           9
5     Tungsten CRM Profile within the European Union                                       11
6     Tungsten as a Conflict Metal/Mineral                                                 13
7     Substitution options for Tungsten                                                    14
8     Future use of Tungsten                                                               16
9     Ore characteristics of Tungsten                                                      17
10 Global Tungsten reserves & Resources                                                    21
    10.1     European Resources                                                            23
11 Global mining production of Tungsten                                                    27
    11.1     Chinese Production of Tungsten                                                31
    11.2     Vietnamese Production of Tungsten                                             31
    11.3     European Production of Tungsten                                               31
12 Beneficiation of Tungsten                                                               33
    12.1     Comminution of Tungsten                                                       34
    12.2     Sorting of Tungsten                                                           34
    12.3     Gravity Separation of Tungsten                                                34
    12.4     Magnetic Separation of Tungsten                                               34
    12.5     Flotation of Tungsten                                                         35
    12.6     Hydro-metallurgy of Tungsten                                                  35
    12.7     Pyrometallurgy of Tungsten                                                    36
    12.8     Fine and very fine scheelite and wolframite recovery                          36
13 Tungsten Product Manufacture                                                            37

Geologian tutkimuskeskus | Geologiska forskningscentralen | Geological Survey of Finland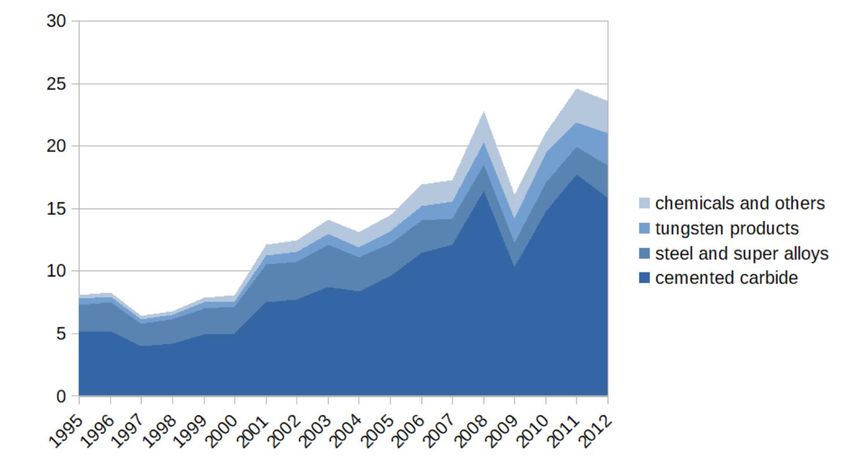
Geological Survey of Finland                            Outlook for Tungsten

  13.1       Concentrates                                                                  37
  13.2       Ammonium Paratungstate                                                        38
  13.3       Tungsten Oxides & Acid                                                        38
  13.4       Tungsten Powder                                                               40
  13.5       Tungsten Carbide Powder                                                       41
  13.6       Ferro-Tungsten & Melting Base                                                 41
14 Recycling options for Tungsten                                                          42
  14.1       Waste rock and mill tailings                                                  44
  14.2       Tungsten containing grinding sludge/swarf                                     44
  14.3       Mill scale                                                                    45
  14.4       Other residues                                                                45
15 Summary                                                                                 45
16 References                                                                              47

Geologian tutkimuskeskus | Geologiska forskningscentralen | Geological Survey of Finland
Geological Survey of Finland                             Outlook for Tungsten                              1/52

1    INTRODUCTION
This report is a general introduction to tungsten. Issues covered are what tungsten is, what it is used
for, market demand, substitution options, tungsten minerals, tungsten ore and deposit classes, global
reserves and resources, tungsten global production, mineral processing beneficiation, tungsten
product manufacture and recycling. As with all useful metals/minerals, there are specific issues around
the tungsten value chain that need to be understood for its effective use.

2    PROPERTIES OF TUNGSTEN METAL
Tungsten, also known as wolfram, with symbol W and atomic number 74, has the highest melting point
of all metals (3422 ± 15 °C). With its density of 19.25 g/cm3, tungsten is also among the heaviest metals.
Tungsten (W) is a lustrous greyish-white metal, which is a solid at room temperature. It has the highest
melting point and lowest vapor pressure of all metals, and at temperatures over 1650 °C has the highest
tensile strength. It has excellent corrosion resistance and is attacked only slightly by most mineral acids.
Tungsten has been listed as one of critical raw materials in Europe due to its high economic importance
and the fact that its supply is at risk. Table 1 and 2 shows the material properties of tungsten.

                         Table 1. Material properties of Tungsten (Source: Haynes et al 2016)

                Material Property                 Value                                     Units
      Atomic Number                               74
      Atomic Weight                               183.86
      Group Number                                6
                                                  1s2 2s2 2p6 3s2 3p6 4s2 3d10 4p6
      Electron Configuration
                                                  5s2 4d10 5p6 6s2 4f14 5d4
      CAS Registry Number                         7440-33-7

      Atomic Volume                               9.53
      Lattice Type                                Body Centered Cube
      Lattice Constant at 20 ºC,                  3.1585                                    Angstroms
      Natural Isotopes                            180, 182, 183, 184, 186

      Density @ 20 ºC                             19.3                                      (gm/cc)
      Density @ 20 ºC                             0.697                                     (lb./cu. in.)

      Melting Point                               3410                                      0C

      Boiling Point                               5530                                      0C

    Linear Coefficient of Expansion per ºC        4.3 x 10E-6
      Thermal Conductivity @ 20 ºC                0.40                                      (cal/cm/ºC/sec)
      Specific Heat @ 20 ºC                       0.032                                     (cal/gram/ºC)

Geologian tutkimuskeskus | Geologiska forskningscentralen | Geological Survey of Finland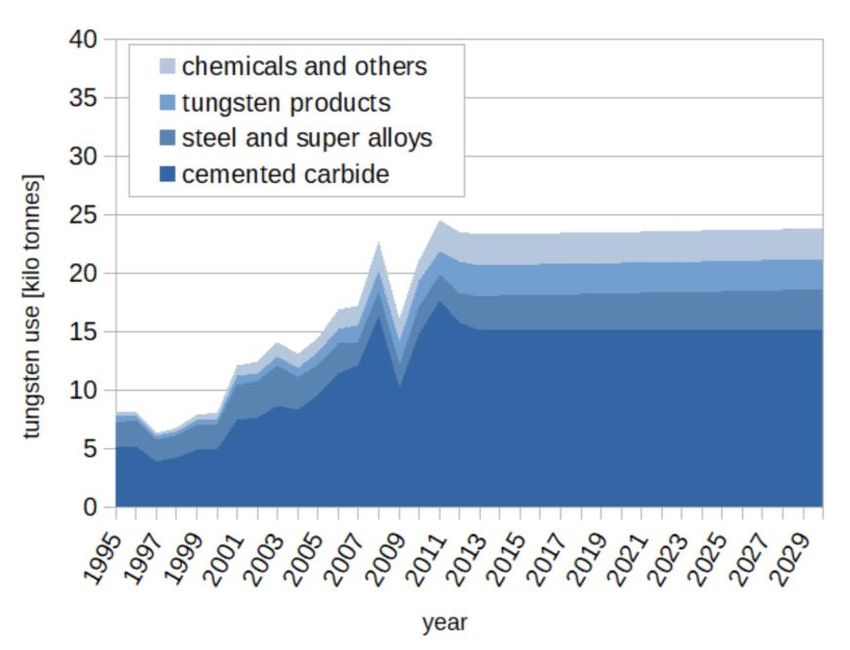
Geological Survey of Finland                             Outlook for Tungsten                          2/52

                         Table 2. Material properties of Tungsten (Source: Haynes et al 2016)

               Material Property                 Value                                  Units
       Electronegativity (eV) Pauling            2.36                                   eV
       Electronegativity (eV) Sanderson          0.98                                   eV
       Electronegativity (eV) Allred
       Rochow                                    1.40                                   eV

       Electrical Conductivity, % IACS           31
       Electrical Resistivity @ 20 ºC            5.5                                    (microhm-cm)
       Electrical Resistivity @ 227 ºC           10.5                                   (microhm-cm)
       Electrical Resistivity @ 727 ºC           24.3                                   (microhm-cm)
       Electrical Resistivity @ 1727 ºC          55.7                                   (microhm-cm)
       Electrical Resistivity @ 2727 ºC          90.4                                   (microhm-cm)
       Electrical Resistivity @ 3227 ºC          108.5                                  (microhm-cm)
       Temperature Coefficient of
       Electrical Resistivity                    0.0046                                 Per ºC (0 – 100 ºC)

       Tensile Strength @ Room Temp.             100,000 – 500,000                      psi
       Tensile Strength @ 500 0C                 75,000 – 200,000                       psi
       Tensile Strength @ 1000 0C                50,000 – 75,000                        psi
       Poisson’s Ratio                           0.284

       Hardness (Mineral)                        7.5
       Hardness (Vickers)                        343
       Hardness (Brinell)                        2570

        Reflectivity                             62%

       Total Emissivity @ 1500 0C                0.23
       Total Emissivity @ 2000 0C                0.28

       Working Temperature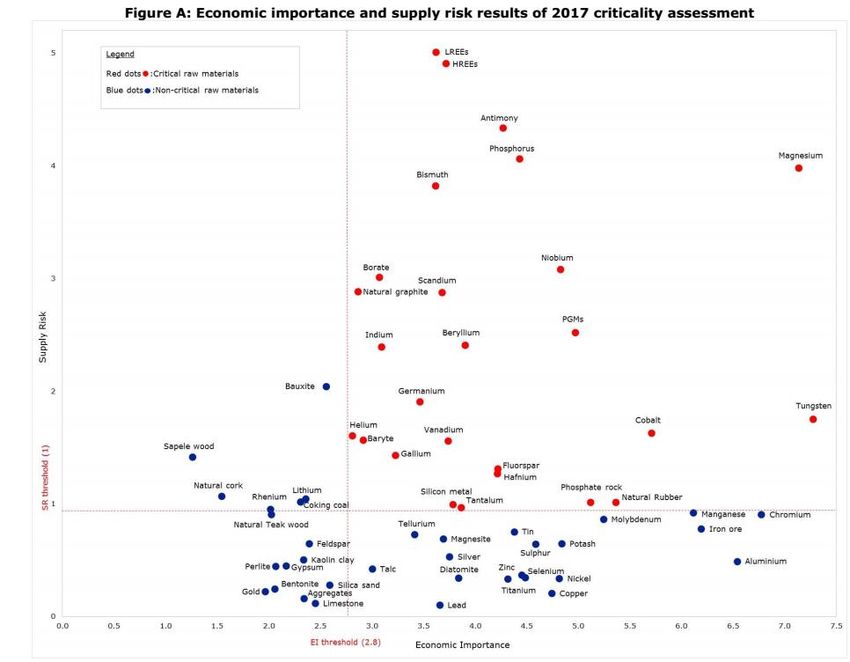
Geological Survey of Finland                             Outlook for Tungsten                          3/52

3    USE AND APPLICATIONS OF TUNGSTEN
Tungsten is another relatively rare metal, with highly specialized applications, particularly within old-
style incandescent lamp manufacture, special alloys and hard materials, as well as catalysts and military
applications. Because tungsten oxides have two unique properties—intercalation and
polycondensation—there is a great opportunity for tungsten to be used in fuel cell or energy-saving
technologies in the future.
Table 3 shows an overview of estimated use of tungsten in Europe in 2012. Table 4 shows some
tungsten compounds. Figure 1 shows an estimation of historical use of tungsten in Europe.

               Table 3. Overview of estimated use of tungsten in Europe in 2012 (Source: SCRREEN 2.3)

                     Figure 1. Estimation of historical use of tungsten in Europe from 1995 to 2012
                                    (Source: SCRREEN 3.2, Data from Mesman 2016)

Geologian tutkimuskeskus | Geologiska forskningscentralen | Geological Survey of Finland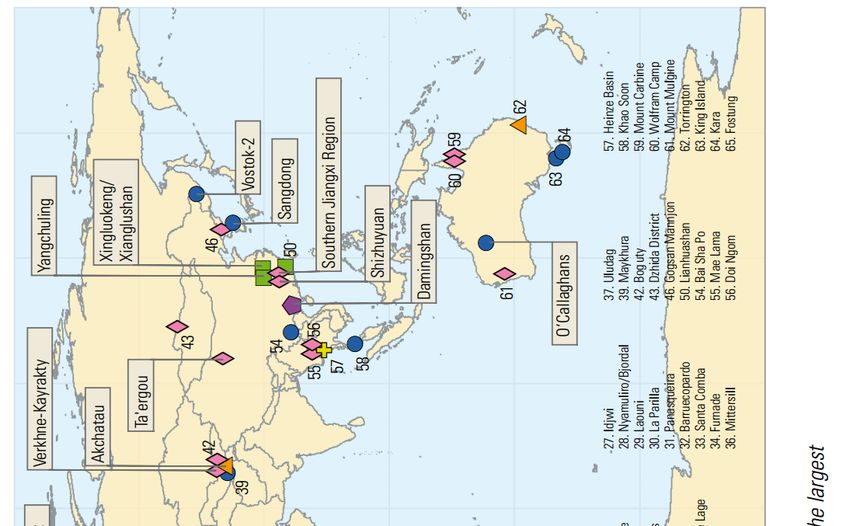
Geological Survey of Finland                            Outlook for Tungsten                            4/52

      Table 4. List of some important tungsten compounds (Source: International Tungsten Industry Association).

                 Compound Names                                     Applications
              Tungsten Silicide              Microelectronics
              Calcium Tungstate              Phosphors
              Heterpolytungstates            Lackers and toners
                                             Catalysts
                                             Passivation of steel
              Na-12 Tungstophosphate         Manufacture of organic pigments
                                             Carroting (surface treating of furs)
                                             Antistatic agent for treatment of acryl-based fibres
                                             Leather tanning
                                             Water proofing
                                             Additive to chrome-plating bath, in cements and
                                             adhesives to impart water resistivity
              Tungsten Disulfide             Lubricant
              Tungsten Diselenide            Lubricant
              Tungsten Hexaflouride          For metallisation in the semiconductor industry
              Tungsten Hexachloride          Metallization
              Tungsten Hexacarbonyl          Catalyst and organometallic compounds production

3.1   Cemented Carbides
Cemented carbides, or hardmetals as they are often called, are materials made by "cementing" very
hard tungsten monocarbide (WC) grains in a binder matrix of a tough cobalt or nickel alloy by liquid
phase sintering. This accounts for approximately 60% of tungsten use. Cemented carbides combine
the high hardness and strength of metallic carbides (WC, TiC, TaC) or carbonitrides (eg TiCN) with the
toughness and plasticity of a metallic alloy binder (Co, Ni, Fe), in which the hard particles are evenly
distributed to form a metallic composite. Tungsten carbide is the most metallic of the carbides, and
by far the most important hard phase. The more hard carbide particles are within the material, the
harder it is but the less tough it behaves during loading; and, vice versa, significant increases in
toughness are achieved by a higher amount of metallic binder at the expense of hardness.
Within the field of engineering materials, cemented carbides play a crucial role as they combine high
hardness and strength with good toughness within a wide property range, and thus constitute the most
versatile hard materials group for engineering and tooling applications.

3.2   Tungsten in Steel as an Alloy
Tungsten is used in high speed steel, which can contain as much as 18% tungsten. Due to its properties,
tungsten is used in aerospace and automotive industries and radiation shielding. Tungsten was among
the first alloying elements systematically studied and used to improve steel properties, for example
hardness, cutting efficiency and cutting speed of tool steels. Different tungsten containing steels were
developed in Austria, Germany, France and England, followed by high speed steels in the USA.
The addition of tungsten to construction steels has decreased since 1940 because alloying with Mo and
Cr, as well as with V and Ni, yielded better performance at a lower price. From 1927, when cemented
carbides (hardmetals) were developed, the production of total tungsten consumed in steelmaking

Geologian tutkimuskeskus | Geologiska forskningscentralen | Geological Survey of Finland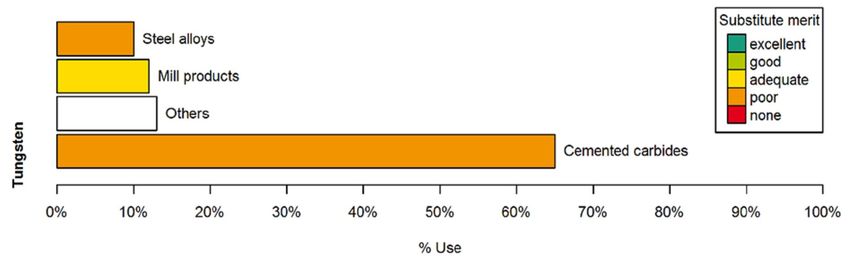
Geological Survey of Finland                             Outlook for Tungsten                            5/52

declined constantly to a current figure of about 20%, but nevertheless steel is today the second biggest
consumer. Figure 2 shows how tungsten alloys are used in the aeronautics industry.

         Figure 2. Production indicator (prod/imp+prod) for aeroplane alloy value chain in 2015, 2016 and 2017
                                                (Source: SCRREEN 5.3)

3.3   Lamp Industry
The use of tungsten filaments in light bulbs has become a matter of course, in particular in domestic
lighting. Tungsten is used in this application because of its extremely high melting temperature (~3,695
K), low vapour pressure, high stiffness and excellent creep resistance at elevated temperatures.
About 4% of the annual tungsten production is consumed by the lighting industry, which uses about
15% of the global electric power produced worldwide.

3.4   Chemical Applications
Tungsten sulphide is a high temperature lubricant and is a component of catalysts for
hydrodesulfurization (Spivey 2002). Tungsten oxides are used in ceramic glazes and
calcium/magnesium tungstates are used widely in fluorescent lighting. The y are also used in selective
catalytic reduction (SCR) catalysts found in coal-fired power plants. Crystal tungstates are used as
scintillation detectors in nuclear physics and nuclear medicine. There are a number of Tungsten
chemicals that have been used in the medical and dental fields for X-ray shielding and conversely, X-
ray opacity. Other salts that contain tungsten are used in the che mical and tanning industries.

Geologian tutkimuskeskus | Geologiska forskningscentralen | Geological Survey of Finland
Geological Survey of Finland Outlook for Tungsten 6/52
3.5 Electronics and Electrical Industry
Elemental Tungsten is used in many high-temperature applications, such as light bulb, cathode-ray
tube, and vacuum tube filaments, heating elements, and rocket engine nozzles. Thanks to its
conductive properties it is also used in electrodes and in the emitter tips in electron -beam instruments
that use field emission guns, such as electron microscopes.
Tungsten is practically the only material used for electron emitters. Although other, more
electropositive, metals would yield higher emission rates, the advantage of tungsten is its extremely
low vapor pressure even at high temperatures.
This property is also important for electrical contact materials. While more conductive metals like
copper or silver evaporate (erode) under the conditions of an electric arc, tungsten withstands these.
Tungsten is one of the most important components in modern integrated circuitry and tungsten-
copper heat sinks are used to remove the heat of microelectronic devices.
3.6 Military use and Application of Tungsten
Tungsten is used by the military to produce bullets, due to its hardness and high density. Where
tungsten is most effective is to produce armor penetrating bullets. Thus, it is required to use military
weapons made with tungsten in them, to maintain a tactical edge in a military conflict. Tungsten metal
is used in many applications from bullets, grenades to even rockets. The combination of tungsten and
carbon the Tungsten Carbide is also used because it has, even more, strength and it is more durable
than the pure tungsten. Tungsten can also be used for nuclear weapon material shell protection.
While this application accounts for a very small proportion of total global demand, it does create a
geopolitical sensitivity.
Ammunition
Tungsten is almost an indispensable part of armor-piercer. The kinetic armor-piercer made from
tungsten alloy can compete directly with the depleted uranium bomb (depleted uranium has become
an environmental problem, where the Gulf War battlefields of Kuwait have become a case study )
(Source: U.S. Department of Defense 2004).
Compared to lead and depleted uranium, the combination of tungsten and carbon is proving to be less
environmentally hazardous, where the presence of spent ammunition in large volumes has led to
problems in the past.
• The GNU-44 Viper Strike missile, carried by armed drones, has a tungsten sleeve to produce
antipersonnel shrapnel.
• The 130-round-per-second Phalanx anti-missile Gatling gun, deployed on U.S. and Royal Navy
ships, originally used DU rounds. They were replaced with tungsten, for environmental reasons.
• 120mm anti-tank rounds, use tungsten as an alternative to DU in training. So do the 25mm anti-
tank rounds, on board the M2/M3 Bradley fighting vehicle.
• Armor-piercing .308 M993 rifle rounds.
Geologian tutkimuskeskus | Geologiska forskningscentralen | Geological Survey of FinlandGeological Survey of Finland Outlook for Tungsten 7/52
• The 120mm M1028 anti-personnel round, fired by the Abrams tank. This round is essentially a
large shotgun shell loaded with 1100 tungsten balls, each 3/8th of an inch in size.
• Dense Inert Metal Explosives, the "focused lethality" munition used by the U.S. and Israel. It
contains micro-shrapnel made of tungsten powder.
• Some 70mm rockets fired by Apache helicopters release tungsten flechettes.
Vehicle use
Another very common use of this metal is in military vehicles, usually, helicopters and aircraft and
sometimes for armored vehicles. Tungsten is used in helicopters to even out the weight of the rotors,
skids or the craft nose. This metal is used because it has a great size to weight ratio, where a small
volume has a comparatively high mass. Sometimes it is also used for protection of some vehicles
because of its material strength.
Tungsten toxicity
The use of tungsten as an alternative to depleted uranium to manufacture armor piecing ammunition
may not be as environmentally ‘clean’ as previously thought. Which means all sorts of rockets,
missiles, and anti-tank rounds may present an environmental hazard and a health risk.
The British Army looked into the tungsten problem in (Doust et al 2007). A study of possible
implications found that there was tungsten in the ground water of at least one UK tank firing range,
and recommended that further studies be carried out. The literature review in this study identified
the relative lack of knowledge regarding the behavior and toxicity of tungsten in the environment and
that there are few legislative standards or guidance for tungsten in the environment.
Meanwhile, the United States Army seems to still trying to establish a consistent approach. On one
hand, the US military has recommended the stopping production of tungsten-based training
ammunition, while simultaneously looking into using tungsten as a DU-replacement in a wider scope
of application.
This issue may make the future use of tungsten in military applications more difficult.
4 TUNGSTEN DEMAND CONSUMPTION
Cemented carbides, steel and alloys, mill products, and chemicals and specialists are the main
applications of tungsten. The consumption of W continues to increase as the amount of carbide tool
production increases with the expansion of markets in developing countries.
China was the world’s leading tungsten consumer. Analysts forecast global tungsten demand in 2019
to be less than that in 2018, as a result of destocking by consumers and reduced consumption owing
to reported slowing global economic growth. Proportions of demand in Europe are shown in Figure 3.
Geologian tutkimuskeskus | Geologiska forskningscentralen | Geological Survey of FinlandGeological Survey of Finland Outlook for Tungsten 8/52
Figure 3. Distribution of recent tungsten demand in the EU
(Source: Tercero Espinoza et al 2018, data from Argus Media 2016)
This section firstly describes what ‘apparent consumption’ and ‘import reliance’ are and how they can
be measured. The levels of apparent consumption for each CRM are presented, where possible,
followed by an assessment of the import reliance position in 2015. Data relating to ‘true’ consumption
are not generally collected from mineral processors and manufacturers. The ‘apparent’ consumption
can be calculated (at either a national or EU level) using the formula:
Apparent Consumption = Production + Imports – Exports +/– Stock Changes
Figure 4. Apparent consumption of tungsten in Europe 2000 to 2015
(Source: Brown et al 2018)
Geologian tutkimuskeskus | Geologiska forskningscentralen | Geological Survey of FinlandGeological Survey of Finland Outlook for Tungsten 9/52
4.1 European Import Reliance for Tungsten
Import reliance is defined as the proportion of a nation state’s consumption of a mineral commodity
that is imported from elsewhere. In precise terms, it is ‘net import reliance’ because ex ports also have
to be taken into account in case part of the import quantity is immediately re‐exported. Import reliance
can be calculated using the following formula, which assumes ‘consumption’ is apparent consumption,
and is expressed as a percentage:
Import Reliance = (Imports – Exports) / Apparent Consumption x 100
Trends in import reliance are presented in the following charts (where data are available) is shown in
Figures 5 to 7.
Figure 5. Tungsten ore & concentrates European import reliance
(Source: Brown et al 2018)
Geologian tutkimuskeskus | Geologiska forskningscentralen | Geological Survey of FinlandGeological Survey of Finland Outlook for Tungsten 10/52
Figure 6. Tungsten intermediates European import reliance
(Source: Brown et al 2018)
Figure 7. Tungsten refined products European import reliance
(Source: Brown et al 2018)
Geologian tutkimuskeskus | Geologiska forskningscentralen | Geological Survey of FinlandGeological Survey of Finland Outlook for Tungsten 11/52
5 TUNGSTEN CRM PROFILE WITHIN THE EUROPEAN UNION
Due to its economic importance, and high supply risk, tungsten has been listed as a critical raw material
for the EU since the original criticality assessment in 2010 (European Commission 2010, 2014b, 2017b).
The British Geological Survey's risk list ranked tungsten in the top ten materials facing potential supply
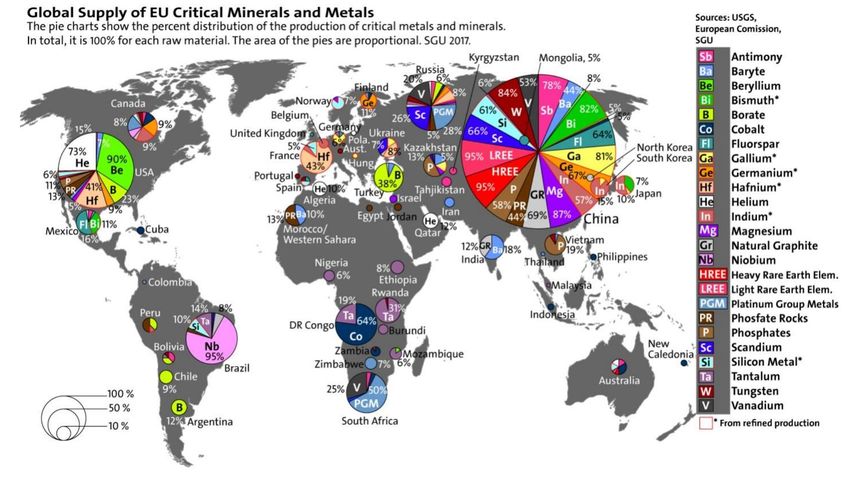
disruptions (BGS 2011b, 2012, 2015). Figure 8 and Table 5 shows the current CRM map (European
Commission 2017). Figure 9 shows the global critical mineral supply to Europe. Europe has mines of
tungsten in its territory but the mine production still does not meet the demand of the European
industries.
Figure 8. Economic importance and supply risk results of 2017 criticality assessment
(Source: European Commission 2017)
Table 5. The list of Critical raw Materials (excluding natural rubber) (Source: European Commission 2017)
Geologian tutkimuskeskus | Geologiska forskningscentralen | Geological Survey of FinlandGeological Survey of Finland Outlook for Tungsten 12/52
Figure 9. Countries accounting for largest share of global supply of CRMs (Source: SGU 2016)
Geologian tutkimuskeskus | Geologiska forskningscentralen | Geological Survey of FinlandGeological Survey of Finland Outlook for Tungsten 13/52
Many CRM, particularly the critical metals, are produced in very small quantities globally and the total
production value of many of them is relatively low. For this reason some critical metals are also
classified as ‘minor metals’. The mining and processing of the ores of the minor metals is generally less
economically attractive to major mining companies than that of the major industrial metals, such as
iron ore and bauxite, where the production level is orders of magnitude larger, where the markets are
well established and relatively stable, and where the risks are lower and p rofits potentially greater.
Accordingly both the mining and processing of minor metals tends to be carried out by a relatively
small number of companies operating at only a few locations where the resources are located and/or
the appropriate processing technology is in place. Figure 10 shows the comparative production
volumes between different technology minerals and CRM minerals compared to bauxite in 2015. Note
W at the top right hand side of the figure.
Figure 10. Indicative global annual production (metric tonnes, log scale) of selected metals and ores in 2015. Elements
highlighted in red are CRM minerals. (Source: Brown et al 2018, data from BGS, 2017 and USGS Mineral Commodity
Summaries). Those metals and ores in red are currently classified as critical the EU (EC, 2017a).
6 TUNGSTEN AS A CONFLICT METAL/MINERAL
Conflict minerals are minerals mined in politically unstable areas, where armed groups often use forced
labor to mine minerals, or minerals are mined in conditions of armed conflict and human rights abuses.
Also, minerals that are sold or traded by armed groups to fund their activities, for example to buy
weapons. The European Commission has passed regulations (European Commission trade policy
regulations: https://ec.europa.eu/trade/policy/in-focus/conflict-minerals-regulation/) to address:
• Conflict minerals and metals from being exported to the EU;
• Global and EU smelters and refiners from using conflict minerals, and;
• Mine workers from being abused.
The law (starts to apply on 1 January 2021) also supports the development of local communities. It
requires EU companies to ensure they import these minerals and metals from responsible sources only.
Tungsten is used to make armor piercing ammunition and is used in many military applications that are
required to maintain a technological competitive edge, has resulted in tungsten to be considered a
conflict metal. This combination makes tungsten a geopolitically sensitive metal. Table 6 shows the
conflict mineral list according to the United Kingdom guidance.
Geologian tutkimuskeskus | Geologiska forskningscentralen | Geological Survey of FinlandGeological Survey of Finland Outlook for Tungsten 14/52
Table 6. Conflict minerals according to United Kingdom government guidance
(Source: United Kingdom Government conflict minerals Guidance: https://www.gov.uk/guidance/conflict-minerals)
Mineral Mineral Source Major Applications
Cassiterite Ore from which tin is extracted Plating and solders for joining pipes and
electronic circuits
Columbite- Ore from which tantalum is Electrical components (including those
tantalite extracted used in mobile phones, computers,
videogame consoles), aircraft and surgical
components
Gold Rare metal found in a native (pure) Jewellery, electronic, communications and
form and obtained as a by-product aerospace equipment
of other mining operations
Wolframite Ore from which tungsten is Metal wires, electrodes and contacts in
extracted lighting, electronic, electrical, heating and
welding applications
Mining is an intensive process involving potential social and environmental risks that, if not properly
managed, can cause lasting negative impacts. A growing perception supports that these risks are
associated with a variety of metals and minerals that extend beyond tin, tungsten, tantalum and gold
(3TG). NGO groups like Responsible Minerals Initiative and Minerals Due Diligence seek to raise
awareness of this (Source: http://www.responsiblemineralsinitiative.org/).
“Conflict minerals,” as defined by the US legislation, currently include the metals tantalum, tin,
tungsten and gold, which are the derivatives of the minerals cassiterite, columbite -tantalite and
wolframite, respectively. Downstream companies often refer to the derivatives of these minerals as
3TG.
Some of the mining of minerals in the Democratic Republic of Congo (DRC) has been classified in the
conflict minerals spectrum. Conflict minerals in the eastern DRC are generally defined (including in US
legislation and the OECD due diligence guidance for responsible mineral supply chains) as cassiterite
(tin), coltan (tantalum), wolframite (tungsten) and gold, or derivatives of these minerals. Sometimes
these minerals are referred to as the ‘three Ts’ - tin, tantalum and tungsten.
This has an outcome that any tungsten producer in the world has to comply with conflict mineral
classification legislation from the United States, United Kingdom, Europe EU -28 and the OECD.
7 SUBSTITUTION OPTIONS FOR TUNGSTEN
The “Substitutability Index” is a measure of the difficulty in substituting the material, scored and
weighted across all applications. Values are between 0 and 100, with 100 being the least substitutable
(Bouyer 2019). Figure 11 shows all elements on the periodic table in context of the Sustainability Index.
Geologian tutkimuskeskus | Geologiska forskningscentralen | Geological Survey of FinlandGeological Survey of Finland Outlook for Tungsten 15/52
Figure 11. The periodic table of substitute performance (Source: Bouyer 2019)
Potential substitutes for cemented tungsten carbides include cemented carbides based on
molybdenum carbide, niobium carbide, or titanium carbide; ceramics; ceramic-metallic composites
(cermets); and tool steels. Most of these options reduce, rather than replace, the amount of tungsten
used.
Potential substitutes for other applications are as follows: molybdenum for certain tungsten mill
products; molybdenum steels for tungsten steels, although most molybdenum steels still contain
tungsten; lighting based on carbon nanotube filaments, induction technology, and light -emitting
diodes for lighting based on tungsten electrodes or filaments; depleted uranium or lead for tungsten
or tungsten alloys in applications requiring high-density or the ability to shield radiation; and depleted
uranium alloys or hardened steel for cemented tungsten carbides or tungsten alloys in armor-piercing
projectiles. In some applications, substitution would result in increased cost or a loss in product
performance.
Geologian tutkimuskeskus | Geologiska forskningscentralen | Geological Survey of FinlandGeological Survey of Finland Outlook for Tungsten 16/52
For tungsten's main application, WC-based cemented carbides, substitution is appears technically
possible but implies higher costs and, in some cases, a decrease in performance. Titanium carbides (Ti-
C) and nitride (Ti-N) are potential substitute but the technology is not competitive at the moment.
Tungsten can be replaced by other refractory metals such as niobium (CRM) or molybdenum in ste el
products. In other application areas, possible substitution of tungsten is affordable, as super -alloys
substituted by Ceramic Matrix Composites (CMCs) made from a silicon carbide/nitride matrix for gas
turbine engines (Tercero Espinoza et al 2018). Also, substitution with nanostructured n-alloys such as
Fe-Ta, is could be possible in 10 year since current TRLs are very low (TRL 3-4).
Figure 12. Summary substitutability assessment for tungsten
(Source: Tercero Espinoza et al 2018)
8 FUTURE USE OF TUNGSTEN
The predicted future use of tungsten is not thought to be that different in proportion of application or
volumes for the foreseeable future.
Figure 13. Scenario for the future use of tungsten in Europe. Future use is determined by the assumption of a constant
volume of construction work and manufacturing work in Europe for the coming decade.
(Source: SCRREEN 3.2)
Geologian tutkimuskeskus | Geologiska forskningscentralen | Geological Survey of FinlandGeological Survey of Finland Outlook for Tungsten 17/52
9 ORE CHARACTERISTICS OF TUNGSTEN
The average abundance of tungsten in the earth’s crust is estimated to be 1.25–1.5 ppm, about the
same as that of tin and molybdenum. It is more abundant in granite (about 2 ppm) than basaltic (1
ppm) and ultra-mafic rocks (0.5 ppm). Table 6 shows the basic properties and W content of the most
common tungsten bearing minerals.
Table 7. Properties of the most common tungsten minerals (Reproduced from BGS Tungsten Mineral Profile 2011)
Mineral Chemical Tungsten Content Specific Gravity Crystal
3 Appearance (colour and lustre)
Name Formula (WO3 %) (g/cm ) Structure
Feberite FeWO4 76.3 7.5 Black, sub-metallic to metallic Monoclinic
Dark grey to black, sub-metallic
Wolframite (Fe,Mn)WO4 76.5 7.1-7.5 Monoclinic
to metallic
Re-brown to black, sub-metallic
Hubnerite MnWO4 76.6 7.2-7.3 Monoclinic
to adamantine
Pale yellow to orange, green to
dark brown, pinkish-tan, dark
Scheelite CaWO4 80.6 5.4-6.1 Tetragonal
blue to black, white or
colourless, vitreous or resinous
Reddish-brown to yellow-green,
Stolzite PbWO4 50.9 8.28 Tetragonal
sub-adamantine to resinous
There are numerous tungsten minerals, but only scheelite (CaWO 4) and wolframite ((Fe, Mn)WO 4) are
of economic importance (Schmidt 2012a & 2012b; BGS, 2011). However, wolframite is not a mineral
species but a series between ferberite (FeWO 4) and hubnerite (MnWO4). The domination of either iron
or manganese would result in forming one of two minerals. The iron dominated one will result in
forming ferberite while the manganese dominated one will result in forming hübnerite (Errandonea
and Segura, 2010).
There are three broad types of Tungsten deposits:
• Classical vein deposits: these are more or less continuous veins of varying thickness, ranging from several
decimetres to several metres, mainly comprised of quartz contained in the granite itself or in the
surrounding host rock. Most deposits exhibit ferberite or hübnerite mineralization characteristics, but
scheelite vein deposits occur as well. Typical grades of Tungsten are of 0.5-5% WO3 . Sn typically occurs
as a by-product. In the EU, there is one active mines of this type where Tungsten is extracted: the
Panasqueira Mine in Portugal. The San Fix Mine in Spain was recently operational but has temporarily
suspended production.
• Skarn deposits: formed by replacement of carbonate rock with calc-silicate minerals in close contact
with a granitic/felsic intrusion. Mineralization characteristics can be mono-metallic Tungsten or
polymetallic (often with Mo or Pb,Zn,Cu), as well as gold, fluorite or magnetite. Typical grades are 0.3-
1% WO3 . As for the EU, one active mine of this type is found in the Los Santos mine in Spain.
• Bulk mineable deposits (greisen, porphyry, stockwork and sheeted vein): are either W-Sn, or W-Mo
deposits. Both scheelite and wolframite occur in bulk mineable deposits, and some deposits contain
both mineral together, which leads to problems with beneficiation as mixed concentrates are more
difficult to market. Typical grades are 0.1-0.3% WO3 . In EU there is a mine of this type in Austria,
Mittersill.
Geologian tutkimuskeskus | Geologiska forskningscentralen | Geological Survey of FinlandGeological Survey of Finland Outlook for Tungsten 18/52
Table 8 shows the key features of the rock texture of tungsten bearing mineralized ore. Table 9 and
10 shows the approximate size and grade of the different tungsten deposit forms. Table 11 lists the
world’s largest tungsten deposits as understood in 2011.
Table 8. Key features and examples of tungsten deposit classes (pale grey shading and black text indicate bedrock deposits;
no shading and blue text indicate superficial deposits). (Reproduced from BGS Tungsten Mineral Profile 2011), Information
partly sourcing from descriptive models compiled by the US Geological Survey (Cox and Singer, 1986) and Geological Survey
Branch of the British Columbia Ministry of Energy, Mines and Mineral Resources (Lefebure and Ray, 1995).
Deposit Type Brief Description Features Examples
Tabular or lenticular scheelite-dominated orebodies in Commonly within extensive thremal Vostok-2 (E. Siberia), Uludag
calc-silicate rocks formed by replacement of carbonate aureoles; local greisens. May be associated (Turkey), Mactung and Cantung
Skarn
rocks and more rarely carbonaceous rocks at contacts with porphyry W+/-Mo and stockwork Sn (Canada), Sang Dong (S. Korea), King
with S- and I- type granitoid intrusions deposits Island (Tasmania, Australia)
Single and multiple systems of simple or complex Greisen-bordered veins that locally pass into Panasqueira (Portugal), Xihuashan
fissure filling and replacement veins of quartz + stockworks minor breccia zones. Multiple (China), Bolsa Negra (Bolivia),
Vein
wolframite at margins of flesic plutonic rocks in clastic stages of veining +/- ore zoning with Sn, Cu, Erzgebirge (Czech Rp.), Hemerdon,
(meta-) sedimentary country rocks etc. Redmoor (south-west England)
Felsic-hosted sheeted vein - comprising a complex
multi-episodal system, making it somewhat unique, Tungsten dominated, thin (cm scale) veins Hemerdon (United Kingdom)
Sheeted Vein
both in mineralisation style and scale (Hemerdon type displaying multiple espisodes. (Reference Shail et al 2017)
deposit).
Near-vertical bodies of fragmented rock formed either Associated with vein / stockwork & Wolfram Camp (Queensland,
Breccia by hydraulic fracturing or steam-dominated volcanic porphyry deposits. Commonly zoned. Co- Australia), Doi Ngom & Khao Soon
explosions marginal to I- or A- type granitic intrusions or by-product with Cu, Mo, Ag, Sb, Sn (Thailand), Washington (Mexico)
Medium to large, low-grade stockwork of quartz Concentrically zoned metals and alteration; Xingluokeng, Fujian and Yangchulin,
Porphyry veinlets and disseminations in subvolcanic felsic characterized by pervasive greisenisation. Jiangxi, (China), Northern Dancer
intrusive rocks +/- country rocks Co-product with Mo, Sn, Ag (Canada), Climax (USA)
Low-grade greisen deposits formed by pervasive Locally merge with tungsten beraing Shizhuyuan, Xihuashan, & Dangping
Disseminated metasomatic (endoskarn) alteration in the cupolas of greisen-bordered veins and stockworks. Co- (China), Akchatau, Kara-Oba & Lultin
granitic stocks or by-product of Sn or Mo (CIS)
Concordant lenses of stratiform scheelite in submarine May include eruption breccias.
Mittersill (Austria), Damingshan,
Stratabound volcanosedimentary sequences. Volcanogenic Metamorphic remoblization into shears and
Guangxi Zhuang (China)
exhalative origin veins
Dyke-like masses around granitic bodies. Simple May be transitional with greisens and be
Okbang (S. korea), Kular & Priskatel
Pegmatite unzoned to complex strongly zoned types with more hosted by skarns. Co- or by-product with Li,
(CIS), Wodgina (W. Australia)
varied mineralogy Be, Nb, Ta, REE and Sn
Siliceous or ferro-maganiferous precipitates deposited Golconda (Nevada, USA), Uncia
Relatively high grade but small tonnage.
Hot Spring by hot groundwater and hot springs. Associated with (Bolivia), Rotorua-Taupo area (New
May be associated with Au-Ag
bedrock tungsten deposits Zealand)
Heavy mineral concentrations in alluvial, eluvial or Heinze Basin (Burma), Dzhida district
Co- or by-product of Sn. Mostly small and
Placer marine sediments derived from proximal bedrock (E. Siberia), Bodmin Moor (south-
only amenable to artisanal exploitation
sources of tungsten west England)
Tungsten-bearing brines in recent lakes and / or the
Also tungsten-rich bottom muds of brine- Searles Lake (California, USA), other
Brine slaine deposits of palaeo-lakes in arid continental
charged lakes & sabkha / playa basins. examples in the CIS and western USA
regions
Geologian tutkimuskeskus | Geologiska forskningscentralen | Geological Survey of FinlandGeological Survey of Finland Outlook for Tungsten 19/52
Table 9. Tungsten minerals and accompanying metals (Source: Yang 2018)
Deposit Type Tungsten Mineral Accompanying Metals
Skarn Sheelite Cu, Mo, Zn and Bi
Vein/Breccia/Stockwork Wolframite Sn, Cu, Mo, Bi and Au
Porphyry Wolframite and/or sheelite Mo, Bi and Sn
Disseminated Wolframite and sheelite Sn, Bi and Mo
Stratabound Sheelite
Table 10. Size and grade of major tungsten deposit types
(Reproduced from BGS Tungsten Mineral Profile 2011, Sourced from Schubert et al 2006, ITIA 2020 and Werner et al 1998)
Deposit Size Range Typical Grade of Tungsten Estimated Tungsten Metal Content of (%) of
Deposit Type
(metric tonnes) Trioxide Content (WO3 %) Known Deposits (thousand tonnes) Total
SkarnGeological Survey of Finland
Outlook for Tungsten
Geologian tutkimuskeskus | Geologiska forskningscentralen | Geological Survey of Finland
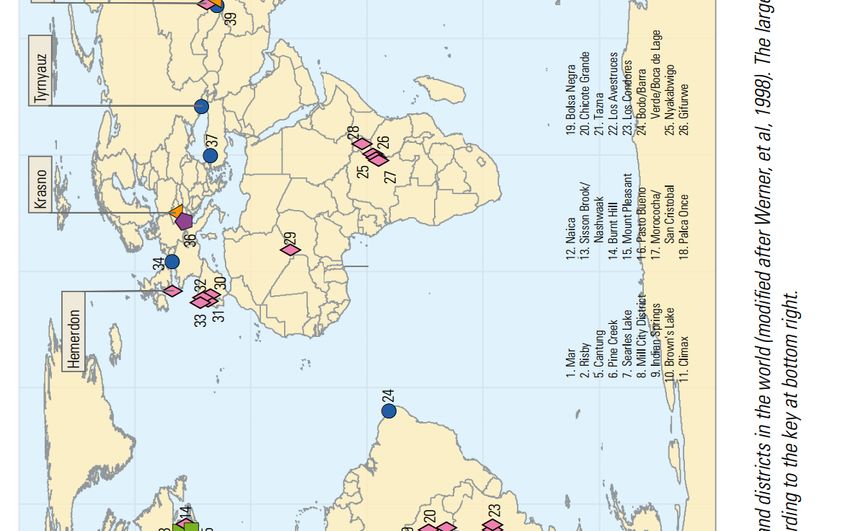
Figure 14. Location and type of major tungsten deposits and districts in the world (Reproduced from BGS Tungsten Mineral Profile 2011) (modified after Werner et
al 1998). The largest deposits are named; the smaller deposits are numbered according to the key at bottom right
20/52Geological Survey of Finland Outlook for Tungsten 21/52
10 GLOBAL TUNGSTEN RESERVES & RESOURCES
The global reserves of tungsten are shown in Figure 15, 16 and Table 11.
Global Tungsten Reserves 2020
Austria
0,31% 0,10% 7,51%
Portugal
1,69%
25,66% Russia
1,38%
Spain
United Kingdom
China
2,97%
Korea, North
0,91% Vietnam
Other
59,47%
Figure 15. Global tungsten reserves in 2020
(Source: United States Geological Survey Mineral Statistics)
Global Tungsten Reserves (2000-2018) Other
Vietnam
4 000 000
Thailand
3 500 000 Burma
Australia
3 000 000
Korea, South
Korea, North
2 500 000
(tonnes)
China
2 000 000 Brazil
Bolivia
1 500 000 United States
Canada
1 000 000
United Kingdom
Spain
500 000
Russia
0 Portugal
2016
2020
2000
2001
2002
2003
2004
2005
2006
2007
2008
2009
2010
2011
2012
2013
2014
2015
2017
2018
2019
Austria
Figure 16. Global tungsten reserves as quoted by USGS 2000 to 2020
(Source: United States Geological Survey Mineral Statistics)
Geologian tutkimuskeskus | Geologiska forskningscentralen | Geological Survey of FinlandCountry 2000 2001 2002 2003 2004 2005 2006 2007 2008 2009 2010 2011 2012 2013 2014 2015 2016 2017 2018 2019 2020
(tonnes) (tonnes) (tonnes) (tonnes) (tonnes) (tonnes) (tonnes) (tonnes) (tonnes) (tonnes) (tonnes) (tonnes) (tonnes) (tonnes) (tonnes) (tonnes) (tonnes) (tonnes) (tonnes) (tonnes) (tonnes)
Austria 10 000 10 000 10 000 10 000 10 000 10 000 10 000 10 000 10 000 10 000 10 000 10 000 10 000 10 000 10 000 10 000 10 000 10 000 10 000 10 000 10 000
Portugal 25 000 25 000 25 000 25 000 25 000 25 000 25 000 2 600 4 700 4 700 4 200 4 200 4 200 4 200 4 200 4 200 4 200 2 700 3 100 3 100 3 100
Russia 250 000 250 000 250 000 250 000 250 000 250 000 250 000 250 000 250 000 250 000 250 000 250 000 250 000 250 000 250 000 250 000 250 000 83 000 160 000 240 000 240 000
Spain 32 000 32 000 54 000 54 000 54 000
United Kingdom 51 000 51 000 43 000 43 000 44 000
Canada 260 000 260 000 260 000 260 000 260 000 260 000 260 000 260 000 260 000 260 000 110 000 120 000 120 000 120 000 290 000 290 000 290 000 290 000
United States 140 000 140 000 140 000 140 000 140 000 140 000 140 000 140 000 140 000 140 000 140 000 140 000 140 000 140 000 140 000 140 000
Bolivia 53 000 53 000 53 000 53 000 53 000 53 000 53 000 53 000 53 000 53 000 53 000 53 000 53 000 53 000 53 000 53 000
Brazil 20 000 20 000 8 500 8 500
China 850 000 820 000 770 000 1 800 000 1 800 000 1 800 000 1 800 000 1 800 000 1 800 000 1 800 000 1 800 000 1 900 000 1 900 000 1 900 000 1 900 000 1 900 000 1 900 000 1 900 000 1 800 000 1 900 000 1 900 000
Korea, North 29 000
Geological Survey of Finland
Korea, South 58 000 58 000 58 000
Australia 1 000 1 000 7 000 160 000
Burma 15 000 15 000 15 000 15 000
Thailand 30 000 30 000 30 000 30 000
Vietnam 87 000 100 000 95 000 95 000 95 000 95 000
Other 280 000 300 000 300 000 310 000 360 000 360 000 360 000 350 000 420 000 440 000 400 000 400 000 600 000 760 000 840 000 360 000 670 000 680 000 950 000 1 000 000 820 000
Global Reserves 1 992 000 1 982 000 1 926 500 2 901 500 2 898 000 2 898 000 2 898 000 2 865 600 2 937 700 2 957 700 2 767 200 2 877 200 3 077 200 3 237 200 3 487 200 3 254 200 3 307 200 3 143 700 3 115 100 3 345 100 3 195 100
Spain
China
Other
Russia
Austria
Vietnam
Portugal
Country
Korea, North
Global Reserves
United Kingdom
Outlook for Tungsten
2018
Geologian tutkimuskeskus | Geologiska forskningscentralen | Geological Survey of Finland
(tonnes)
95 000
43 000
54 000
10 000
3 100
2020
(tonnes)
1 800 000 1 900 000
95 000
44 000
54 000
10 000
3 115 100 3 195 100
29 000
3 100
160 000 240 000
950 000 820 000
Table 12. Global tungsten reserves as quoted by USGS 2000 to 2020 (Source: USGS Mineral Statistics)
22/52Geological Survey of Finland Outlook for Tungsten 23/52
World tungsten resources are geographically widespread. China ranks first in the world in terms of
tungsten resources and reserves and has some of the largest deposits. Canada, Kazakhstan, Russia, and
the United Kingdom also have significant tungsten resources.
10.1 European Resources
Tungsten resources found in Europe are listed below (Source: Lauri 2018).
Figure 17. Tungsten occurrence in the EU according to databases (FODD, Promine, M4EU)
(Source: Lauri 2018)
Austria: The resources at the Mittersill (Felbertal) mine are about 24,000 t W (Cassard et al. 2013). The
ProMine database lists also 24 other W occurrences for Austria but does not give any resource data on
them.
Bulgaria: Three occurrences with W as the main metal and a number with W as a companion metal are
listed in the ProMine database, but none with resource data.
Czech Republic: The Cinovec (Zinnwald) tin granite system has a resource of about 24,000 t W (Cassard
et al. 2013). In addition, the ProMine database lists six occurrences with W as the main metal, all
without any resource figures.
Geologian tutkimuskeskus | Geologiska forskningscentralen | Geological Survey of FinlandGeological Survey of Finland Outlook for Tungsten 24/52 Finland: Finland has 17 occurrences in the FODD database that have tungsten as the main commodity and additional six occurrences in which it is mentioned as a minor commodity (FODD 2017). Five occurrences have associated resource information and in the case of the Ylöjärvi Cu -W mine the data is for the ore mined. Altogether the four other deposits (Ahvenlammi, Apajalahti, Hieronmäki and Kuskoiva) have a non-compliant resource estimate of 2,333 t of tungsten metal, which may be considered as a minimum figure for tungsten resources in Finland. France: The ProMine database lists 15 W deposits with resource figures and about 100 occurrences without resource data in France. In total, the 15 have a resource of 66,000 t W. There is ongoing exploration to re-open the Salau Au-Cu-W mine (Couflens Project; http://apollominerals.com.au/projects/couflens-project-france/ ), in the Pyrenees, where there may be a >5 km long zone of similar orebodies to occur. The ProMine database gives 2,700 t W for the remaining ore at Salau, whereas the largest single resource in France would in the closed Montredon- Labessonnie, with 16,700 t W (Cassard et al. 2013). Germany: Tungsten is listed as a minor metal in several mineral occurrences in Germany, which are mostly granite-related. There is no resource information available for the deposits. The Pöhla deposit in Saxony is currently under investigations (SMEAG 2017). Greece: There is one medium-sized W deposit with a resource estimated in Greece: the Kimmeria polymetallic skarn. It has a non-compliant resource of 6,000 t W (Cassard et al. 2013). Greenland: Greenland comprises geological environments that are highly prospective for tungsten mineralization. However, only very limited exploration has been undertaken. East Greenland is considered to have the highest potential for vein- and skarn-type tungsten deposits (Stendal & Frei 2008). Twelve outcropping scheelite occurrences are found in a 350 km long belt in central East Greenland, encompassing the skarn-type occurrences Kalkdal, Knivbjergdal, and Trekantgletscher, and the vein type occurrences Scheelitdal, Galenadal, and Ymer Ø (drilling from three sites revealed approx. 200,000 t @ 0.7-2.5% WO3; Sørensen et al. 2014). Several tungsten anomalies associated with gold and arsenic anomalies are present within the Paleoproterozoic Ketilidian Mobile Belt in South Greenland. This tract is considered to hold a moderate potential for tungsten vein deposits. Stratabound, skarn-type scheelite occurrences are known in the Nuuk area (at Ivisaartoq), but unlikely to be of economic interest due to their intermittency. Ireland: Tungsten occurs in two separate localities in Ireland. In southeast Ireland, tungsten occurs as scheelite in veins and greisened microtonalite sheet complexes close to Ballinglen and in nearby quartz veins or segregations in the country rocks of the Ballinacor area (Gallagher, 1989). In western Ireland, tungsten occurs primarily in skarns and veins associated with granite in Connemara (Kennan et al. 1987). Neither location is currently considered to be an economic resource. Italy: One W occurrence, without a resource, is included into the ProMine database. Geologian tutkimuskeskus | Geologiska forskningscentralen | Geological Survey of Finland
Geological Survey of Finland                            Outlook for Tungsten                25/52

Norway: Norway has two tungsten occurrences according to the FODD database (2017). The Laksådal
Mo-W deposit contains scheelite and molybdenite, which are present in diopside skarn as veins, lenses
and dissemination. The Laksådal deposit was mined in the first half of 20th century. The Målvika
tungsten occurrence comprises scheelite mineralisation with some Au+As+Bi anomalies. No resource
information is available for the Norwegian deposits.

Portugal: At the end of 2016, the resources (including reserves) at Panasqueira were 10 Mt @ 0.23 %
WO3 plus inferred 5.16 Mt @ 0.22 % WO3 (Wheeler 2016). With all the tonnages and tungsten grades
calculated into one (no more NI-compliant), the resource is about 27,240 t W metal for Panasqueira.
At S. Pedro da Águias (Tabuaço), there is an indicated resource of 0.76 Mt @ 0.58 % WO3 and inferred
1.33 Mt @ 0.57 WO3 (= total 9,500 t W) (Martins 2012). The ProMine database (Cassard et al. 2013)
lists eight closed tungsten mines for Portugal; jointly these are reported to contain resources of nearly
40,000 t W. In addition, there are six W occurrences without resource data in the ProMine database.

Spain: At Los Santos, there is a Ni-compliant resource (inclusive reserves) 2.2 Mt @ 0.29 % WO3 plus
inferred resources of 1.88 Mt @ 0.25 % WO3 ; this, together with W-rich tailings (2.062 Mt @ 0.15 %
WO3 ) and minor stockpile made a total resource of 15,334 t W metal (2015 data,
http://www.almonty.com/projects/los_santos/). The Valtreixal project in NW Spain has a Ni-compliant
W resource of 2.828 Mt @ 0.25 % WO3 , 0.13 % Sn in the indicated and 15.419 Mt @ 0.08 % WO3, 0.12
% Sn (Wheeler 2015). With all the tungsten values calculated into one (no more NI-compliant), the W
resource is about 15,400 t for Valtreixal. Three additional W deposits with resource data are listed for
Spain in the ProMine database. Jointly these contain 21,800 t W in resources (Cassard et al. 2013). In
addition, there are 15 closed mines and other W occurrences without a resource in the ProMine
database.

Sweden: Sweden has abundant historical tungsten production with at least fourteen small deposits
having been in production in 19th and 20th century (FODD 2017). The largest of these deposits is
Yxsjöbergsfältet, from which slightly over 5 Mt of ore was produced during the 92 years’ time when
the mining took place. Noncompliant resource estimates are available for three W occurrences that
have not been exploited. Two of these give information on the tungsten content of the ore, with a
total of 2.1 Mt of tungsten-bearing ore at 0.2 % of W. This may be considered as a minimum figure for
tungsten resources in Sweden.

United Kingdom: Although historic tungsten production has taken place at a number of other mines in
south-west and north-west England, any remaining resources associated with these mines have not
been quantified. The Hemerdon Mine is the UK’s largest tungsten resource and is operated by
Tungsten West Ltd. According to the current (September 2019) mineral resource estimate, completed
to the JORC (2012) code, the deposit contains 225.9 million tonnes of ore grading 0.12 % WO 3 and 0.02
% Sn. A study to define updated JORC (2012) Reserves of the deposit is in progress at the time of
writing this report (Previously quoted by Wolf Minerals in March 2015 as 35.7Mt at 0.18% WO 3 and
0.03% Sn). The Strategic Minerals company have an inferred JORC resource for their Redmoor project
which includes a W contribution. Redmoor is a sheeted vein deposit. This deposit, of size 11.7Mt (JORC
2012 resource) at 0.56% WO 3, 0.16% Sn and 0.50% Cu (Strategic Minerals public RNS announcement
dated 14/02/2019).

Geologian tutkimuskeskus | Geologiska forskningscentralen | Geological Survey of Finland
Geological Survey of Finland                             Outlook for Tungsten                            26/52

Figure 18. Location of deposits with recorded tungsten production in the Cornubian ore field of south-west England. BGS
                 © NERC. OS topography © Crown Copyright. All rights reserved. BGS 100017897/2011.

Geologian tutkimuskeskus | Geologiska forskningscentralen | Geological Survey of Finland
Geological Survey of Finland Outlook for Tungsten 27/52
11 GLOBAL MINING PRODUCTION OF TUNGSTEN
Figure 19 shows the global production of tungsten in 2018. Figure 20 shows global production by
geographical region. Figure 21 and Table 11 show global production data by country between the years
2000 and 2018. Figure 22 shows non-Chinese global production.
Global Tungsten Production 2018 China
1.13% 1.11%
1.11% Vietnam
1.69% 1.15% 0.92%
Mongolia
1.74%
0.88%
Russia
1.85%
2.39% Korea, North
Bolivia
5.92%
Austria
Rwanda
United Kingdom
Other
Spain
Portugal
80.11%
Figure 19. Global tungsten production in 2018 (Source: USGS)
Global Tungsten Production by Region
100000
90000
80000
70000
60000
(tonnes)
50000 Other
South America
40000
North and Central America
30000 Africa
Australasia
20000
Europe
10000 Asia
0
2000
2001
2002
2003
2004
2005
2006
2007
2008
2009
2010
2011
2012
2013
2014
2015
2016
2017
2018
Figure 20. Global tungsten production by geographical region 2000 to 2018 (Source: USGS)
Geologian tutkimuskeskus | Geologiska forskningscentralen | Geological Survey of FinlandGeological Survey of Finland Outlook for Tungsten 28/52
Global Tungsten Production
100,000
Vietnam Canada
Australia Russia
90,000 Austria Mongolia
Congo (Kinshasa) Portugal
Korea, North United Kingdom
80,000
Spain Rwanda
Bolivia Other
70,000 China
60,000
(tonnes)
50,000
40,000
30,000
20,000
10,000
0
2000 2001 2002 2003 2004 2005 2006 2007 2008 2009 2010 2011 2012 2013 2014 2015 2016 2017 2018
Figure 21. Global production of tungsten 2000 to 2018 (Source: United States Geological Survey Mineral Statistics)
Geologian tutkimuskeskus | Geologiska forskningscentralen | Geological Survey of FinlandGeological Survey of Finland Outlook for Tungsten 29/52
Non-Chinese Tungsten Production
18000
Vietnam Canada
Australia Russia
Austria Mongolia
16000
Congo (Kinshasa) Portugal
Korea, North United Kingdom
Spain Rwanda
14000
Bolivia Other
12000
10000
(tonnes)
8000
6000
4000
2000
0
2000 2001 2002 2003 2004 2005 2006 2007 2008 2009 2010 2011 2012 2013 2014 2015 2016 2017 2018
Figure 22. Non-Chinese production of tungsten 2000 to 2018 (Source: United States Geological Survey Mineral Statistics)
Geologian tutkimuskeskus | Geologiska forskningscentralen | Geological Survey of FinlandCountry 2000 2001 2002 2003 2004 2005 2006 2007 2008 2009 2010 2011 2012 2013 2014 2015 2016 2017 2018
(tonne) (tonne) (tonne) (tonne) (tonne) (tonne) (tonne) (tonne) (tonne) (tonne) (tonne) (tonne) (tonne) (tonne) (tonne) (tonne) (tonne) (tonne) (tonne)
Austria 1,600 1,429 1,377 1,381 1,335 1,280 1,153 1,117 1,122 887 977 1,100 800 850 870 861 954 975 936
Portugal 743 698 693 715 746 816 780 846 982 823 799 819 763 692 671 474 549 724 715
Russia 3,500 5,100 5,300 3,600 2,800 2,800 2,800 3,400 3,000 2,300 2,800 3,500 3,000 3,600 2,800 2,600 3,100 2,090 1,500
Spain 150 200 229 497 800 835 650 564 750
United Kingdom 150 736 1,090 900
Geological Survey of Finland
Europe 5,843 7,227 7,370 5,696 4,881 4,896 4,733 5,363 5,254 4,210 4,805 5,916 4,563 5,142 5,141 4,770 5,253 4,353 3,901
Burundi 13 8 94 238 144 125 79 107 110
Congo (Kinshasa) 100 120 20 180 500 600 370 200 25 30 830
Rwanda 108 142 153 69 90 318 1,000 920 670 450 390 620 730 1,000 850 820 720 920
Uganda 17 16 1 52 36 75 86 50 9 55 10
Africa 108 159 269 203 170 628 1,813 1,750 1,215 738 577 770 1,560 1,000 850 820 720 920
Canada 2,295 3,636 384 1,983 2,305 2,277 1,964 420 1,967 2,190 2,130 2,340 1,680
United States NA NA NA NA NA NA NA NA NA NA NA NA NA NA NA NA NA NA NA
North and Central
2,295 3,636 384 1,983 2,305 2,277 1,964 420 1,967 2,190 2,130 2,340 1,680
America
Bolivia 393 532 399 441 403 531 868 1,107 1,148 1,023 1,204 1,124 1,270 1,250 1,250 1,460 1,110 994 1,370
Brazil 18 22 24 30 262 577 525 537 408 192 166 170
Peru 20 50 366 456 502 571 439
South America 411 554 423 491 665 1,108 1,443 2,010 2,012 1,717 1,941 1,733 1,270 1,250 1,250 1,460 1,110 994 1,370
Burma 74 85 83 96 107 168 197 183 136 87 163 130
China 37,000 42,100 55,100 36,200 59,900 51,200 45,000 41,000 50,000 51,000 59,000 61,800 64,000 68,000 71,000 73,000 72,000 67,000 65,000
Korea, North 500 500 600 600 280 650 930 230 270 100 110 110 1,410
Mongolia 52 63 35 40 77 78 182 245 142 39 20 13 753 1,940
Thailand 30 50 31 216 187 345 303 477 617 600 600 600
Asia 37,656 42,798 55,849 37,152 60,551 52,441 46,612 42,135 51,165 51,826 59,893 62,653 64,000 68,000 71,000 73,000 72,753 67,000 68,350
Outlook for Tungsten
Australia 15 7 7 12 7 15 7 28 33 16 15 320
Vietnam 1,660 4,000 5,600 6,500 6,600 4,800
Geologian tutkimuskeskus | Geologiska forskningscentralen | Geological Survey of Finland
Australasia 15 7 7 12 7 15 7 28 33 16 15 1,980 4,000 5,600 6,500 6,600 4,800
Other 674 752 796 1023 985 1955 2515 2275 2232 1641 1808 1597 3670.0 1290 2060 1910 880 1300 900
World Production 44,692 51,505 69,304 51,844 67,264 61,803 61,097 58,150 66,460 64,093 69,880 76,618 77,883 83,482 89,131 91,100 88,052 82,057 81,141
30/52
Table 13. Global production of tungsten 2000 to 2018 (Source: United States Geological Survey Mineral Statistics)You can also read