Riding the Recovery FX Annual Outlook 2021 - Maybank Kim Eng
←
→
Page content transcription
If your browser does not render page correctly, please read the page content below
December 9, 2020

                                   FX Annual Outlook 2021
                                   Riding the Recovery
Macro | FX Research and Strategy

                                   Asia – The Big Long Trade                                                    Analysts

                                   Into 2021, we look for healing and a return to growth normalcy. A smooth     Saktiandi Supaat
                                   vaccine rollout soon can potentially be a game changer. Global economy       (65) 6320 1379
                                   could be closer to a more sustainable recovery trajectory amid               saktiandi@maybank.com.sg
                                   unprecedented fiscal and monetary support. Procyclical-proxy FX              Christopher Wong
                                   including AUD, NZD in DM space and KRW in AXJ space can benefit while        (65) 6320 1347
                                   CNH, SGD, with Covid-19 under control, can also ride on the cyclical         wongkl@maybank.com.sg
                                   growth recovery. The signing of the RCEP agreement, further expansion
                                   of trade pacts to include more countries and potential dial-back in trade    Fiona Lim
                                   tensions between US-China, following Biden’s Presidency (vs. Trump), is      (65) 6320 1374
                                   expected to set up a more constructive environment for global trade to       fionalim@maybank.com.sg
                                   extend its recovery. Trade linked currencies such as TWD, KRW, CNH and       Tan Yanxi
                                   SGD could see sustained gains, especially if trade recovery feeds through    (65) 6320 1378
                                   to domestic demand. In current low rate environment with growth              tanyx@maybank.com.sg
                                   recovering from low bases and benign near-term inflation expectations,
                                   hunt for yields can persist. Asia is home to some of the highest carry in
                                   the world. INR, IDR, MYR, CNH are some preferred proxy-FX for carry
Global

                                   play.

                                   Reflation and Commodity Re-rating
                                   Central banks and governments had pulled out all stops (and debts) to
                                   nurse the weakened economy back towards healthier levels of growth
                                   and inflation in 2020. The unprecedented levels of monetary and fiscal
                                   stimulus could also mean a significant reflationary process in 2021
                                   (especially higher risk in 2H 2021) that could typically be positive for
                                   AUDJPY. Within the commodity space, industrial metal prices have been
                                   lifted by China’s headstart in recovery and we continue to see chance for
                                   further gains that could broaden into other commodity prices as demand
                                   revives in other parts of the world, underpinning AUD, NZD, CAD, MYR.

                                   Dollar Downsides Still, But More Modest
                                   We maintain our bias for USD downside play on: (i) unwinding of dollar
                                   semi-haven demand alongside vaccine progress, (ii) Fed’s commitment to
                                   dovish bias (with its AIT framework and greater tolerance on inflation
                                   overshoots), (iii) diversification out of USD in global payments and on a
                                   longer-term basis, FX reserves reallocation, and (iv) a slower recovery in
                                   US fiscal deficits compared to DM peers or Asian economies. Nonetheless,
                                   pace of dollar decline could be more modest in the next few quarters vs.
                                   the recent >10% slump since Mar 2020.

                                   Risks of Tech Sputtering, Uneven Vaccine Schedules
                                   Long positions in gold, tech stocks can be viewed as a proxy for the
                                   extent of Covid-19 concerns. Upward price momentum of these assets
                                   persisted through 2Q - 3Q, and tech-linked FX such as KRW, TWD, SGD
                                   have gained alongside. Nonetheless, current concern is if these trends
                                   will reverse, with rotation into cyclicals, if developments in vaccine
                                   distribution and efficacy surprise positively. This could pose some
                                   challenges to tech-linked FX, even as we largely view bouts of softness
                                   as opportunities to buy-on-dips. Elsewhere we also note that uneven
                                   vaccine rollout schedules, adoption rates can affect pace of economy
                                   reopening and sentiment.

                                   THIS REPORT HAS BEEN PREPARED BY   MAYBANK
                                   SEE PAGE 32 FOR IMPORTANT DISCLOSURES AND ANALYST CERTIFICATIONS
FX Outlook 2021: Riding the Recovery
1. Asia – The Big Long Trade
1.1 Procyclical-Proxy FX to Take the Lead
2020 was a year of global health catastrophes and the year marks the worst
economic recession since the Great Depression in 1930s. Into 2021, we look for
healing and a return to growth normalcy.
Vaccine progress has been encouraging. Efficacy came in at ~95% for Pfizer-
BioNTech’s BNT162b2 as well as Moderna’s mRNA-1273 in phase 3 trial while a
handful of vaccines including AstraZeneca-Oxford, China’s Sinopharm and Sinovac
have reported material progress. Multiple sources of successful and safe vaccines
using a mix of different technology can help to ease concerns over production and
distribution. A smooth vaccine rollout soon can potentially be a game changer as
the consequential containment of covid-19 pandemic suggests that travel
restrictions, social distancing measures can be lifted. The global economy could be
closer to a more sustainable growth recovery amid unprecedented fiscal and
monetary support.
Procyclical-proxy FX including AUD, NZD in DM space and KRW in AXJ space can
benefit while JPY and USD take the back seat. In addition, CNH, SGD with covid-
19 way under control can also ride on the cyclical growth recovery.
Fig 1: AUD, NZD, KRW, CNH and SGD to Proxy for Cyclical Rebound
FX Sensitivity (beta) to Equity sentiment
Note: OLS regression of FX/USD (y-variable) vs growth proxied by global manufacturing PMI
and vs. sentiment proxied by MSCI World index
Source: Bloomberg, Maybank FX Research & Strategy
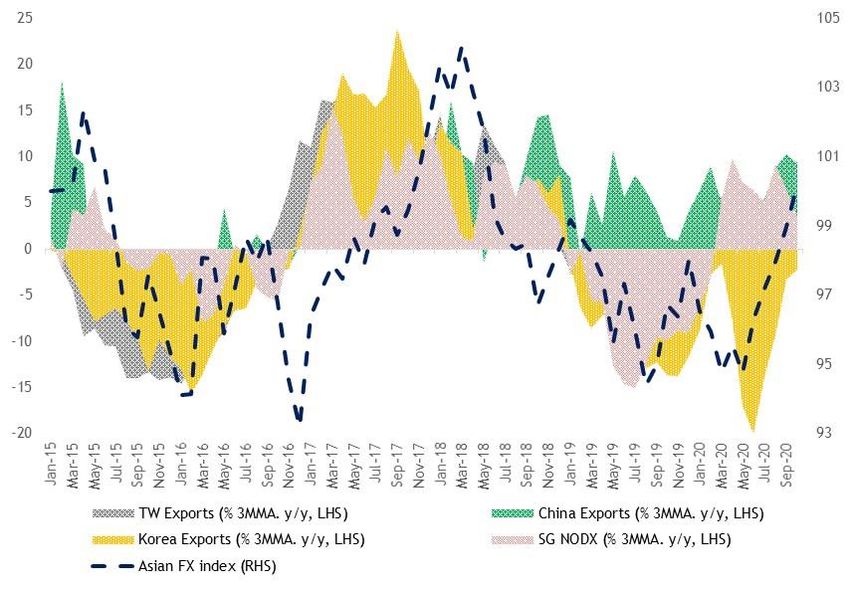
1.2 Trade Pacts, Exports Recovery Supportive of Trade-FX
The signing of RCEP agreement, further expansion of trade pacts to include more
countries and potential dial-back in trade tension between US-China, following
Biden’s Presidency (vs. Trump) is expected to set up a more constructive
environment for global trade to extend its recovery in 2021.
Exports, new orders data from the region further showed signs that a recovery is
already underway. Trade linked currencies such as TWD, KRW, CNH and SGD
should see sustained gains, especially if trade recovery feeds through to
domestic demand.
Apart from the tariff eliminations that could spur trade volume growth, key to the
RCEP agreement would be the common rules of origin for businesses to ship their
products to anywhere within the 15 participating countries under the RCEP
agreements. This would greatly enhance the access to markets for exporters across
the regions and draw the 14 other countries which already have substantial trade
volumes with China, closer to the country.
December 9, 2020 2
FX Outlook 2021: Riding the Recovery

      Fig 2: Trade-Linked FX Benefiting from Exports Recovery in Asia

      Note: Asia custom trade linked FX made up of CNH, KRW, TWD and SGD, equally-
      weighted and indexed to 100 on end-Jan 2015
      Source: Bloomberg, Maybank FX Research & Strategy

      China’s implementation of its “dual circulation” strategy, alongside potential post-
      Covid return of investment and portfolio flows to Asia over the medium term,
      could continue to bode well for yuan (potential for USDCNH to head below 6.20)
      and other AxJ currencies, especially when regional linkages are strengthened by
      RCEP and other trade pacts could gain traction (i.e. China-Cambodia FTA likely to
      kick in next year, UK-Japan FTA could be building blocks towards joining CPTPP
      while US may consider rejoining CPTPP).

      Fig 3: Most RCEP Nations Have Strong Trade Ties with China

      Note: Trade numbers in the chart are based on 2019 annual trade values. Each bar
      can be read as China or US’ share of the respective country’s total trade with the
      world
      Source: Bloomberg, Maybank FX Research & Strategy

1.3 Carry Can thrive
      Low rates for longer globally is likely to persist for 2021 as inflation remains
      subdued in the near term and policymakers are likely to allow for easy policies to
      run longer to secure a firmer recovery. In particular Fed’s adoption of average
      inflation targeting (AIT) regime and tolerance for overshoots in inflation and
      employment, alongside other DM central banks’ pledge to not withdraw monetary
      stimulus prematurely should help to anchor low rates for longer.

      In this low rate environment with growth recovering from low bases and inflation
      expectations still benign in the near term, a hunt for yield can persist. Asia is home
      to some of the highest carry in the world. On nominal terms, India and Indonesia
      bonds are highest, with 10y at around 6%. In real terms (adjusted for inflation),
      Indonesia and Malaysia bonds are attractive at between 3 and 4%. In ratings-
      adjusted basis, China and Malaysia bonds have the second and third highest yields
December 9, 2020                                                                               3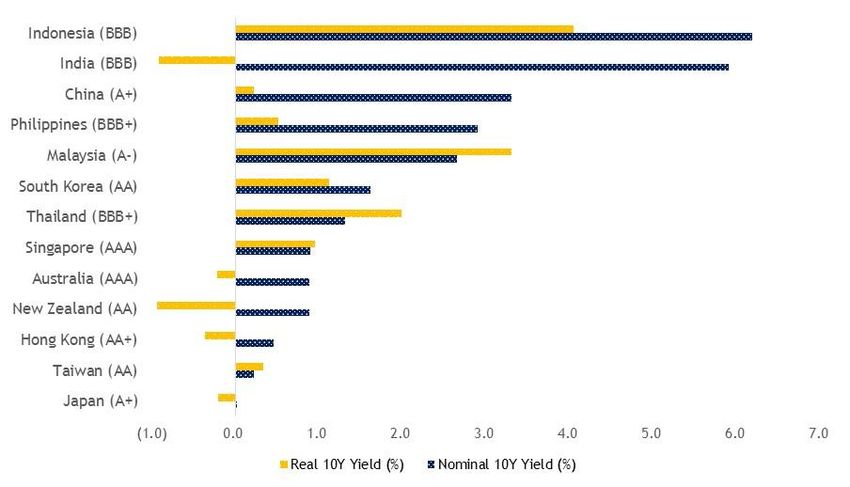
FX Outlook 2021: Riding the Recovery

      in FTSE WGBI. In particular, INR, IDR, MYR, CNH are some of our preferred proxy-
      FX for carry play.

      Fig 4: Carry Trade FX Benefits from Environment of Low Rates

      Note: (1) Real yield calculated from nominal 10y yield – 12-month rolling average
      inflation of respective countries; (2) All data as of 24 Nov 2020; (3) Sovereign rating
      in parenthesis based on S&P ratings.

      In addition, returning foreign flows is another catalyst supporting high yielding
      Asian-proxy FX. IIF data showed that that non-resident capital flows to EM are the
      strongest since immediately after the Great Recession. Our study also shows that
      rotation back to regional assets can gain traction over the next few years, in turn
      supporting underlying FX momentum.

      Fig 5: Return of Foreign Flows to Support Underlying FX Momentum

      Source: Maybank FX Research & Strategy Estimates, Bloomberg

December 9, 2020                                                                                4
FX Outlook 2021: Riding the Recovery

2. Reflation and Commodity Re-rating
2.1 Reflation Comes with Optimism and Recovery
      Synchronous Monetary and Fiscal Stimulus
      Central banks and governments had pulled out all stops (and debts) to nurse their
      weakened economies back towards healthier levels of growth and inflation in 2020.
      Unlike past crises episodes such as the global financial crises, the level of
      monetary and fiscal stimulus that are provided simultaneously across the world this
      time have been unprecedented and that could also mean a significant reflationary
      process in 2021.
      Stop-Go Process For Now
      The combination of a Biden win, news of vaccine development progress, approvals
      and possible distributions in early Dec swung markets’ focus back onto the
      reflation trade even as the pandemic show no signs of peaking in the Americas,
      Europe and parts of Asia at this point. Admittedly, vaccine-driven cheer could be
      vulnerable to correction. Potential delays in the manufacture and distribution
      alongside current grim pandemic realities could cause sporadic pauses in the
      rotation into risk assets. In addition, a reflationary process that is too strong could
      also be seen as premature. However, these factors are likely to be viewed as speed
      bumps for now rather than significant hurdles for risk assets to rally further.
      Investors expect eventual strong pent-up demand, buttressed by a multitude of
      stimulus and a future clarified by more widely-available COVID-19 vaccines.

      Fig 6: Yield Curve Has Started to Steepen, Possibly Guiding the AUDJPY Higher

               290                                                                           105
                                                                   US 2y10y Yield
                                                                   Differential (LHS, bps)   100
               240
                                                                   AUDJPY (RHS)              95
               190                                                                           90

               140                                                                           85
                                                                                             80
                90
                                                                                             75
                40
                                                                                             70
               -10                                                                           65
                 Nov-09   Apr-11   Sep-12   Feb-14   Jul-15   Dec-16   May-18     Oct-19

       Source: Bloomberg, Maybank FX Research & Strategy

      A Democrat Controlled Congress Underpriced
      While vaccine availability might be priced a tad too well in advanced (and risk
      some correction), investors could be underestimating a possibility that Congress
      could still be controlled by the Democrats. At this point, it is widely expected for
      the Republicans to retain its control over the Senate with a current 50-48 lead.
      However, the two Georgia runoff elections on 5 Jan 2021 await and a Georgia win
      could cede control to the Democrats which would increase the likelihood of a
      bigger stimulus package, giving growth a better chance in 2020. Reflation is
      typically reflected in the yield curve that steepens as the outlook of the economy
      improves. The UST 2y10y (fig. 6) has been rising since its inversion in Mar this year
      and has broadly moved in line with the AUDJPY for much of past two decades. We
      see a potential for AUDJPY to rise substantially into 2021 with the far end lifted
      by growth and inflation expectations, underpinned by the next stimulus package
      and Fed’s pledge to keep interest rate anchored at near 0% until 2023. On the
      converse, a reflationary US along with recovery in the rest of the world add to the
      broad decline of the USD.
December 9, 2020                                                                                   5
FX Outlook 2021: Riding the Recovery

2.2 The Rise in Commodities To Sustain Steam into 2021
      With China’s initial phase of recovery spurred by construction and manufacturing,
      it is not difficult to see why industrial metal prices have been on the rise. Copper
      stockpiles have plunged 50% from its peak in Mar and remains on the downmove.
      With the copper prices already up around 60% from its trough in Mar 2020 (LME 3m
      rolling forward), the strong rally begs the question of whether this can continue.
      China’s strive for dual circulation that includes building a more independent supply
      chain for its technology sector along with the revival of demand in the rest of the
      world may mean that demand for industrial metals should continue to rise. This is
      especially so as governments seek to boost spending on infrastructure (Australia’s
      A$7.5bn spending on road and rail, US’ Biden’s U$2trn infrastructure promise, etc.)

      Broad demand revival in a reflationary environment will keep broad commodity
      prices (other raw materials, oil) on the rise. That should be positive for
      commodity-linked currencies including AUD, NZD, CAD, MYR.

      Fig 7: China’s Recovery Drove Metal Prices Higher and                    Fig 8: Demand Revival Should also Spur Upsides for
      Further Gains Could Continue As Demand in Other Parts                    Broader Commodities, Likely to Lift Relevant Currencies
      of the World Revive                                                      (AUD, NZD, CAD, MYR)

                  Metal Prices May Continue to Rise as Demand
                      Revives in Other Parts of the World                        400                                              120
        %
       10                                                                120                                                      115
                                                                         115     350
        5                                                                                                                         110
                                                                         110
        0                                                                105                                                      105
                                                                         100     300
       -5                                                                95                                                       100
                                                                         90
      -10                                                                        250                                              95
                                                                         85
      -15                                                                80                                                       90
                                                                         75      200
      -20                                                                70                                                       85
         Jan-18    Jun-18   Nov-18   Apr-19   Sep-19   Feb-20   Jul-20
                                                                                                                                  80
                                                                                 150
                             World IP yoy
                                                                                                                                  75
                             China IP yoy
                                                                                 100     CRY Index                                 70
                                                                                                       Commodity Currency Index (rhs)
                             Base Metal Index (100= Jan 2015, rhs)                 Jan-10 Jan-12 Jan-14 Jan-16 Jan-18 Jan-20

      Note: Base metal index consists of an average of copper,                 Note: Commodity Currency Index is the average of the
      aluminum and iron ore prices indexed to 31 Jan 2015.                     AUD, NZD, CAD and MYR performance against the USD with
      Source: Bloomberg, NBS, LME                                              1 Jan 2010 = 100. CRY Index is the Refinitiv /
                                                                               CoreCommodity Excess Return index, an arithmetic
                                                                               average of commodity future prices with monthly
                                                                               rebalancing.
                                                                               Source: Refinitiv, Bloomberg
      Along with reflation, there is always a concern over potential inflationary pressures
      that could eventually could sap growth. At this point, there remains too much
      spare capacity for inflation expectations to become unanchored. Notwithstanding
      some potential volatility in rates, Fed’s AIT mandate should serve to dampen
      unexpected volatility in rates that could destabilize financial markets and crimp on
      growth pre-maturely.

December 9, 2020                                                                                                                         6
FX Outlook 2021: Riding the Recovery

3. Dollar Downsides Still, But More Modest
3.1 Confluence of Factors to Weigh on USD Structurally
      We maintain our bias for USD downside play on: (i) unwinding of dollar semi-
      haven demand alongside vaccine progress, (ii) Fed’s commitment to dovish bias
      (with its AIT framework and greater tolerance on inflation overshoots), (iii)
      diversification out of USD in global payments and on a longer-term basis, FX
      reserves reallocation, and (iv) a slower recovery in US fiscal deficits compared to
      DM peers or Asian economies.

      Arguments for potential dollar debasement are not new, and we might not see a
      near-term continuation of the sharp fall-off in dollar strength post-March, but a
      combination of the aforementioned factors could still work to weigh on the dollar
      structurally in 2021.

3.2 A Weakening Case for USD Haven Demand
      Barring new sets of risk factors, the case for holding USD on haven demand may
      gradually grow weaker over time.

      Fig 9: 3M Risk Reversal for USD Shows Tentative Signs of Turning Lower Again

       105.0                                                Dollar Index (DXY)                                         3M Risk Reversal (RHS)
                                                                                                                                                                                      Biden 2.0
                                                                                                                                                                                      victory, 1.5
       100.0                                                                                                                                                                          Vaccine
                                                                                                                                                                                      news 1.0

        95.0                                                                                                                                                                                        0.5
                                                                                                                                                                                                    0.0
                             Risk Reversals
        90.0                                                                                                                                                                                        -0.5
                             below 0 implies
                             growing bearish
                                                                                                                                                                            pre-US                  -1.0
        85.0                 bets on USD
                                                                                                                                                                            elections
                                                                                                                                                                                                    -1.5
        80.0                                                                                                                                                                                        -2.0
               Jan-16

                                          Oct-16
                                                   Jan-17

                                                                               Oct-17
                                                                                        Jan-18

                                                                                                                   Oct-18
                                                                                                                            Jan-19

                                                                                                                                                       Oct-19
                                                                                                                                                                Jan-20

                                                                                                                                                                                           Oct-20
                        Apr-16

                                                             Apr-17

                                                                                                 Apr-18

                                                                                                                                     Apr-19

                                                                                                                                                                         Apr-20
                                 Jul-16

                                                                      Jul-17

                                                                                                          Jul-18

                                                                                                                                              Jul-19

                                                                                                                                                                                  Jul-20

      Source: Bloomberg, Maybank FX Research & Strategy

      3M risk reversals for USD was on a downtrend from April, but haven demand for
      USD pre-US elections likely led it modestly higher then. Subsequently though, a
      Biden victory had curbed its upward momentum, and there are tentative signs that
      bearish USD bets could be gradually gaining traction again (risk reversals in modest
      negative territory).

      Themes 1 and 2 have discussed positive developments on the vaccine and US
      elections front that could reduce dollar haven demand. On vaccine progress, we
      note too that in the US alone, between Pfizer and Moderna, potentially twenty
      million people could be vaccinated by the end-of December (roughly on par with
      the number of US healthcare workers). On policy uncertainty, we also observe that
      uncertainty levels (as measured by the Baker, Bloom and Davis Economic Policy
      Uncertainty index) tends to revert to “normalcy” within half a year of the
      presidential transition.

3.3 Negative Real US Rates Could Be Here for Some Time
      Meanwhile, Fed’s dovish commitment via Average Inflation Targeting (AIT) could
      result in negative real interest rates over the next few years, with near-term rates
      kept near zero while inflation potentially recovers to 2% and beyond.

December 9, 2020                                                                                                                                                                                           7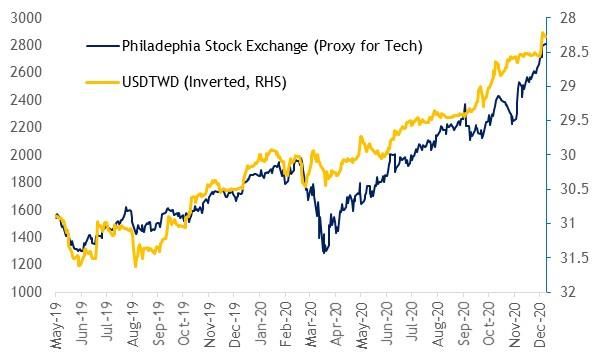
FX Outlook 2021: Riding the Recovery
Fig 10: Risks to US 3M Real Rates from Recovering Demand and PCE Inflation
Dollar Index (DXY) US 3M Real Rates (RHS)
105.0 Ad-hoc Shocks: Oil Slump, 1.5
Brexit, US Rate Hike Concerns
100.0 1.0
95.0 0.5
90.0 0.0
%
85.0 -0.5
80.0 Based on -1.0
75.0 Consensus -1.5
Forecasts
70.0 -2.0
Jan-10
Jan-11
Jan-12
Jan-13
Jan-14
Jan-15
Jan-16
Jan-17
Jan-18
Jan-19
Jan-20
Jan-21
Jul-10
Jul-11
Jul-12
Jul-13
Jul-14
Jul-15
Jul-16
Jul-17
Jul-18
Jul-19
Jul-20
Note: US 3M real rates are computed as 3M Libor less PCE Core inflation.
Source: Bloomberg, Maybank FX Research & Strategy
Barring a period of ad-hoc shocks to dollar sentiments emanating from oil slump,
Brexit and US rate hike concerns over 2014-17, we note that directional biases in
DXY and US 3M real rates have been relatively aligned. Consensus forecasts expect
risks to real rates to remain biased to the downside into 2021, and this could weigh
on the USD accordingly.
3.4 Payment Trends Add to Dollar Debasement Concerns
According to Swift data, EUR’s usage in international payments has surpassed that
of the USD as of Oct, with USD’s usage peaking around Mar 2020. The plunge since
then suggests accelerated diversification away from the use of USD after the
occurrence of the USD liquidity crunch in Mar, adding to the USD debasement
narrative.
Meanwhile, IMF COFER data also shows that the rise in the share of USD in
countries’ holdings of FX reserves has largely tapered since peaking in 3Q 2018,
even as we have yet to see any significant decline. While any significant shifts in
reserve FX shares would likely take multiple decades, the bias here is still for
reduced dollar holdings over time, especially with the emergence of initiatives
such as the digital yuan. On net though, impact of this factor on dollar strength
could be relatively mild for now.
Fig 11: Global Payments in EUR Surpassed that in Fig 12: USD Share of Global FX Reserves Flatlined Since
USD 2018
50 USD EUR USD EUR RMB JPY
70.0
Share of Payments Via SWIFT
% of Total FX Reserves
45 60.0
50.0
40
40.0
(%)
35 30.0
20.0
30
10.0
25 0.0
2015
2015
2015
2015
2016
2016
2016
2016
2017
2017
2017
2017
2018
2018
2018
2018
2019
2019
2019
2019
2020
2020
May-16
May-17
May-18
May-19
May-20
Jan-16
Sep-16
Jan-17
Sep-17
Jan-18
Sep-18
Jan-19
Sep-19
Jan-20
Sep-20
Q1
Q2
Q3
Q4
Q1
Q2
Q3
Q4
Q1
Q2
Q3
Q4
Q1
Q2
Q3
Q4
Q1
Q2
Q3
Q4
Q1
Q2
Source: Bloomberg, Maybank FX Research & Strategy Source: IMF COFER
December 9, 2020 8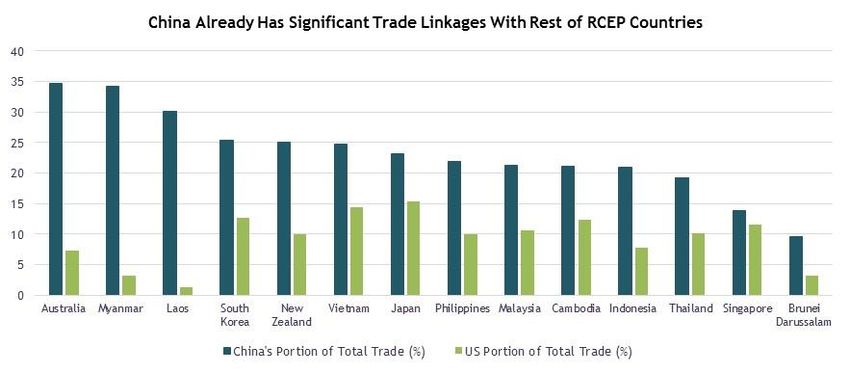
FX Outlook 2021: Riding the Recovery

3.5 Fiscal Deficit an Achilles’ Heel for Dollar?
      The Covid-19 pandemic has forced a shift in macro balances for each economy,
      notably a deterioration in fiscal accounts as funds are diverted to combat Covid-
      induced drags. While near-term stimulus is almost always welcome by markets,
      concerns over ballooning debt tend to creep in over time, and the eventual
      tapering of support can be painful as well.

      Fig 13: Consensus Forecasts See US Fiscal Deficits Faring Worst Over 2020-22

                                                     2020F   2021F     2022F
                  5.0
                                       Majors                                        Asians
                  0.0
      % of GDP

                  -5.0

                 -10.0

                 -15.0

                 -20.0
                           US   UK   CA    JN   EU     AU    NZ   SG   PH      CN   MY   ID   TH   KR   TW

      Source: Bloomberg (ECFC), Maybank FX Research & Strategy

      Historically, broad periods of wide US fiscal deficits have tended to weigh on the
      dollar. We note that comparatively:

      (i)                The US’ cumulative fiscal deficits for 2020-22 is expected to be the largest
                         among countries under consideration, and could potentially be even wider
                         in the off-chance that Democrats gain a Senate majority (i.e., unified
                         Congress raises likelihood of larger stimulus package and elevated public
                         spending efforts).

      (ii)               We note that the Covid-led bouts of deterioration in fiscal balance
                         trajectories tend to be more serious for DMs vs. Asia, either due to more
                         manageable contagion trends in Asia, or instances of fiscal regulations
                         limiting debt increases.

      The latter in particular, could point to more sustained dollar softness against the
      Asian currencies in the quarters ahead.

December 9, 2020                                                                                             9
FX Outlook 2021: Riding the Recovery

4. Risks: Tech Sputtering, Uneven Vaccination
   Schedules
4.1 Covid-proxy Longs Look Toppish
      In a way, long positions in assets such as gold, tech equities, supermarket stocks
      etc., can be viewed as a proxy for the extent of Covid-19 concerns. Upward
      momentum in the prices of these assets have largely persisted through 2Q and 3Q,
      and tech-linked FX has gained alongside. Nonetheless, the current concern is if
      these trends will reverse as vaccine rollouts proceed apace and the world heads
      towards some semblance of normalcy again in 2021. Chart below shows that gains
      in a basket of gold & Nasdaq has already begun plateauing since end-3Q.

      Fig 14: Index of Gold & Nasdaq Slowed in Gains in 4Q

                                    180
                                    170
         Index (1 Jan 2019 = 100)

                                    160
                                    150
                                    140
                                    130
                                    120
                                    110
                                    100
                                     90
                                     80
                                          Jan-19

                                                   Mar-19
                                                            Apr-19
                                                            May-19

                                                                               Aug-19

                                                                                        Oct-19

                                                                                                 Dec-19

                                                                                                                            Apr-20
                                                                                                          Jan-20

                                                                                                                   Mar-20

                                                                                                                            May-20

                                                                                                                                               Aug-20

                                                                                                                                                        Oct-20
                                                   Feb-19

                                                                                                                   Feb-20
                                                                     Jun-19

                                                                                        Sep-19

                                                                                                                                     Jun-20

                                                                                                                                                        Sep-20
                                                                      Jul-19

                                                                                                                                      Jul-20
                                                                                                 Nov-19

                                                                                                                                                                 Nov-20

      Note: Index is equally weighted in gold and Nasdaq. Index value of 100 in 1 Jan 2019.
      Source: Bloomberg, Maybank FX Research & Strategy

      For big tech in particular, another risk to watch could be the chances of increased
      scrutiny in tech regulation. In US, recent senate hearings largely assess that self-
      regulation is necessary but not sufficient, and that the industry may need to
      review its business models. Efforts to rein in big tech could gain further traction if
      Democrats win the Georgia runoffs (less likely but not impossible) and we see a
      unified Congress. In China, we also saw regulators showing signs of increased
      watchfulness on its Fintech leaders (e.g., pulling the plug on Ant Financial’s IPO).

4.2 Sporadic Tech-linked FX Softness Could Provide Buy-on-Dips
    Opportunities
      More broadly, if developments in vaccine distribution and efficacy surprise
      positively (i.e., quicker than expected, with accompanying implications for return
      of tourism, activity flows etc.), some of the aforementioned Covid-proxy longs
      could be unwound, and rotated more quickly into cyclicals. This could pose some
      challenges to tech-linked FX such as KRW, TWD and SGD, given the significant
      positive correlation between global tech trends and these currencies.

December 9, 2020                                                                                                                                                          10
FX Outlook 2021: Riding the Recovery
Fig 15: Positive Correlation between Tech-Linked Proxy FX and SOX Intact
Philadelphia Stock Exchange Semiconductor Index (% yoy LHS)
Tech-linked Currency Index of TWD, KRW and SGD (RHS)
60 101
50
99
40
97
30
20 95
10
93
0
91
-10
-20 89
Sep-14 Apr-15 Nov-15 Jun-16 Jan-17 Aug-17 Mar-18 Oct-18 May-19
Note: Tech-linked currency index consists of equally-weighted SGD, KRW, TWD vs. the USD
(Index value of 100 in Jan 2011); SOX is Philadelphia Stock Exchange Semiconductor Index for
short.
Source: Bloomberg, Maybank FX Research & Strategy
We note though that these development—even if it comes to pass—needs to be
considered against a backdrop of broader regional sentiments. It is likely that the
factors discussed in detail in Theme 1 can mitigate the impact of any tech-linked
pullbacks to a significant extent. In this case, bouts of softness in KRW, TWD, SGD
on negative global tech headlines may provide opportunities for buying-on-dips.
4.3 Uneven Vaccine Roll Out Schedule Can Affect Sentiment
Differentiated crisis management (i.e. COVID-19 pandemic control, vaccine
logistical, diplomacy issues, vaccine efficacy, eventual vaccine rollout timeline and
vaccine adoption rates) can affect the pace of economy reopening and growth
normalisation. For instance US and UK are likely to be amongst the first few
countries to have access to vaccines (as soon as end-2020) but a slower take-up
rate of vaccination could delay pandemic control. For instance according to a
Gallup poll (ended 1 Nov), 58% of Americans said they would get vaccinated. In
contrast, countries with greater adoption and access to vaccines such as China
could see a faster reopening of its economy. This could suggest another positive
factor underpinning CNH’s resilience.
Within ASEAN, Indonesian authorities have been relatively more active in
communicating near-term vaccination plans (starting Dec 2020, ramping up in
2021), possibly contributing to IDR positivity in Nov. The risk for Indonesia,
therefore, could be whether implementation efforts keep up with expectations. In
contrast, countries such as Philippines are looking for bulk vaccinations to occur in
late 2021 or early 2022, which could be more neutral for sentiments.
December 9, 2020 11FX Outlook 2021: Riding the Recovery
This page is left intentionally blank.
December 9, 2020 12FX Outlook 2021: Riding the Recovery USD: Global Economic Recovery, On-hold Fed, Weaker Dollar Forecast 4Q 2020 1Q 2021 2Q 2021 3Q 2021 4Q2021 USD Index 92.03 90.55 89.95 88.69 87.73 Motivation: We expect USD softness to continue in light of a combination of several factors including (1) USD as a counter-cyclical FX thematic; (2) Fed likely to keep policy rate lower for longer under Average Inflation (AIT) Targeting framework; (3) eroding US rate advantage (both nominal and real); (4) sharp deterioration in US twin deficits (tend to accelerate USD softness); (5) a Biden administration is associated with less demand for safe haven USD. USD likely to weaken against currencies that may benefit from rising commodity prices, higher investor risk appetite and rising trade and industry related activity. Dollar is a counter cyclical FX. USD tends to weaken in episodes of global growth rebounds (outside US) and strengthens on episodes of broad market risk-off. In the last 12 years or so, there have been 2 notable episodes of USD weakness – (1) when global growth rebounded from a low point in 2009 post-GFC, DXY fell by about 16% and (2) when synchronous economic recovery, led by exports upswing in 2017, DXY fell more than 10% - both over 2 –3 quarters time frame depending on the durability and sustainability of the growth rebound. In the current episode, DXY has already fallen by around 6% from end Jun and >10% decline since Mar peak. The trade-weighted US Dollar will likely weaken by a further 5% over the next 12 months. We continue to see a strong case for structural Dollar weakness over the coming years given a likely slowdown in bond portfolio inflows, an improving global economic outlook and attempts by countries to diversify their reserve assets away from the Dollar in the face of heavy Treasury issuance and political concerns and considerations over the medium term. Potential Re-allocation out of USD assets. At the same time, greater business confidence and improved investor confidence could see funds flow back to where it came from possibly in drips, as China for example may be able to absorb more inflows as its financial markets internationalise while Europe’s focus towards fiscal policies could convince investors to relook again at an under-appreciated Europe and UK in 2021. While it is true that USD remains the top funding currency according to a BIS report, EUR’s usage has surpassed that of the USD as of Oct/Nov with USD’s usage peaking around Mar 2020. The plunge since then suggests accelerated diversification away from the use of USD after the occurrence of the USD liquidity crunch in Mar, adding to the debasement of the USD USD International Role and Financial Channel Dynamics. When the global economy improves, demand for US Treasuries tends to fall, and if (unhedged) investors allocate into assets denominated in other currencies the value of the Dollar may also decline. In addition, as hedge rebalancing and FX reserve recycling develops, it may also contribute to the negative correlation between the Dollar and global growth. The opposite causation could also be working its way supporting the dollar depreciation theme as it improves the balance sheets of overseas borrowers with USD-denominated debt. USD is a Counter Cyclical Currency: As Growth USD To be Pressured Lower by Biden’s $2trn Momentum Picks Up, USD Weakens Infrastructure Plans Source: Bloomberg, CBO, Maybank FX Research & Strategy December 9, 2020 13
FX Outlook 2021: Riding the Recovery

EUR: Upside Potential
 Forecast           4Q 2020        1Q 2021          2Q 2021   3Q 2021     4Q2021
 EUR/USD              1.19            1.21           1.22      1.24         1.25

Motivation: We maintain our bias for EUR to trend higher on (1) expectations for
more sustained global growth recovery as covid-19 pandemic retreats amid the roll-
out of vaccination; (2) the birth of an ‘New Generation EU’ fund as a joint
commitment to building EU resilience and planned debt issuance that should
potentially encourage foreign inflows; (3) resumption of structural and cyclical USD
softness, which EUR could stand to benefit from. We look for EUR to trade 1.17 –
1.26 range, with bias to buy dips. Near term, covid-19 spread in Europe remains a
risk that could come and go until vaccine is rolled out or herd immunity is achieved.
Fears of lockdown will dampen economic activity and undermine EUR but judging
from recent experience, each round of lockdown is getting shorter and policymakers
have more visibility today on what works and what needs to be done to keep
infection contained. Another risk we watch is ECB’s outright caution against excessive
EUR strength as policymakers had previously voiced concerns over currency strength
and its impact on negative prices, export competitiveness. Jawboning of EUR
strength could temporarily keep EUR gains restraint.

ECB had earlier projected >8% contraction for Euro-area economy for 2020 but is
projecting 5% rebound for 2021. Vaccine supply is building up for EU (possibly near
2bn doses for a population of 450mio) as policymakers inked deals with key
pharmaceutical firms including Moderna, Pfizer-BioNTech, J&J, etc. A smooth vaccine
rollout soon can be a game changer as the containment of covid-19 pandemic
suggests that travel restrictions, social distancing measures can be lifted. The global
economy including the EU could be closer to a more sustainable growth recovery
amid unprecedented fiscal and monetary support. EUR can stand to benefit given
Europe’s exposure and linkages to global and China trade and growth rebound.

The simultaneous and coordinated use of monetary and fiscal stimuli is a strong
display of EU solidarity and demonstrates a commitment to building EU resilience.
ECB’s tools of PEPP and TLTROs have helped to reduce financial fragmentation
(compress spreads) and stabilize market sentiment. The ‘Next Gen EU Fund’ is a
positive. EU’s main structural weakness all these years is that it is a monetary union
without a fiscal union. While the ‘Next Generation EU’ fund is far from a complete
fiscal union; it nevertheless creates a temporary fiscal union (in less formalized
terms), with some levels of central debt issuance, fiscal risk-sharing and grants to
weaker nations in the fight against COVID-19 pandemic. In light of this, a planned
issuance of up to EUR800bn of joint-debt (which is attractive on a valuation basis as
the last tranche saw offering of higher yield than German Bunds with similar credit
rating of AAA, higher than French OATS) next year should continue to see sustained
inflows of capital, fueling demand for EUR.

EUR’s role as an international currency could potentially accelerate as USD negatives
piled on. IMF COFER data shows that USD share of USD global central bank reserves
has been falling gradually from above 66% (in 1Q 2015) to 61.3% (3Q 2020) while
EUR’s share of cross border payments and SWIFT payment continue to rise, with the
latter outpacing USD for the first time since 2013.
EUR, EU to Benefit from China’s Recovery Momentum              Rise in EUR’s International Role a Driver of EUR?

                                                                                          EUR’s share of Swift Payments
                                                                                          Surpassed USD for first time since 2013
Source: Bloomberg, Maybank FX Research & Strategy

December 9, 2020                                                                                                                    14
FX Outlook 2021: Riding the Recovery GBP: Moving Out of Brexit Shadows Forecast 4Q 2020 1Q 2021 2Q 2021 3Q 2021 4Q2021 GBP/USD 1.3500 1.3600 1.3600 1.3800 1.4000 Motivation: Our base case remains for a broad EU-UK FTA agreement, with finer details to be ironed out into 2021. It is in both EU and UK’s interests to come to an agreement than to go for a lose-lose outcome. Disruption to trade can affect German, French and Spanish businesses (about 50% of UK imports come from EU) while UK’s services export to EU is about 7% of GDP. An agreement would be broadly supportive of GBP’s outlook, a key factor underpinning our GBP upward trending baseline projection. Elsewhere ongoing trade deals between UK and other nations (such as Japan, Canada), UK to start inoculation (7 Dec), continuing policy accommodation and rapid fiscal support (cad help to cushion against downturn) and softer USD environment should continue to bode well for GBP. UK’s ongoing trade negotiations with other nations are medium term positives. UK has struck its first major post-brexit FTA with Japan, that aims to boost trade by about GBP15bn. 99% of exports to Japan will be tariff-free, with focus on food and drink, finance and tech sectors. Manufacturing parts coming from Japan will benefit from reduced tariffs while British pork, beef and salmon will also enjoy reduced tariffs. UK and Canada have also reached an interim post-Brexit trade agreement (though there is no text on the deal for now). Mutual recognition agreements (MRA) have also been signed with Australia, NZ and US. MRA is one in which countries recognize the results of one another’s conformity assessment and would replicate the effect of existing EU arrangements, to take effect from 1 Jan 2021. UK has also begun negotiation with a further 18 counties which have existing EU trade deals including Mexico, Singapore, Vietnam. A ‘continuity’ trade agreement with S. Korea has also been signed to allow businesses to keep trading “freely” after brexit. However, there are still risks to watch in the near term. Covid spread and rising death tolls in UK remain a concern as restrictions could step up, posing the risk of double-dip recession. However, inoculation in UK has already commenced (first in the world) and if they can prove to contain covid spread, the economy could see a re- acceleration in economic activities. BoE Chief Economist Haldane said that Britons have amassed GBP100bn of excess savings. Pent-up consumer demand when covid goes away could boost growth. The biggest binary risk is the fluid development of EU-UK trade negotiations especially when the 3 key obstacles to a trade deal remain unresolved: (1) access to British waters (better known as fishing rights), (2) fair competition rules for businesses including rules of domestic subsidies (often referred to as state aid) and (3) mechanism for resolving future trade disputes. Hence we cannot ignore the alternative scenario of no-agreement (i.e. hard break-up) come 31 Dec 2020. This would mean that WTO rules stepping in for EU-UK trade (i.e. trade tariffs) from 1 Jan 2021 - a negative surprise and the GBP will be subjected to an asymmetrically larger downside (a binary risk to our forecasts) in the near term to adjust for earlier optimism. In this alternative scenario we do not rule out GBP revisiting 1.25 levels. Ability to Contain Covid Spread Could See Restrictions Ease Household Savings Surged to High of 29.1%; Economy Further; A Plus for Economic Activity and GBP Reopening Can Release GBP100bn Pent-up Demand Source: Bloomberg, Maybank FX Research & Strategy December 9, 2020 15
FX Outlook 2021: Riding the Recovery

AUD: Appreciation Can Continue But China Spat a Risk
 Forecast           4Q 2020        1Q 2021        2Q 2021         3Q 2021        4Q2021
 AUD/USD              0.73           0.75            0.77           0.78          0.78

Motivation: 2021 is a year of recovery for Australia as well as the rest of the world.
Procyclical AUD should remain on the rise, underpinned by optimism that comes with
the vaccine development, distribution as well as growing demand for Australia’s
resources as the world rebuilds itself from the carnage of the pandemic. China’s
green ambitions and dual circulation strategies could be still beneficial for Australia
in the near-term, barring severe escalation in the current spat.

Procyclical AUD Can Still Rise. AUD had appreciated around 20% from its trough in
Mar 2020. Such is the procyclical behaviour of the AUD in an environment that had to
some extent been priced ahead of its recovery. With governments and central
bankers around the world acknowledging that growth still requires fiscal support and
accommodative monetary settings, AUD could continue to be lifted alongside most
risky assets that are buoyed in such a conducive environment.

China’s Dual Circulation and Green Ambition. One of China’s main strategies in its
“dual circulation” plan is to strengthen its supply chain and to reduce its reliance on
the US. In addition, China has aggressive plans for green and low carbon
development. These projections suggest that in the next few years, China still needs
more of Australia’s raw materials and energy (iron ore, LNG, coal) for the
infrastructure plans required, notwithstanding the tensions between the two
countries that are still simmering. For 2019, around 60% of its iron ore imports, 40%
of its coal imports and 48% of China’s LNG imports originate from Australia.

Australia’s Covid Under Control. With the timeline for vaccine availability and
distribution still an uncertainty, Australia remains one of the few nations that have
an added advantage of having the pandemic under control. Consumer and investor
confidence may recover ahead of other DM nations with the easing of internal
borders to possibly see domestic tourism gaining traction into 2021. RBA remains
firmly against a negative interest rate policy and should growth outpace rest of DM,
so would risk be tilted upside for the AUD.

Risks to Our View: A key risk to our view is an escalation in Aussie-Sino tensions.
Throughout 2020, officials from China have urged Australia “to reflect on its own
deeds” and have started erecting trade barriers such as a ban on beef imports from 4
Australians abattoirs, tariffs on Australian wine, unofficial restrictions on coal (that
halve its imports in recent months). A list of 14 grievances have been released from
the Chinese embassy. It remains unknown whether China would broaden its actions to
other key exports such iron ore or LNG as well as services imports such as tourism,
education when international borders start to ease.

China May Still Need More of Australia’s Key Exports                    AU-10Y Yield Spread Rises as Reflation Takes Hold,
                                                                        Lifting the AUDUSD
                                                                               30
                                                                               25                                              0.74
                                                                               20                                              0.72
                                                                               15                                              0.7
                                                                               10
                                                                                5                                              0.68
                                                                                0                                              0.66
                                                                               -5                                              0.64
                                                                              -10
                                                                              -15                                              0.62
                                                                              -20                                              0.6
                                                                                Apr-20    Jun-20    Aug-20    Oct-20     Dec-20
                                                                                             AU-US 10y       AUDUSD (rhs)

Source: General Admin of Customs, Bloomberg, Maybank FX Research & Strategy

December 9, 2020                                                                                                                      16
FX Outlook 2021: Riding the Recovery NZD: Taking Flight Forecast 4Q 2020 1Q 2021 2Q 2021 3Q 2021 4Q2021 NZD/USD 0.6800 0.7100 0.7200 0.7300 0.7300 Motivation: We expect NZD to trade higher, riding on the global recovery wave. Covid vaccine development globally has been positive and NZ has entered into a purchase program with Pfizer-BioNTech to supply 1.5mio vaccine by 1Q 2021. Smooth vaccine rollout soon can potentially be a game changer as the consequential containment of covid-19 pandemic suggests that travel restrictions, social distancing measures can be lifted (a boost for NZ’s tourism). The global economy could be closer to a more sustainable growth recovery amid unprecedented fiscal and monetary support. Procyclical FX proxy such as NZD can ride the global recovery wave (NZD is a proxy play for global growth). In particular China’s growth, demand rebound should also benefit NZ (30% of NZ total exports goes to China). Typically, NZD is also highly correlated with CNH (correl at 0.68 while beta is 1). In addition, NZ being part of the RCEP and CPTPP trade pacts can also benefit (positive NZD) if trade recovery feeds through to domestic demand. On the domestic side of the equation, forward looking indicators including activity, survey and confidence indicators continued to point to a recovery (positive NZD); RBNZ further distancing itself away from NIRP (results in unwinding of NZD shorts) and la Nina weather projection could also further support NZ’s economic activity and NZD. NZ rates are likely to have found a floor following RBNZ and Finance Ministry’s recent comments. And this also suggest that NZD downside risks owing to expectations of NIRP have largely dissipated. Finance Minister Robertson proposed to RBNZ to add house prices to RBNZ remit. This is interpreted as potentially one less option for RBNZ to sound overly dovish to prevent property market from overheating. Since RBNZ MPC (11 Nov), officials dialing back their tone on negative rates. Markets (via OIS) were initially pricing in 27bps cut for OCR to slight negative at Apr 2021 MPC and for the remainder of 2021 but this has now been unwound. Markets are no longer pricing in negative rates for 2021. For Oct-Nov 2021, markets are looking for 16.5bps rate, implying a near-10bps cut from current OCR. We see room for rates to adjust further (possibly to par at current OCR of 25bps) should recent NZ economic data, including consumer confidence, activity outlook, card spending, PMI – services and manufacturing continue to see sustained upward momentum. This would be supportive of NZD. Reopening of economies including NZ, relaxation of border restrictions eventually amid vaccination should be another positive factor supporting growth recovery, NZD strength. The US National Oceanic and Atmospheric Administration (NOAA) has issued a La Nina advisory confirming that La Nina conditions are expected to continue through the coming months and into 1Q 2021. For NZ, La Nina can lead to fewer westerly winds and more north-easterly winds. This can cause more rain in Northeast part of the North Island and it can impact agricultural crop production. The Southern Oscillation index (SOI) has also risen (La Nina phase corresponds with monthly averages above 1.0). And typically NZD correlates strongly with SOI. NZD a Proxy Play for Global Growth Rebound La Nina and NZD Correlate Source: Bloomberg, NOAA, Maybank FX Research & Strategy December 9, 2020 17
FX Outlook 2021: Riding the Recovery

CAD: Reflationary Environment To Buoy
 Forecast             4Q 2020           1Q 2021            2Q 2021     3Q 2021       4Q2021

 USDCAD                  1.2800         1.2600             1.2400      1.2300        1.2250

Motivation: While Canada remains a country that still struggles with COVID-19 like
most of the regions in the northern hemisphere, strong and timely fiscal stimulus along
with the monetary policy coordination of BoC would cushion the detrimental effects of
the lockdowns. The stimulus potentially provides a significant larger boost to domestic
demand compared to countries with less generous government when the vaccine
becomes available. We see a possibility that BoC could be one of the first few to raise
rates (again) and a monetary policy divergence could spur CAD bulls even more. A
reflationary global environment is likely to lift commodity prices, including oil, positive
for the CAD as well.

Strong and Timely Fiscal Stimulus. The Trudeau administration has been expanding its
economic response programs in reaction to the second wave of the virus, targeting
business and individual supports via rent and wage subsidies, investment in healthcare
amongst others. Its budget deficit is one of the highest in the world – projected 17.5%
of GDP (C$381bn). While this could risk pressuring its credit ratings, such targeted and
generous support had so far calmed sentiment and could spur a strong recovery
especially when the vaccine distribution starts. A potential outperformance in growth
and rise in wages, could raise rates and increase the allure of the CAD even more.

Reflationary Pressure Should Build At Home and Abroad. As Canada endures a harsh
winter with elevated Covid cases, the key uncertainty for Canada as well as in the rest
of the world is vaccine availability. Health Canada had said that regulators will decide
on the approvals of vaccines around the same time as the US (10 Dec). PM Trudeau
promised that more than 50% of Canadians will be vaccinated by Sep “if all goes well”.
Household savings rate for 3Q declined from record high of 27.5% to 14.6%, compared
to 2% in 4Q 2019. This is also reflected in the United States where personal savings rate
had been rather elevated vs. long-term average. Taken together, CAD is poised to get
multiple reflationary boosts at home and as a global phenomenal (oil-positive) in 2021
once there is greater clarity from vaccine availability.

Risks to Our View. A key risk for CAD could be an unexpected rise in inflation that
could force BoC to tighten before growth has stabilized. Another risk to CAD’s strength
is that an election is triggered in an environment of worsening Covid, slower
distribution of vaccine (relative to expectations and other countries) along with higher
fiscal spending that balloons Canada’s federal debt even further. Political uncertainty
could then dampen consumer’s and investors’ confidence.

Global Growth Recovery Should Continue to Spur Crude                   Significant Reflationary Process At Home, Backed by Strong
Oil Prices and CAD                                                     Fiscal and Monetary Stimulus to Lift the CAD

45                                                              1.25      0.6                                                        1.25
                   WCS            USDCAD (rhs, inverted)
                                                                                              CA2y10y       USDCAD (rhs, inverted)
40                                                                        0.5
35                                                              1.30                                                                 1.3
                                                                          0.4
30
                                                                          0.3                                                        1.35
                                                                1.35
25
                                                                          0.2
20                                                                                                                                   1.4
                                                                1.40      0.1
15
                                                                           0
10                                                                                                                                   1.45
                                                                1.45
                                                                         -0.1
 5
                                                                         -0.2                                                        1.5
 0                                                              1.50
                                                                            Jan-20   Mar-20     May-20   Jul-20   Sep-20    Nov-20
 Jan-20   Mar-20    May-20     Jul-20     Sep-20     Nov-20

Note: WCS refers to Western Canadian Select Crude Oil.
Source: Bloomberg, Maybank FX Research & Strategy

December 9, 2020                                                                                                                            18
FX Outlook 2021: Riding the Recovery
JPY: Intermittent Demand in 2021
Forecast 4Q 2020 1Q 2021 2Q 2021 3Q 2021 4Q 2021
USDJPY 103 102 102 101 101
Motivation: Despite a potential improvement in risk sentiments heading into 2021, on
vaccine distribution and macro growth recovery, a significant part of the positivity
has likely been priced in by markets. Any pullback in JPY haven demand from here on
out could be gradual, especially as the new year could bring with it renewed
attention on post-Covid scars in labour markets, new bouts of geopolitical tensions,
post-Brexit transition costs for UK/EU etc. Meanwhile, domestic growth in Japan
could be modest in 2021, despite low base effects (2020), as private consumption
and investment momentum could remain soft. Drags on tourism could take time to
fade, with vaccine distribution schedules worldwide likely to be uneven. Sporadic
cautiousness in Japanese equities could be accompanied by periods of upsides in the
JPY. On net, JPY could appreciate modestly against the dollar, but see more
mixed performances against other FX.
Global risk factors are unlikely to fade away in 2021. Debt overhangs and
unemployment drags could also take longer to normalize in countries with stretched
fiscal purse-strings. In Europe, even if a Brexit deal manages to be inked soon, the
actual transition to a post-Brexit world could come with significant adjustment costs
for cross-border flows. While a Biden presidency (vs. Trump) is widely expected to be
less stressful for US-China relations, US may also move to reforge alliances among
traditional allies to counter China’s dominance. There could be periods of
intermittent demand for haven assets such as JPY still.
Domestic growth concerns could be supportive of the JPY. Recent global PMI data
largely show a continued, albeit patchy, uptick in activity, but output in most
economies are not expected to recover to pre-Covid levels till late 2021. In Japan in
particular, the recovery could be more drawn out versus most peers. Consensus
forecasts look for modest growth of 2.5% and 1.8% in 2021 and 2022 respectively,
from a -5.3% contraction this year. Private investment especially could remain soft in
the near-term as corporate margins remain under pressure. While the negative
correlation between Nikkei and JPY had faded in 2020 alongside a pandemic-led
distortion in risk conditions, it could re-emerge in 2021. We could see incremental
demand for JPY during episodes of increased cautiousness in Japanese equities.
An upside risk to USDJPY could be rising long-end UST yields, on concerns of larger
US fiscal deficits and recovering inflation, even as JGB yields largely remain low. Any
widening in UST and JGB yield differentials could be supportive of the USDJPY pair,
though we expect that the magnitude of any widening could be capped (i.e., 10Y UST
yields unlikely to top 2% in 2021), and the concomitant boost to USDJPY, if any, could
be contained.
Any Pullback in Japanese Equities Could Be Upside Risk to USDJPY Could Come from Rising
Accompanied by JPY Demand UST Yields
28,000 Nikkei-JPY relationship 116 3.5 118
could revert to pre- 116
26,000 Covid norms in 2021 114 3.0
114
112
24,000 2.5 112
110
22,000 110
2.0
108 108
20,000 1.5 106
106
18,000 104 104
1.0
102
16,000 102
0.5 100
Jul-18
Jul-19
Jul-20
Jan-18
Apr-18
Jan-19
Apr-19
Jan-20
Apr-20
Oct-18
Oct-19
Oct-20
Jul-17
Jul-18
Jul-19
Jul-20
Jan-17
Apr-17
Jan-18
Apr-18
Jan-19
Apr-19
Jan-20
Apr-20
Oct-17
Oct-18
Oct-19
Oct-20
Nikkei 225 (LHS) USDJPY (RHS) 10Y UST-JGB Yield Diff. (LHS) USDJPY (RHS)
Source: Bloomberg, Maybank FX Research & Strategy
December 9, 2020 19FX Outlook 2021: Riding the Recovery
RMB: Gains To Continue But Not Without Risks of Moderation
Forecast 4Q 2020 1Q 2021 2Q 2021 3Q 2021 4Q2021
USD/CNY 6.55 6.45 6.35 6.25 6.25
Motivation: The RMB could continue to be an anchor for regional currencies. Its
decisive and effective COVID-19 management has given China a lead in recovery
amongst the G20 economies. Growth and carry remain the main driver for the RMB
along with the recent inclusion of the Chinese Government Bonds into FTSE Russell’s
World Government Bond Index. In a low rate global environment, the hunt for yield
could amplify the demand for higher yielding RMB assets and thus the RMB and we do
not rule out a test below the 6.20 (a key level that was seen in pre-trade war era,
2018). That said, China has shifted its focus back towards deleveraging and that
would be a key risk to RMB as other currencies less encumbered with such priorities
could start to shine.
Carry advantage Remains. PBoC is a rare central bank which commenced
normalization in 2020. This is a contrast to Fed’s fresh AIT framework that aims to
get actual inflation above the 2% target for a while before monetary policy would
react to tame price pressures.10y yield has risen almost 1ppt from its May low of
2.48% to 3.3%. Rising domestic yields in China and monetary divergence could mean a
solid carry advantage along with resilient fundamentals that is hard to beat in the EM
and DM world. That could give CNY a fair amount of support in the first six months.
Green Plans and Technological Self-Sufficiency. As most international borders
remain closed, demand for domestic tourism also be boosted all the more in the
near-term, spurring household consumption and its current account surplus.
Ambitious green plans for peak carbon emission before 2030 and Xi’s goal of creating
a more self-sufficient supply chain that would not be held hostage by the US could
mean more infrastructure rebuilding. Growth prospect could thus remain driven by
significant domestic demand while global growth recovery along with benign trade
conditions (less confrontational US under Biden administration) could keep the trade
balance in surplus.
US-China Tensions To Linger. A less confrontational US does not mean a friendlier
US. Biden administration is likely to galvanise the support from allies and strategic
partners to counter China’s influence. Already, a bipartisan panel had urged Congress
to add to a list of demands on China (equal access for companies/media, stricter
monitoring of Beijing’s activities at the UN and preventive actions to safeguard US
interest in technology and finance). Chinese MNCs could remain targeted and that is
still a risk to watch for the RMB.
Deleveraging as a priority. What looks to provide a carry advantage for RMB could
also be growth crimping eventually (along with equities). In a global recovery
environment, prospect of a slower-than-expected growth for China could also divert
flows towards other EMs that could be catching up in terms of growth and rates.
Strong Carry Advantage Can Buffer in Case of Rate WGBI Inclusion Has Spurred Debt-Related Inflows
Volatility
260 6.5 35000 6.2
240 6.6 30000 6.3
220 25000 6.4
6.7 20000
200 6.5
6.8 15000
180 6.6
6.9 10000
160 6.7
5000
140 7 6.8
0
120 7.1 -5000 6.9
100 7.2 -10000 7
Jan-20 Mar-20 May-20 Jul-20 Sep-20 Nov-20 -15000 Net Foreign Debt Flows (USD mn) 7.1
USDCNY (rhs, inverted)
-20000 7.2
CH-US 10y Differential (bps) USDCNY (rhs, inverted) Jan-15 Dec-15 Nov-16 Oct-17 Sep-18 Aug-19 Jul-20
Source: Bloomberg, CEIC, Maybank FX Research & Strategy Estimates
December 9, 2020 20FX Outlook 2021: Riding the Recovery
KRW: Outperformance on Growth and Trade Recovery
Forecast 4Q 2020 1Q 2021 2Q 2021 3Q 2021 4Q2021
USD/KRW 1100 1060 1060 1050 1050
Motivation: We are constructive on KRW’s outlook and expect KRW to be well-
positioned to play catch-up to regional peers, into early part of 2021 before its
pace of gains stabilize for the year. YTD (as of 30 Nov) KRW has appreciated by 4.5%
vs USD. In contrast its peers, CNH and TWD have already appreciated between 4.8%
and 5.8%. KRW’s high beta characteristic, and growth proxy play allows for gains to
catch-up, especially in the case of a sustainable pick-up in global growth and trade,
secured by the arrival of vaccine. The chip sector could lead recovery in capex and
exports. KRW being a proxy for tech, chips should see additional support. In
addition, the signing of RCEP, potential expansion of trade pacts to include more
countries and potential dial-back in trade tensions between US and China could set
up a more constructive environment for global trade to extend its recovery in 2021.
Korea is already emerging from a trade recession and export orders are picking up. At
home, Korea has shown strong resolve and capability to contain covid-19 spread,
despite on-and-off resurgences (which was quickly contained). Eventual reopening of
its borders and economy, easing of restrictions as vaccination is likely to reach 60% of
its population by 2Q 2021 will be another boost to growth (via consumer spending,
tourism, etc.). Given the stars of growth, trade rebound, sustained foreign inflows to
Korean equities and bonds, receding US-China tension, soft USD background and
resilient RMB all aligned, we do not rule out KRW outperforming its peers in early
part of 2021. A move lower outside of our quarterly forecasts towards 1040-50 levels
should not be ruled out before finding some support thereafter.
The latest RCEP agreement means Korea has FTAs with the world’s top 5 economies
including US, China, Germany, India and Japan (the latter being first-ever trade
agreement). Under the trade deal, Korea has lowered trade barriers for its mainstay
exports such as automobiles like cars and trucks (currently subjected to 30% to over
40% tariff), automobile parts (currently subjected to 10% - 30% tariff) and steel
(currently subjected to 20% tariff) in ASEAN. Korea’s steel exports to RCEP members
was nearly $13bn in 2019, accounting for nearly 48% of global exports while imports
stood at $12 bn (about 82% of total). Under RCEP, Korea and Japan will remove tariff
on 83% export items from each country. The RCEP will also lower export tariffs of
Korean beverages, including soju (currently subjected to 30% tariff) and remove tariff
on dried seaweed to ASEAN. Lower trade barriers, potential for increase in trade
with the region are all positives for Korea growth and exports and KRW.
KRW is a High beta FX and this can be a double-edged sword. Amongst most AXJ
FX, KRW, with a beta of 0.5 to changes in S&P500 is very sensitive to external
development. As much as KRW can appreciate sharply riding on external factors, such
as global growth rebound, the reverse is also true. KRW can react more than other FX
to the negatives such as geopolitical tensions (Korea peninsula or escalation in US-
China tensions); global health pandemic (growth scare); tightening of financial
conditions, etc. There will be periods that KRW may overshoot or undershoot our
forecasts but these should correct when conditions stabilize.
Chips Exports Can Lead Recovery in Capex, Growth, High Beta KRW – Brace for Swings
KRW
KRW Highly Sensitive to Equity
market sentiment
(OLS 6m daily change log values
y=KRW; x=S&P500 sentiment
proxy)
Source: OECD, Bloomberg, Maybank FX Research & Strategy
December 9, 2020 21You can also read