Pedestrian safety & neighbourhood equity - Wellesley Institute
←
→
Page content transcription
If your browser does not render page correctly, please read the page content below
WELLESLEY INSTITUTE EVIDENCE BRIEF

Pedestrian safety & neighbourhood equity
Alissa Klingbaum | September 2021

Introduction
Toronto’s streets are a valuable public space for building community connections, accessing
resources, and staying active.[1] But these benefits can only be realized if streets are safe spaces
for all users. Safety is particularly important for pedestrians.a Not only are they the group most
vulnerable to traffic collisions, but they are also the most universal – everyone travels as a
pedestrian at some point along their transportation routes.[1]

Concerns about pedestrian safety in Toronto have made headlines in recent years, with news
outlets reporting one pedestrian death after another.[2] Since the implementation of Toronto’s
current road safety strategy in 2017, over 700 pedestrians have been killed or seriously injured
in traffic collisions.[3, 4] Even with thousands of new road safety measures to target collision
hotspots and priority individuals (e.g., seniors, school children), pedestrian collision numbers
have remained stagnant, and fatalities continue to rise.[4, 5] Both municipal representatives and
the public recognize that Toronto’s approach to pedestrian safety is not working.[5]

To address the shortcomings of its road safety strategy, the City of Toronto has identified the
need for a social justice and equity lens.[5] Its planning documents have recognized that
pedestrian collisions are not evenly distributed across the city and that area-level socio-
demographics are connected to collision risk.[5] The City has moved this finding into practice,
announcing that a prioritization tool and equity lens definition have been under development
by Transportation Services, which will add equity as an evaluation criterion in future capital
investments in road safety.[6] Despite this progress, there is still a gap in understanding and
synthesizing how neighbourhood factors play a role in pedestrian collisions and how
interventions can act on the underlying causes of existing disparities.

This paper reviews the literature on the relationship between neighbourhood socio-
demographics and pedestrian collisions and explores approaches to equity-informed road
safety planning from other North American jurisdictions. Drawing on findings from both
research and practice, this work can support the ongoing reframing of pedestrian safety
planning to incorporate neighbourhood equity considerations. As Toronto’s road safety strategy
begins to take tangible action on existing inequities, the City can use this evidence base to make
its streets safer for all pedestrians, regardless of where they live.

a
    This paper adopts an inclusive definition of pedestrians to represent people on foot and/or using assistive devices.

                                                                                                                      1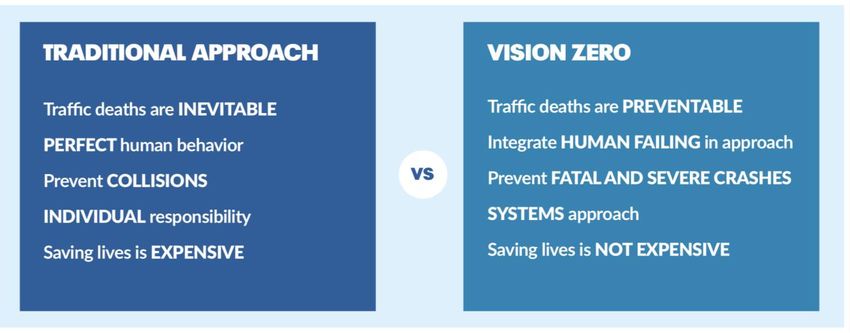
Toronto’s Vision Zero safety approach

Traffic collisions have been a longstanding challenge in Toronto. Between 2006 and 2019, over
6,100 people were killed or seriously injuredb (KSI) in a traffic collision in the city.[4, 7]
Pedestrians make up 45 per cent of KSI road users in Toronto – the largest share among all
transportation modes – and a pedestrian is killed or seriously injured every three days on
Toronto’s streets.[8]

In response to rising rates of fatal collisions, the City of Toronto began developing its first road
safety plan in 2015.[9] This plan was modeled after Vision Zero, an approach to road safety
developed in Sweden that aims to eliminate traffic fatalities and injuries and promote safe,
healthy, and equitable mobility.[10] This approach has been implemented in many cities across
the globe and represents a movement toward injury prevention that is systems-focused, data-
driven, and exclusively targets fatal and severe collisions (Figure 1).[9] Vision Zero’s key design
principles target the separation of vulnerable road users (e.g., pedestrians, cyclists) and the
reduction of speeds where separation is not possible.[11] This includes features like median
barriers, speed humps, and pedestrian islands. Importantly, Vision Zero initiatives place the safe
travel of people ahead of the efficient movement of vehicles.[12]

Figure 1. Vision Zero approach to road safety

Source: Vision Zero Network (2018).

Vision Zero road safety plans are built around a few core elements.[12] They begin with a
commitment from senior leaders across sectors (e.g., transportation, police, public health) to
achieve zero traffic fatalities and severe injuries, along with meaningful community engagement
to understand firsthand experiences with road safety. Plans are then developed collaboratively,
comprised of measurable road safety strategies with clearly defined timelines, responsibilities,
and funding sources. Interventions within the plan aim to reduce speeds, prioritize high-risk

b
 KSI collisions are when a person has sustained a major or fatal injury. [74] Major injuries are those which require
hospitalization, even if only for observation at the time of the collision. Fatal injuries are those in which death
occurs in less than 366 days as a result of the collision and is unrelated to natural causes.

                                                                                                                       2
roadways, and establish a transportation network that connects all road users. Ongoing
decision-making is based on routine data analysis that underscores transparency, proactive
mitigation of risk, and equitable outcomes.
Toronto’s Vision Zero Road Safety Plan was implemented in 2017 and focuses on six emphasis
areas – pedestrians, school children, older adults, cyclists, motorcyclists, and aggressive driving
and distraction.[8] The plan sets out targeted interventions for each of these areas, through
engineering and street design, new technologies, education, and enforcement. In 2019, Toronto
renewed its approach to road safety through adoption of Vision Zero 2.0 (2020-2024), which
extended and expanded initiatives under the same philosophy.[5]
Over the past four years, the City has implemented evidence-based actions to promote road
safety through the Vision Zero Plan.[8] Speed limits have been reduced on 250 kilometers of
streets, red light cameras have been installed at several intersections, and safety zones with
measures like increased crossing times and enhanced pavement markings have been added in
areas with high volumes of seniors and children.[4] Some interventions have been targeted
directly at pedestrians, such as sidewalk repairs, priority traffic signals, and crosswalks between
intersections.[4] There have also been Vision Zero initiatives to promote active and safe routes
to school, daylight savings time awareness, and reflective gear for seniors.[4] The City’s road
safety efforts to date have been informed by traffic collision data and stakeholder
consultation.[8]
Yet since the start of Vision Zero, more than 700 pedestrians have been killed or seriously
injured on Toronto’s streets. If there have been data-driven, city-wide improvements to road
safety, why does Toronto continue to have so many pedestrian collisions? Understanding the
connections between neighbourhood socio-demographics and collision risk can help to answer
this question.
Neighbourhood socio-demographics and pedestrian collisions
Pedestrian collisions are driven by a mix of environmental, behavioural, and social risk
factors.[13] A review of the international literature demonstrates a consistent relationship
between pedestrian collisions and indicators of neighbourhood socioeconomic status. Studies
from urban centres in Canada and comparable jurisdictions (Australia, United Kingdom, United
States) published between January 2004 and July 2020 have identified neighbourhood
characteristics associated with higher rates of pedestrian injury and fatality in an area (Table 1).
Table 1. Review of literature on neighbourhood socio-demographics and pedestrian collisions
Neighbourhood Relationship with pedestrian
Study setting (year)
sociodemographic collisions
Car ownership Higher rates of pedestrian collisions Chicago (2010)
[14-18] were associated with lower levels of Florida (2012, 2014, 2015, 2019)
car ownership.
3Home values Higher rates of pedestrian collisions Halifax (2015)
[19, 20] were associated with lower home Seattle (2015)
values.
Household income Higher rates of pedestrian collisions Chicago (2011)
[16, 17, 21-23] were associated with lower Florida (2012, 2019)
household income. Montreal (2012)
New Jersey (2013)
Population, residential, Higher rates of pedestrian collisions Orange County (2010)
and employment density were associated with higher levels of Denver (2009)
[15, 17, 18, 22, 24-29] all types of density. Florida (2012, 2014, 2015)
Los Angeles (2007)
Melbourne (2017)
New Jersey (2013)
Seattle (2011)
Vancouver (2017)
Poverty Higher rates of pedestrian collisions California (2004)
[14, 16, 24, 25, 30-35] were associated with higher levels of Chicago (2010)
poverty. Devon County (2004)
Florida (2015, 2019)
Los Angeles (2007)
Orange County (2010, 2012)
San Francisco (2009)
Toronto (2019)
Racial/ethnic minority Higher rates of pedestrian collisions Chicago (2010, 2011)
concentration were associated with higher levels of Florida (2015)
[14, 15, 20, 23, 25] racial or ethnic minorities. Los Angeles (2007)
Seattle (2015)
Socioeconomic status Higher rates of pedestrian collisions London (2010, 2016)
[36-40] were associated with lower New South Wales (2007)
socioeconomic status. Ottawa (2010)
Wisconsin (2019)
International studies have also considered associations between pedestrian collisions and area-
level education, unemployment, and age distribution.[15, 16, 18, 19, 23, 24, 32, 34, 41, 42] However,
relationships with these neighbourhood socio-demographics are less conclusive as there are
fewer studies available and they do not show a consistent trend across papers.
Relationships can exist between neighbourhood factors to produce collision risk. For example, a
Florida study investigating only collisions within low-income areas found that pedestrian
collisions were still more frequent where there were larger populations, higher levels of visible
minorities, and more zero-car ownership households.[16] In a London study, the relationship
between area deprivation and child pedestrian injury rate varied by ethnic group.[39] Authors
4found that for white and Asian pedestrians, the rate of injury and level of deprivation had a
positive linear relationship, while Black pedestrians had a constant rate of injury across
deprivation levels.
The literature in Toronto is more limited. In one study, higher residential instability and a higher
concentration of recent immigrants and visible minorities were identified as significant
independent predictors of pedestrian collisions.[43] However, measures of material deprivation
and workforce participation were not significantly associated with pedestrian collisions. Another
local study found that the rate of child pedestrian collisions was more than five times higher in
low-income census tracts than high-income census tracts.[33]
Mechanism of action: Built environment inequities
Studies that have explored neighbourhood socio-demographics and pedestrian collisions have
suggested processes that may be driving their relationship. One mechanism frequently reported
in the literature is that neighbourhood socio-demographics influence the quality and safety of
the built environment, which in turn influences the risk of pedestrian collisions.[21, 39, 43-46] In this
pathway, marginalized neighbourhoods (e.g., those with significant low-income and/or
racialized populations) end up with less supportive infrastructure, where community features
like streets, housing, parks, or amenities are not designed in ways that promote pedestrian
safety.[37, 44, 45, 47, 48] Built environment inequities are often due to historical patterns of
disinvestment and systemic exclusion from urban planning processes.[37, 44, 45, 47] This mechanism
is acknowledged in the Vision Zero philosophy and aligns with its systems approach to road
safety.[12] Other drivers proposed in the literature mainly focus on differential road user
behaviour, which is outside the scope of this paper.
The built environment pathway of disparities is supported by a body of literature – including
from Toronto – that identifies marginalized areas as having poorer walkability, more high-
volume and high-speed roadways, denser housing, and fewer traffic calming measures.[6, 19, 21, 33,
37, 39, 45, 47, 49-51]
A study of pedestrian collisions in Montreal illustrates this pathway well.
Researchers found that the significant negative relationship between pedestrian collisions and
area-level income was largely mediated by roadway features like traffic volume, intersection
geometry, and active transportation volumes.[21] Yet the built environment could not
completely explain the original relationship; even when taking roadway features into account, it
remained significant.
Built environment inequities can arise from municipal practices. A recent review of Canadian
cities’ pedestrian safety plans found that engagement strategies and policies targeting the
needs of low-income and minority groups were largely absent.[52] For instance, Toronto and
many other jurisdictions offer request-based processes to implement traffic calming measures
(e.g., speed humps), which may favour the needs of higher-income residents who face fewer
barriers to civic engagement.[33, 52] These inequities are also connected to issues of
displacement. Neighbourhood infrastructure improvements may reduce the affordability of an
5area and subsequently displace lower-income residents.[45, 51] This indicates that the pathway
between neighbourhood marginalization and built environment safety is likely bidirectional.
These complex effects of neighbourhood socio-demographics suggest that Toronto’s current
road safety approach may not be reaching some of the root causes of pedestrian collision risk.
Interventions that aim to change pedestrian behaviour or add modest safety features to the
roadway may not be sufficient to address more systemic disparities in the built environment or
ensure that improvements are incurred by marginalized populations.
Intervening on pedestrian safety inequities through Vision Zero
Since its creation, equity has been a central principle of Vision Zero. Within the approach, equity
is described as inclusive and representative planning processes and equitable road safety
outcomes for all road users in all areas of a city.[10, 53] A review of Vision Zero materials and its
uptake in over 25 North American jurisdictions illustrates some of the ways that equity has been
applied to road safety planning.c
Vision Zero positions safe mobility as a human right, part of the government’s obligation to
provide its people with life, liberty, and security.[54] It also calls for prioritization of roadway
investments in areas with disproportionate traffic collisions, recognizing that equity in road
safety is not about equally distributing resources, but rather about identifying and addressing
areas with historically less infrastructure investments.[10, 55] Strategies to center equity within
the approach include emphasizing policy and environmental changes over behavioural ones,
engaging communities in the decision-making process, and collaborating with multiple
stakeholders with diverse perspectives.[53]
Equity in Vision Zero is also addressed in the context of enforcement.[55] In many jurisdictions,
traffic safety regulations involve police enforcement, which connect road safety approaches to
issues of police violence and systemic racism.[56] Vision Zero has emphasized that its approach to
road safety is one that aims to proactively improve the built environment, rather than rely on
punitive enforcement practices.[56] It has also urged caution with data-driven decision-making,
since this usually relies on police-collected crash information rather than meaningful
community engagement.[56]
Several cities that have adopted a Vision Zero approach have incorporated equity into their road
safety planning. For example, the opening statement of Portland’s Vision Zero Action Plan
explicitly states that road safety interventions will address inequities faced by marginalized
communities in both traffic collisions and built environment features, and that the Plan must do
so without resulting in racial profiling.[57] This vision is acted on through the Plan’s commitment
c
The review of Vision Zero road safety strategies was conducted in September 2020 and included all 19 Canadian
jurisdictions that use Vision Zero and seven American cities that were identified through search engine browsing for
key terms.
6to consider equity data in decision-making, prioritize projects for ‘communities of concern’ (e.g.,
racialized persons or low-income households), and limit enforcement measures.[57, 58]
San Francisco has also considered the role of data in equitable road safety planning. Their
Department of Public Health found that collision reports from police, which informed Vision
Zero decision-making, significantly under-reported pedestrian injuries, particularly for African
Americans and males.[59] Based on this finding, they have now created a more comprehensive
database for collision reporting that draws on several administrative data sources to better
capture traffic collisions.[59] San Francisco has also targeted equity in enforcement by publicly
reporting police traffic enforcement activities on a quarterly basis, with transparency on racial
bias in traffic stops.[60]
Community engagement has been another area where cities have incorporated equity in Vision
Zero. Washington DC has hosted events in public spaces, like transit stations, where residents
could share their safety concerns and contribute to a crowd-sourced safety map that informed
intervention planning.[61] Portland has shifted the location of its community consultations on
road safety to local organizations rather than city-owned buildings and requires that law
enforcement officials attend consultations in plain clothes rather than uniform.[61] San
Francisco, Los Angeles, and Washington DC have all developed community grant programs that
aim to remove financial barriers to consultation participation and build local capacity to design
and implement community-led road safety measures.[61]
Canadian cities have also enacted promising practices for equity in Vision Zero. Edmonton, the
first Canadian municipality to adopt Vision Zero, has been a leader in equity-oriented road
safety with its upcoming Safe Mobility Strategy 2021-2025.[62] The City has started using
Gender-Based Analysis Plus d across its decision-making processes, which prompted an equity
analysis of traffic collision data.[63] As a result, Edmonton has developed criteria for road safety
projects to prioritize those in equity-seeking neighbourhoods.[62] It is also moving to proactive
safety reviews, where the City independently initiates safety evaluations in areas that are
experiencing high collision rates, instead of relying on resident-initiated infrastructure
improvement requests.[62]
Montreal’s Vision Zero Action Plan notes that it must ensure social equity when addressing road
safety, and that both planning process and evaluation indicators should capture disparities
between different social groups and road users.[64] Vision Zero Surrey presents data on the
higher burden of collision harms for Indigenous people and low-income communities and
contains equity as a focus area with actions around targeted improvements for and partnerships
with neighbourhoods and populations disproportionately affected by collisions.[65]
d
The Government of Canada defines Gender-Based Analysis Plus as: an analytical process used to assess how
diverse groups of women, men, and gender diverse people may experience policies, programs and initiatives. The
‘plus’ refers to intersecting identity factors like race, ethnicity, religion, age, and mental or physical disability.
7Other places in Canada, like Hamilton, Kingston, and Manitoba do include equity in their Vision
Zero strategies, but with limited action beyond setting it as a guiding principle for the strategy
itself and community engagement activities.[66-68] However, most of the 19 Canadian
jurisdictions that use Vision Zero do not mention equity in their road safety plans.[69]
Toronto is ahead of many other cities with its recognition of collision disparities by area-level
socio-demographics and the need for a social justice and equity lens in road safety planning. In
early 2021, Toronto furthered its progress by defining a Transportation Equity Lens that
considers seven equity categories (e.g., ability, gender, race) comprised of 17 equity-seeking
groups (e.g., low-income groups, racialized groups).[6] This Lens will be used to generate
baseline equity measures of transportation capital programs and ultimately guide capital
funding decisions.
This step forward can be a catalyst for improved pedestrian safety across the city. As Toronto
continues into the second phase of its road safety strategy, it has a timely opportunity to
become a leader in equitable planning and create meaningful change in marginalized
neighbourhoods.
Policy goals for Toronto’s approach to road safety
As Toronto looks ahead its renewed road safety strategy and upcoming equity tools, there are
key policy goals that the City can use to best implement equitable pedestrian safety planning,
drawn from the literature and other jurisdictions.[6, 55, 61, 70-72]
1) Developing a definition of equity
To achieve equity in road safety in Toronto, it is first necessary to have a clear and explicit
understanding of how equity will be operationalized and evaluated in practice. The City has
started to meet this need through development of a Transportation Equity Lens, which follows
the best practice of directly naming equity-seeking populations and communities. As this
definition and its application are further established, it will remain important for the City to
engage diverse stakeholders, acknowledge the systemic barriers that have produced inequity,
and continue to draw connections between elements of the road safety strategy and their
potential impacts on equity-seeking groups. A strong definition can also go a step further to link
transportation equity to broader equity issues around housing, employment, and land use. The
City has also begun to measure equity baselines for its transportation capital programs –
adopting another best practice of complementing an equity definition with evaluation indicators
to monitor and assess if equitable outcomes are being achieved. Since both the equity definition
and evaluation metrics currently apply to only capital programs, future efforts can aim to
translate these approaches to operating expenses.
82) Applying inclusive planning processes
Urban planning processes can often exclude marginalized groups and therefore not reflect the
needs of diverse communities. Community engagement approaches that leverage Toronto’s
local champions and spaces, offer financial compensation, and build community capacity for
built environment design can reduce some of the traditional barriers to participation.
Engagement activities and materials should continue to be culturally and linguistically
appropriate and develop long-term relationships with stakeholders. The City can employ
innovative methods of community engagement like ‘pop-up’ feedback opportunities in public
spaces and community-led street transformation projects. It can also continue to emphasize
proactive quantitative and qualitative data-driven decision-making over request-based
processes for road safety interventions.
3) Leveraging data for equity
Data on collision inequities can support action to eliminate them. Toronto’s Vision Zero Mapping
Tool and commitment to open data on collisions are great examples of making data accessible
for equity analysis and evaluation. Toronto has also identified certain districts of the city that
have more collisions and indicators of lower socioeconomic status. An important next step will
be to analyze collision data at smaller geographies to determine sociodemographic predictors of
pedestrian and other traffic collisions, and their connections to the built environment. Findings
of this equity analysis can be used in the City’s upcoming prioritization tool for transportation
capital programs and be shared publicly to allow for data transparency. This will align with
Toronto’s ongoing shift from a focus on vulnerable road users to a focus on neighbourhoods
requiring infrastructure improvements. This can be complemented with data analysis and
evaluation beyond KSI collisions that capture the distribution and quality of built environment
features, something the City has started to undertake in developing equity baseline measures
for its capital programs. Additionally, potential limitations of police collision data can be
mitigated by using multiple sources of data on collisions, such as administrative health data,
which can advance understanding of health burden.
4) Ensuring equitable enforcement practices
Road safety regulations can be inequitably enforced due to systemic discrimination and racial
profiling. Toronto has taken steps to address enforcement inequities through the use of
automated enforcement technologies, however, these technologies need to be developed and
placed in consultation with equity-seeking groups to mitigate bias and concerns with
surveillance. Toronto’s approach should ensure it does not promote increased penalties, fines,
or police involvement, and engage with affected communities around the $2.5M in new funding
for enhanced traffic enforcement teams through Toronto Police Services. Prioritizing a road
safety approach that truly improves policies, processes, and design will hopefully limit the need
for enforcement.
9Conclusion
Pedestrian collisions remain a serious challenge on Toronto’s streets. Even with several road
safety interventions recently implemented across the city, pedestrian safety has not improved
under the Vision Zero approach – and marginalized communities may be the most at risk for
harm. A new framing of road safety that is guided by equity and considers neighbourhood socio-
demographics offers the potential for safer streets. Recent progress in equitable transportation
planning creates an opportunity to get there. To act on this, Toronto’s Road Safety Plan can
commit to further development and application of an equity definition and evaluation
indicators, an inclusive and innovative community engagement process, an equity-focused data
strategy, and addressing enforcement. These steps can shape a city with safe and equitable
mobility for all its residents.
10References
[1] City of Toronto, "Toronto Complete Streets Guidelines," City of Toronto, Toronto, 2017.
[2] Toronto Star, "Deadly streets: Pedestrian safety," 2020. [Online]. Available: https://www.thestar.com/news/pedestrian-
road-safety.html.
[3] Toronto Police Services, "Pedestrians," 2020. [Online]. Available: https://data.torontopolice.on.ca/pages/pedestrians.
[4] City of Toronto, "Vision Zero dashboard," 2020. [Online]. Available: https://www.toronto.ca/services-payments/streets-
parking-transportation/road-safety/vision-zero/vision-zero-dashboard/.
[5] City of Toronto, "Vision Zero 2.0 Road Safety Plan update," City of Toronto, Toronto, 2019.
[6] City of Toronto, "2021 Budget Notes - Transporation Services," City of Toronto, Toronto, 2021.
[7] City of Toronto, "Attachment 9: Killed or seriously injured collision trends by emphasis area," City of Toronto, Toronto,
2019.
[8] City of Toronto, "Vision Zero: Toronto's Road Safety Plan," City of Toronto, Toronto, 2017.
[9] City of Toronto, "Road Safety Plan (RSP): 2017-2021," City of Toronto, Toronto, 2016.
[10] Vision Zero Network, "A primer on Vision Zero: Advancing safe mobility for all," Vision Zero Network, San Francisco, 2018.
[11] E. Kim, P. Muenning and Z. Rosen, "Vision Zero: A toolkit for road safety in the modern era," Injury Epidemiology, vol. 4,
no. 1, 2017.
[12] Vision Zero Network, "Core elements for Vision Zero communities," Vision Zero Network, San Francisco, 2018.
[13] World Health Organization, "World report on road traffic injury prevention," World Health Organization, Geneva, 2004.
[14] C. D. Cottrill and P. Thakuriah, " Evaluating pedestrian crashes in areas with high low-income or minority populations,"
Accident Analysis and Prevention, vol. 42, pp. 1718-1728, 2010.
[15] J. Lee, M. Abdel-Aty and X. Jiang, "Multivariate crash modeling for motor vehicle and non-motorized modes at the
macroscopic level," Accident Analysis and Prevention, vol. 78, pp. 146-154, 2015.
[16] P. Lin, R. Guo, E. Bialkowska-Jelinska, A. Kourtellis and Y. Zhang, "Development of countermeasures to effectively improve
pedestrian safety in low-income areas," Journal of Traffic and Transportation Engineering, vol. 6, no. 2, pp. 162-174, 2019.
[17] C. Siddiqui, M. Abdel-Aty and K. Choi, "Macroscopic spatial analysis of pedestrian and bicycle crashes," Accident Analysis
and Prevention, vol. 45, pp. 382-391, 2012.
[18] C. Siddiqui, M. Abdel-Aty and K. Choi, "Implications of pedestrian safety planning factors in areas with minority and low-
income populations," International Journal of Sustainable Transportation, vol. 8, pp. 360-381, 2014.
[19] J. J. Forbes and M. A. Habib, "Pedestrian injury severity levels in the Halifax Regional Municipality, Nova Scotia, Canada,"
Transportation Research Record: Journal of the Transportation Research Board, vol. 2519, pp. 172-178, 2015.
[20] A. Quistberg, E. J. Howard, B. E. Ebel, A. V. Moudon, B. E. Saelens, P. M. Hurvitz, J. E. Curtin and F. P. Rivara, "Multilevel
models for evaluating the risk of pedestrian–motor vehicle collisions at intersections and mid-blocks," Accident Analysis
and Prevention, vol. 84, pp. 99-111, 2015.
[21] P. Morency, L. Gauvin, C. Plante, M. Fournier and C. Morency, "Neighborhood social inequalities in road traffic injuries:
The influence of traffic volume and road design," American Journal of Public Health, vol. 102, no. 6, pp. 1112-1119, 2012.
[22] R. B. Noland, N. J. Klein and N. K. Tulach, "Do lower income areas have more pedestrian casualties?," Accident Analysis
and Prevention, vol. 59, pp. 337-345, 2013.
[23] M. Statter, T. Schuble, M. Harris-Rosado, D. Liu and K. Quinlan, "Targeting pediatric pedestrian injury prevention efforts:
Teasing the information through spatial analysis," Journal of Trauma: Injury, Infection, and Critical Care, vol. 71, no. 5, pp.
S511-S516, 2011.
[24] B. Chakravarthy, C. L. Anderson, J. Ludlow, S. Loftipour and F. E. Vaca, "The relationship of pedestrian injuries to
socioeconomic characteristics in a large Southern California county," Traffic Injury Prevention, vol. 11, no. 5, pp. 508-513,
2010.
[25] A. Loukaitou-Sideris, R. Liggett and H. G. Sung, "Death on the crosswalk: A study of pedestrian-automobile collisions in Los
Angeles," Journal of Planning Education and Research, vol. 26, pp. 338-351, 2007.
[26] A. K. Sebert Kuhlmann, J. Brett, D. Thomas and S. Sain, "Environmental characteristics associated with pedestrian–motor
vehicle collisions in Denver, Colorado," American Journal of Public Health, vol. 99, no. 9, pp. 1632-1637, 2009.
[27] A. Toran Pour, S. Moridpour, R. Tay and A. Rajabford, "Neighborhood influences on vehicle-pedestrian crash severity,"
Journal of Urban Health, vol. 94, pp. 855-868, 2017.
11[28] A. V. Moudon, L. Lin, J. Jiao, P. Hurvitz and P. Reeves, "The risk of pedestrian injury and fatality in collisions with motor
vehicles, a social ecological study of state routes and city streets in King County, Washington," Accident Analysis and
Prevention, vol. 43, pp. 11-24, 2011.
[29] A. Osama and S. T, "Macro-spatial approach for evaluating the impact of socio-economics, land use, built environment,
and road facility on pedestrian safety," Canadian Journal of Civil Engineering, vol. 44, pp. 1036-1044, 2017.
[30] B. Chakravarthy, C. L. Anderson, J. Ludlow, S. Loftipour and F. E. Vaca, "A geographic analysis of collisions involving child
pedestrians in a large Southern California county," Traffic Injury Prevention, vol. 13, pp. 193-198, 2012.
[31] J. Lee, M. Abdel-Aty, K. Choi and H. Huang, "Multi-level hot zone identification for pedestrian safety," Accident Analysis
and Prevention, vol. 76, pp. 64-73, 2015.
[32] E. A. LaScala, P. J. Gruenewald and F. W. Johnson, "An ecological study of the locations of schools and child pedestrian
injury collisions," Accident Analysis and Prevention, vol. 36, pp. 569-576, 2004.
[33] L. Rothman, M. S. Cloutier, K. Manaugh, A. W. Howard, A. K. Macpherson and C. Macarthur, "Spatial distribution of
roadway environment features related to child pedestrian safety by census tract income in Toronto, Canada," Injury
Prevention, vol. 0, pp. 1-5, 2019.
[34] M. Wier, J. Weintraub, E. H. Humphreys, E. Seto and R. Bhatia, "An area-level model of vehicle-pedestrian injury collisions
with implications for land use and transportation planning," Accident Analysis and Prevention, vol. 41, pp. 137-145, 2009.
[35] P. Hewson, "Deprived children or deprived neighbourhoods? A public health approach to the investigation of links
between deprivation and injury risk with specific reference to child road safety in Devon County, UK," BMC Public Health,
vol. 4, pp. 15-25, 2004.
[36] F. J. Al-Mahameed, Q. X, R. J. Schneider and M. R. R. Shaon, "Analyzing pedestrian and bicyclist crashes at the corridor
level: Structural equation modeling approach," Transportation Research Record, vol. 2673, no. 7, pp. 308-318, 2019.
[37] T. L. Grant, N. Edwards, H. Sveistrup, C. Andrew and M. Egan, "Inequitable walking conditions among older people:
examining the interrelationship of neighbourhood socio-economic status and urban form using a comparative case study,"
BMC Public Health, vol. 10, pp. 677-693, 2010.
[38] R. Poulos, A. Hayen, C. Finch and A. Zwi, "Area socioeconomic status and childhood injury morbidity in New South Wales,
Australia," Injury Prevention, vol. 13, pp. 322-327, 2007.
[39] R. Steinbach, J. Green, P. Edwards and C. Grundy, "‘Race’ or place? Explaining ethnic variations in childhood pedestrian
injury rates in London," Health & Place, vol. 16, pp. 34-42, 2010.
[40] R. Steinbach, J. Green, M. G. Kenward and P. Edwards, "Is ethnic density associated with risk of child pedestrian injury? A
comparison of inter-census changes in ethnic populations and injury rates," Ethnicity & Health, vol. 21, no. 1, pp. 1-19,
2016.
[41] A. Toran Pour, S. Moridpour, M. Tay and A. Rajabifard, "Modelling pedestrian crash severity at mid-blocks,"
Transportmetrica A: Transport Science, vol. 13, no. 3, pp. 273-297, 2017.
[42] K. Xie, K. Ozbay, A. Kurkcu and H. Yang, "Analysis of traffic crashes involving pedestrians using big data: Investigation of
contributing factors and identification of hotspots," Risk Analysis, vol. 37, no. 8, pp. 1459-1476, 2017.
[43] J. D. Silverman, M. G. Hutchinson and M. D. Cusimano, "Association between neighbourhood marginalization and
pedestrian and cyclist collisions," Canadian Journal of Public Health, vol. 104, no. 5, pp. e405-e409, 2013.
[44] J. X. Hagen, "Traffic calming and environmental justice: New York City’s Neighborhood Slow Zones," Transportation
Research Record, vol. 2672, no. 3, pp. 175-184, 2018.
[45] A. Adkins, C. Makarewicz, M. Scanze, M. Ingram and G. Luhr, "Contextualizing walkability: Do relationships between built
environments and walking vary by socioeconomic status?," Journal of the American Planning Association, vol. 83, no. 3,
pp. 296-314, 2017.
[46] K. Gibbs, S. S. J, N. Nicholson, D. C. Barker and F. J. Chaloupka, "Income disparities in street features that encourage
walking," Institute for Health Research and Policy, University of Illinois at Chicago, Chicago, 2012.
[47] D. C. A. Collins and R. A. Kearns, "Geographies of inequality: Child pedestrian injury and walking school buses in Auckland,
New Zealand," Social Science and Medicine, vol. 60, pp. 61-69, 2005.
[48] S. Zimmerman, M. Lieberman, K. Kramer and B. Sadler, "At the intersection of active transportation and equity: Joining
forces to make communities healthier and fairer," Safe Routes to School National Partnership, Fairfax, 2015.
[49] C. M. Thornton, T. L. Conway, K. L. Cain, K. A. Gavand, B. E. Saelens, L. D. Frank, C. M. Geremia, K. Glanz, A. C. King and J. F.
Sallis, "Disparities in pedestrian streetscape environments by income and race/ethnicity," SSM Population Health, vol. 2,
pp. 2016-216, 2016.
12[50] Toronto Public Health, "The walkable city: Neighbourhood design and preferences, travel choices and health," City of
Toronto, Toronto, 2012.
[51] B. Bereitschaft, "Equity in microscale urban design and walkability: A photographic survey of six Pittsburgh streetscapes,"
Sustainability, vol. 9, pp. 1233-1253, 2017.
[52] G. A. Battista and K. Manaugh, "Examining social inclusion among pedestrian plans in Canada," The Canadian Geographer,
vol. 63, no. 4, p. 663–675, 2019.
[53] Vision Zero Network, "9 components of a strong Vision Zero commitment," Vision Zero Network, San Francisco, 2018.
[54] Vision Zero Canada, "Vision Zero principles," 2019. [Online]. Available: https://visionzero.ca/.
[55] Vision Zero Network, "Elevating equity in Vision Zero communications: A white paper framing the challenges and
opportunities," Vision Zero Network, San Francisco, 2016.
[56] L. Shahum, "Acting for racial justice and just mobility - Vision Zero advocates: Let's step up to our responsibilities," Vision
Zero Network, San Francisco, 2020.
[57] City of Portland, "Vision Zero Action Plan: Saving lives with safe streets," City of Portland, Portland, 2016.
[58] Oregon Metro Planning and Development, "Equity in Vision Zero - Oregon Metro," Oregon Metro, Portland, 2020.
[59] Vision Zero Network, "The central role of public health in Vision Zero," Vision Zero Network, San Francisco, 2016.
[60] Vision Zero Network, "Vision, strategies, action: Guidelines for an effective Vision Zero action plan," Vision Zero Network,
San Francisco, 2017.
[61] Vision Zero Network, "Equity strategies for practitioners," Vision Zero Network, San Francisco, 2017.
[62] City of Edmonton, "Safe Mobility Strategy 2021-2025: Themes and draft key actions," City of Edmonton, Edmonton, 2020.
[63] City of Edmonton, "What we heard report: Safe mobility strategy public engagement," City of Edmonton, Edmonton,
2020.
[64] City of Montreal, "Plan d'action Vision Zero décès et blessé grave 2019-2021: Des assises solides pour mieux travailler
ensemble," City of Montreal, Montreal, 2019.
[65] City of Surrey, "Safe streets for everyone: Vision Zero Surrey Safe Mobility Plan 2019-2023," City of Surrey, Surrey, 2019.
[66] City of Hamilton, "Vision Zero Hamilton: 2019-2025 Action Plan," City of Hamilton, Hamilton, 2019.
[67] City of Kingston & CIMA+, "Vision Zero: Kingston's Road Safety Plan," City of Kingston, Kingston, 2019.
[68] Government of Manitoba & Manitoba Public Insurance, "Manitoba Road Safety Plan 2017-2020: Road to zero,"
Government of Manitoba, Winnipeg, 2017.
[69] Parachute, "Vision Zero Canadian landscape 2.0: Successes and opportunities," Parachute, Toronto, 2019.
[70] M. Aboelata, E. Yanez and R. Kharrazi, "Vision Zero: A health equity road map for getting to zero in every community,"
Prevention Institute, Oakland, 2017.
[71] Vision Zero Network, "Moving from vision to action: Fundamental principles, policies and practices to advance Vision Zero
in the U.S.," Vision Zero Network, San Francisco, 2017.
[72] C. Veka, "Vision Zero and the equity lens," Portland Bureau of Transportation, Portland, 2017.
[73] S. E. Rodgers, S. J. Jones, S. M. Macey and R. A. Lyons, "Using geographical information systems to assess the equitable
distribution of traffic-calming measures: translational research," Injury Prevention, vol. 16, pp. 7-11, 2010.
[74] Toronto Police Services, "Killed or Seriously Injured (KSI) glossary," Toronto Police Services, Toronto, 2019.
[75] City of Toronto, "Neighbourhood profiles," 2016. [Online]. Available: https://www.toronto.ca/city-government/data-
research-maps/neighbourhoods-communities/neighbourhood-profiles/.
[76] Smart Growth America, "Dangerous by design 2019: The most vulnerable," 2019. [Online]. Available:
https://smartgrowthamerica.org/dangerous-by-design/.
13You can also read