Pennsylvania Video Gaming Terminal (VGT) Impact Analysis
←
→
Page content transcription
If your browser does not render page correctly, please read the page content below
Pennsylvania Video Gaming Terminal (VGT)
                          Impact Analysis

                                                                    Prepared for:

         Harrah’s Philadelphia, Mohegan Sun Pocono, SugarHouse Casino, Rivers
Pittsburgh, Lady Luck Casino Nemacolin, Presque Isle Downs Casino, Valley Forge
                                                                 Casino Resort
                                                                         May 2016

                                                                       Prepared by:

                                                               The Innovation Group
                                                             400 North Peters Street
                                                                           Suite 206
                                                            New Orleans, LA 70130
                                                                      504.523.0888
                                                      tzitt@theinnovationgroup.com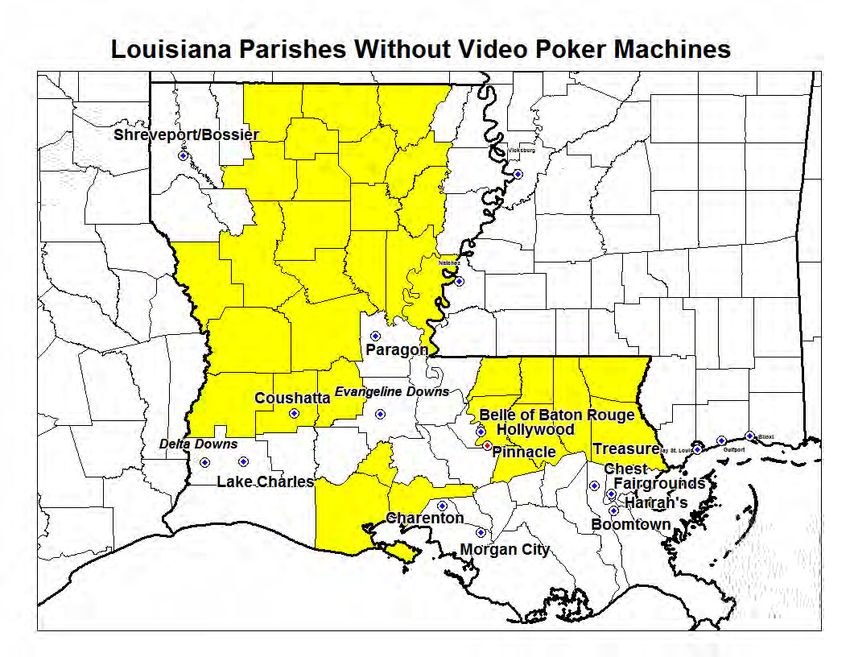
VGT Impact Analysis, Pennsylvania

                                                        Table of Contents

EXECUTIVE SUMMARY .......................................................................................................... 1
INTRODUCTION......................................................................................................................... 3
COMPARATIVE ANALYSIS..................................................................................................... 5
   ILLINOIS VIDEO GAMING TERMINALS (VGTS) ............................................................................ 5
     Historical Trends and Penetration Analysis ........................................................................... 5
     Impact on Casino Revenue...................................................................................................... 8
   LOUISIANA VIDEO GAMING DEVICES (VGDS) .......................................................................... 12
     Historical Trends and Penetration Analysis ......................................................................... 14
     Impact on Casino Revenue.................................................................................................... 14
   WEST VIRGINIA LIMITED VIDEO LOTTERY TERMINALS (VLTS) ................................................ 16
     Historical Trends and Penetration Analysis ......................................................................... 16
     Impact on Casino Revenue.................................................................................................... 17
VGT IMPACT ON PENNSYLVANIA CASINOS .................................................................. 20
   HISTORICAL TRENDS ................................................................................................................. 20
   BASELINE FORECAST ................................................................................................................. 23
   VGT IMPACT ............................................................................................................................. 24
FISCAL ANALYSIS ................................................................................................................... 25
   CASINO STATE TAX IMPACT ...................................................................................................... 25
   LOTTERY IMPACT....................................................................................................................... 26
JOBS ANALYSIS ....................................................................................................................... 28
   CASINO EMPLOYMENT IMPACT .................................................................................................. 28
CONCLUSION ........................................................................................................................... 30
DISCLAIMER............................................................................................................................. 31

The Innovation Group Project #028-16                       May 2016                                                        Page i
EXECUTIVE SUMMARY
The Innovation Group was commissioned to analyze the potential impact on Pennsylvania
casinos from deploying video gaming terminals (VGTs) throughout Pennsylvania. The purpose
of this analysis is to assess the impacts that distributed (or ambient) VGTs will have on casino
revenues, fiscal contributions and employment throughout Pennsylvania.
The assessment first forecasted slot machine revenue in Pennsylvania through 2020 absent the
development of VGTs. We then assessed the impacts on casino slot revenue assuming VGTs are
deployed beginning in late 2017, based on a comparative analysis of VGT markets in other
states, primarily Illinois.
The proposed VGT legislation for Pennsylvania is modeled after the VGT industry in Illinois.
The only major difference in the proposed Pennsylvania legislation is the lack of a local option.
In Illinois, local jurisdictions can enact ordinances prohibiting VGT development.
As proposed, and based on trends in Illinois, the VGT legislation would be expected to result in
the following level of gaming expansion in Pennsylvania:
• Statewide, upwards of 9,000 VGT establishments and 40,000 devices are estimated to be
developed by 2020. This would more than double the supply of gaming machines in the
state and represent the equivalent of 18 additional casinos based on the average number
of slot machines operating at Pennsylvania’s 12 existing facilities.
• A large portion of this development would be expected to occur not at existing bars and
restaurants but rather “café” chains operating primarily as mini-casinos. Nationally
established route operators—companies that operate distributed machine gaming in states
such as Nevada, Montana, and Illinois—have indicated to investors that Pennsylvania is a
prime market for expansion should VGT legislation be enacted.
• The legislation calls for a three-way split of VGT revenue: 33% to the establishment,
33% to the operator and 34% to the Commonwealth’s General Fund. By contrast, slot
machines are taxed at an effective rate of 55%.
• The proposed Pennsylvania VGT legislation does not address the topic of self-exclusion;
therefore it is assumed that VGT operators would not be required to establish and
implement a self-exclusion system for the protection of vulnerable persons and that there
would not be a state-administered self-exclusion system analogous to the one governing
casino operations. This, along with a lack of requirements for the important and costly
security and regulatory protections required in strictly regulated casinos, would tend to
give VGTs a competitive advantage over casinos and maximize penetration of local
markets.
To assess the potential impact of VGTs on Pennsylvania casinos, the Innovation Group
examined data from three jurisdictions that have casinos as well as distributed machine gaming,
The Innovation Group Project #028-16 May 2016 Page 1with Illinois being the most directly comparable. We estimate that VGT development in Illinois
has, over the course of three years, eroded slot machine revenue at affected casinos by an
average of 18%.
Casino slot revenue, which is taxed at the effective rate of 53.5%, is estimated to decline by
between $553 million and $674 million compared to what otherwise would be expected for 2020
in the absence of VGT development.
Pennsylvania Slot Revenue Projections (MMs)
Low Trend Medium Trend High Trend
2017 Baseline $2,462.5 $2,510.6 $2,572.4
2020 without VGT impacts $2,571.9 $2,661.9 $2,783.6
2020 with VGT impacts $2,019.2 $2,058.7 $2,109.3
Impact on Casino Slot Rev 2020 -$552.7 -$603.2 -$674.3
Source: The Innovation Group
Three earmarked programs would suffer declines proportionate to the decline in slot machine
revenue:
Pennsylvania Slot Revenue Tax Impacts 2020 (000s)
Low Medium High
Property Tax Relief (34%) -$187,914 -$205,100 -$229,249
Economic Development and Tourism Fund (5%) -$27,634 -$30,162 -$33,713
Race Horse Development Fund (10.5%) -$58,032 -$63,340 -$70,797
Source: The Innovation Group
In the mid-range, Property Tax relief is estimated to decline by $205 million, the EDTF by $30
million, and the PRHDF by $63 million. In the high range, these impacts would be significantly
greater, with Property Tax relief declining by $229 million, the EDTF by $33 million, and the
PRHDF by $71 million.
The fourth program funded by slot revenue, the Local Share Assessment (LSA), would,
depending upon the jurisdiction, also face declines but not necessarily on a proportionate basis.
Designed for host jurisdictions to enhance municipal services such as police and fire and fund
capital improvement projects, many LSAs have $10 million minimums and, additionally, some
casinos have individual revenue-based community sharing agreements on top of the statutory
LSA. The proposed VGT legislation provides for no local funding.
Host communities could also be expected to be impacted by lay-offs at the casinos, with nearly
1,750 jobs estimated to be cut at Pennsylvania casinos, reducing incomes and consumer spending
power. Lady Luck Nemacolin is particularly vulnerable, given its remote location 20 minutes
from the nearest sizable population base. The operation of VGTs in the Uniontown-
Connellsville area could put the viability of Lady Luck into question and its closing would result
in 230 additional job losses.
Moreover, there is the risk of negative impacts to lottery sales. We estimate that up to $67
million in lottery transfers to government programs would be at risk by VGT development.
The Innovation Group Project #028-16 May 2016 Page 2INTRODUCTION
The Innovation Group was commissioned to analyze the potential impact on Pennsylvania
casinos from deploying video gaming terminals (VGTs) throughout Pennsylvania. The purpose
of this analysis is to assess the impacts that distributed (or ambient) VGTs will have on casino
revenues, fiscal contributions and employment throughout Pennsylvania.
The assessment consists of two scenarios: a baseline (no VGT) scenario (including commercial
casinos and relevant future regional gaming projects) and the impact of introducing video
gaming terminals. Revenue projections for both scenarios are provided based on historical
revenue trends and a comparative analysis of VGT markets in other states.
In the future revenue forecast, this analysis accounts for the following four developments
currently underway in Pennsylvania and adjacent states: 1) the addition of Philadelphia Live! to
Philadelphia market; 2) SugarHouse’s gaming and amenity expansion; 3) the Montreign casino
development in Monticello, New York, and; 4) the MGM project in Prince George’s County,
Maryland. The proposed Category 1 casino in Lawrence County has not been included;
however, it should be noted that VGT development would place further negative pressure on a
project that has struggled to get off the ground.
The proposed VGT legislation for Pennsylvania is modeled after the VGT industry in Illinois.
The following bullets describe some of the key assumptions for VGT operations utilized in this
study:
• Licensed liquor establishments and truck stops would be permitted to operate up to five
VGTs. In Illinois the VGT industry has expanded well beyond simply being an adjunct
source of income for existing bars and restaurants. Instead, a number of “café” chains
have opened across the state that operate primarily as mini-casinos. Such chains would
be allowed in Pennsylvania, and it is assumed in this analysis that VGT supply will not
be constrained other than the 5-machine-per-venue limit.
• The only major difference in the proposed Pennsylvania legislation is the lack of a local
option. In Illinois, local jurisdictions can enact ordinances prohibiting VGT
development. Chicago is the most prominent municipality that has opted out; in total,
jurisdictions representing 36.6% of the gaming-age population of Illinois have prohibited
VGTs.
• Given the lack of a local option in Pennsylvania, we estimate that VGT development
could reach a minimum of 37,000 and upwards of 40,000 machines within three years of
implementation. In Illinois, there are 22,815 VGTs operating in jurisdictions with 5.9
million gaming-age residents (as of March 2016) and the number continues to rise. A
similar level of development throughout the entirety of Pennsylvania would equal nearly
37,000 machines. This would more than double the supply of gaming machines in the
state and represent the equivalent of 18 additional casinos based on the average number
of slot machines operating at Pennsylvania’s 12 existing facilities.
The Innovation Group Project #028-16 May 2016 Page 3• The number of VGT establishments is estimated to range from 7,400 to 9,000.
• The proposed Pennsylvania VGT legislation does not address the topic of self-exclusion;
therefore it is assumed that VGT operators would not be required to establish and
implement a self-exclusion system and that there would not be a state-administered self-
exclusion system analogous to the one governing casino operations. This, along with
lack of requirements for security and surveillance, would tend to give VGTs a
competitive advantage over casinos and maximize penetration of local markets.
The Innovation Group Project #028-16 May 2016 Page 4COMPARATIVE ANALYSIS To assess the potential impact of VGTs on Pennsylvania casinos, the Innovation Group examined data from three jurisdictions that have casinos as well as distributed machine gaming. Illinois is the most directly comparable. Not only is the proposed Pennsylvania legislation modeled after Illinois, with the notable exception of the lack of a local option, but Illinois also offers a clear before-and-after picture of VGT impact on casinos. Louisiana offers corroborating evidence of impact although venues there are limited to three video poker devices, which is a more limited form of gaming than VGTs. Finally, data from West Virginia also corroborates the premise that VGT gaming cannibalizes local market revenue from casinos. Illinois Video Gaming Terminals (VGTs) There are currently nearly 23,000 VGTs operating in Illinois. The first machines began operating in September 2012 but the industry did not reach the half-way point of development until late in 2013. By December 2013 the industry had grown to more than 13,000 machines. Local jurisdictions are permitted to opt-out; 176 municipalities and unincorporated counties have opted out, including the City of Chicago and unincorporated Cook County. As of 2015, VGTs were operating in jurisdictions representing 63% of the gaming-age population of Illinois. As the following analysis details, slot machine revenue has declined by an average of 20.7% in casinos affected by VGT development. Discounting the background factor of sluggish slot performance in 2013 and 2014, the average impact to slot revenue attributable to VGT development is estimated to be 18%. Because of the local option, Illinois casinos face different levels of VGT competition. Municipalities surrounding Rivers Casino in Des Plaines, for example, have opted out, including the City of Chicago. Therefore, Rivers has been excluded from the impact analysis. However, in markets where VGT development is extensive, slot revenues at casinos have declined by as much as 25%. Historical Trends and Penetration Analysis As the following table shows, VGT development in Illinois has shown consistent and dramatic growth, both in terms of supply and revenue. This growth curve has occurred in the context of the local option, which has tended to act as a braking force on development viewed from a statewide perspective. VGT development in Pennsylvania would be expected to be even more rapid and expansive. The Innovation Group Project #028-16 May 2016 Page 5
Illinois VGTs: Historical Performance
                   Date                        VGT Count            Net Terminal                      WPU
                                                                    Income (NTI)
                   Sep-12                               61               $90,071                  $49.21
                   Oct-12                              714            $1,387,961                  $62.71
                   Nov-12                            1,439            $3,829,324                  $88.69
                   Dec-12                            2,290            $6,994,482                  $98.53

                   Jan-13                            3,379            $9,780,807                  $93.37
                   Feb-13                            4,353           $13,578,457                 $111.40
                   Mar-13                            5,092           $18,790,560                 $119.04
                   Apr-13                            6,219           $20,294,768                 $108.78
                   May-13                            6,956           $23,077,392                 $107.01
                   Jun-13                            7,920           $23,247,536                  $97.85
                   Jul-13                            8,830           $25,534,529                  $93.30
                   Aug-13                            9,380           $29,120,485                 $100.14
                   Sep-13                           10,250           $29,622,666                  $96.33
                   Oct-13                           11,105           $33,987,917                  $98.73
                   Nov-13                           12,113           $36,008,857                  $98.94
                   Dec-13                           13,374           $37,637,399                  $90.78

                   Jan-14                           14,423           $38,432,324                  $85.94
                   Feb-14                           14,859           $44,070,414                 $105.94
                   Mar-14                           15,667           $53,369,680                 $109.89
                   Apr-14                           16,380           $52,309,541                 $106.45
                   May-14                           16,879           $54,551,321                 $104.25
                   Jun-14                           17,467           $50,775,438                  $96.89
                   Jul-14                           17,954           $55,594,241                 $100.53
                   Aug-14                           18,118           $59,075,332                 $105.18
                   Sep-14                           18,412           $57,489,764                 $104.08
                   Oct-14                           18,669           $64,501,457                 $111.45
                   Nov-14                           18,940           $62,530,031                 $110.05
                   Dec-14                           19,182           $66,412,022                 $112.35

                   Jan-15                           19,125           $65,443,002                 $110.38
                   Feb-15                           19,069           $68,486,057                 $128.27
                   Mar-15                           19,142           $77,648,637                 $130.86
                   Apr-15                           19,873           $76,500,302                 $124.17
                   May-15                           20,349           $77,848,369                 $123.41
                   Jun-15                           20,730           $72,830,477                 $117.11
                   Jul-15                           20,751           $75,752,822                 $117.75
                   Aug-15                           21,208           $75,919,973                 $115.48
                   Sep-15                           21,509           $75,578,047                 $117.13
                   Oct-15                           21,695           $83,151,472                 $123.63
                   Nov-15                           21,908           $78,940,507                 $120.12
                   Dec-15                           22,135           $85,504,371                 $124.60

                   2013                              8,248          $300,681,373                  $99.86
                   2014                             17,246          $659,111,566                 $104.83
                   2015                             20,625          $913,604,038                 $121.03
                          Source: Illinois Gaming Board; WPU=Win per Unit, or the daily NTI per VGT

The Innovation Group Project #028-16               May 2016                                                 Page 6
The industry continued to ramp up in the 1st Quarter of 2016, with Net Terminal Income (NTI)
increasing by 8.8% quarter-over-quarter as the number of establishments and machines also
continued to grow.
Illinois VGTs: 1Q 2016 Results
Date Establishments VGT Count NTI WPU
Jan-16 5,235 22,295 $81,576,872 $118.03
Feb-16 5,290 22,525 $88,880,884 $136.06
Mar-16 5,351 22,815 $98,879,071 $139.80
4Q 2015 5,189 21,913 $247,596,351 $125.55
1Q 2016 5,292 22,545 $269,336,827 $131.28
% Change 2.0% 2.9% 8.8% 4.6%
Source: Illinois Gaming Board
On a statewide basis, as of 2015 there were 3.5 machines for every 1,000 persons of gaming age
in jurisdictions that permit VGTs. Establishments are permitted up to 5 devices; the statewide
average is slightly above 4 per venue.
Illinois VGT Penetration of Host Jurisdiction Gamer Pop
VGTs per VGTs per 1,000
venue gamers
2013 4.16 1.7
2014 4.07 3.0
2015 4.18 3.5
Source: Illinois Gaming Board; IXPRESS/Nielsen Claritas; The Innovation Group
Penetration rates vary between markets that also host casinos and where VGTs enjoy
monopolies. This can be seen clearly comparing two similar metropolitan areas in the interior of
the state. VGTs in Peoria, which hosts the Par-a-Dice Casino, have a lower WPU and lower win
per capita than Springfield, which is approximately 70 miles from the nearest casino.
Illinois VGT Penetration: Casino vs. Non-Casino Markets
Daily WPU VGTs per 1,000 Spend per
gamers capita
Peoria $97 4.28 $97
Springfield $126 6.84 $314
Source: Illinois Gaming Board; IXPRESS/Nielsen Claritas; The Innovation Group
Based on 10-mile rings for population and VGT operations
Decatur and Rockford have penetration rates highly consistent with Springfield.
The Innovation Group Project #028-16 May 2016 Page 7Illinois VGT Penetration: Non-Casino Markets
Daily WPU VGTs per 1,000 Spend per
gamers capita
Decatur $166 5.55 $336
Rockford $153 5.83 $326
Springfield $126 6.84 $314
Source: Illinois Gaming Board; IXPRESS/Nielsen Claritas; The Innovation Group
Based on 10-mile rings for population and VGT operations
Spend per capita in casino markets are generally in the $100 range, at least where VGTs are
consistently spread throughout municipalities within 10 miles of a casino, such as Joliet, Elgin,
Peoria, and Rock Island. VGT development is very limited around Aurora, the City of East St.
Louis has opted out, and Metropolis consists of a total of just 20 machines in the City only,
surrounding jurisdictions having opted out. Spend is higher for the 10 miles surrounding the
Rivers casino in Des Plaines because jurisdictions in the inner 5 miles or so have opted out and
the only VGT development is on the edges of the 10-mile ring.
Illinois VGT Penetration: Casino Markets
WPU VGTs per Spend per
1,000 capita
gamers
Chicago Area
Des Plaines $145 2.91 $155
Joliet $104 3.08 $117
Elgin $128 2.09 $98
Aurora $107 1.33 $52
St. Louis Area
Alton $88 5.97 $192
East St. Louis $104 4.99 $190
Other
Peoria $97 4.28 $97
Metropolis $166 4.41 $268
Rock Island $85 3.50 $108
Source: Illinois Gaming Board; IXPRESS/Nielsen Claritas; The Innovation Group
Based on 10-mile rings for population and VGT operations
These statistics support the premise that VGTs are very much a convenience option and tend to
perform better as casino alternatives become less convenient.
Impact on Casino Revenue
The VGT statistics to date clearly show that there is cross-over with the casino industry. This is
further borne out by an assessment of slot revenue trends at Illinois casinos. The casinos that
face the most VGT development in their local markets—such as Peoria and Joliet—have
experienced greater cannibalization than casinos in comparable markets—such as, respectively,
The Innovation Group Project #028-16 May 2016 Page 8Metropolis and Rivers. Looking at 2015, slot revenue at Harrah’s Metropolis and Rivers
declined by less than 1% compared to 5.1% at Par-a-Dice and 2.7% at the two Joliet properties.
Illinois Casino Trends 2015
Slots Tables Slot Decline VGT increase
2015*
Par-a-Dice Peoria -5.1% 0.8% -$4,117,217 $6,607,681
Joliet Combined -2.7% -3.8% -$7,415,562 $7,645,539
Aurora -4.1% -7.1% -$4,506,381 $3,300,779
Grand Vic Elgin -3.3% 23.9% -$4,711,455 $10,767,330
Rivers Des Plaines -0.7% 1.5% -$2,048,736 $19,074,041
Casino Queen E St Louis -7.0% 6.7% -$6,668,690 $5,588,518
Argosy Alton -4.7% 17.8% -$2,505,113 $1,871,431
Jumers Rock Island -0.5% 6.4% -$321,348 $2,687,820
Harrah’s Metropolis -0.3% 13.2% -$176,697 $440,521
Total -2.9% 2.1% -$32,471,199 $57,983,660
Source: Illinois Gaming Board. *Over 2014, within 10 miles of the casino.
Comparing pre- and post-VGT periods, slot revenue at all casinos except Rivers has declined by
between 14% and 25%. Metropolis has been excluded since it was impacted by the opening of
the Isle of Capri casino in Cape Girardeau, Missouri, which had its first full month of operation
in November 2012.
Illinois Casino Slot Revenue: Before and After VGT Development
2012 2015 Decline % decline
Par-a-Dice Peoria $102,186,000 $76,190,605 -$25,995,395 -25.4%
Joliet Combined $308,915,000 $267,031,190 -$41,883,810 -13.6%
Aurora $132,812,000 $104,467,989 -$28,344,011 -21.3%
Grand Vic Elgin $177,317,000 $136,008,168 -$41,308,832 -23.3%
Rivers Des Plaines $305,489,000 $297,769,862 -$7,719,138 -2.5%
Casino Queen E St Louis $116,103,000 $89,000,715 -$27,102,285 -23.3%
Argosy Alton $67,566,000 $51,035,420 -$16,530,580 -24.5%
Jumers Rock Island $81,851,000 $70,428,343 -$11,422,657 -14.0%
Total $1,292,239,000 $1,091,932,292 -$200,306,708 -15.5%
Source: Illinois Gaming Board.
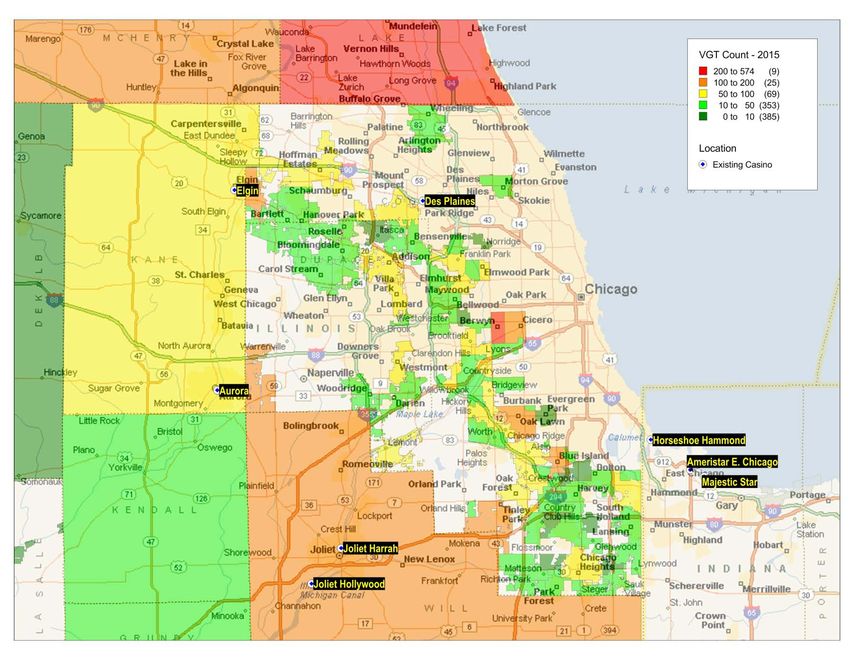
As shown in the map below, VGT development in the Rivers market area has been limited.
Most of the jurisdictions surrounding Rivers have opted out, including the important feeder
market of Chicago. Therefore, Rivers has been excluded from subsequent analysis. The map
also shows that VGT development in the suburbs to the southwest of Chicago—important feeder
markets for the Joliet casinos—has been relatively light or prohibited. VGTs are prohibited in
Orland Park and unincorporated Cook County. Therefore, the Joliet impact of 13.6% is skewed
low by the fact that many of its customers are unaffected by VGT development. It would be
defensible to exclude Joliet from the impact analysis altogether, but out of an abundance of
caution it has been included since its host market has seen extensive VGT development.
The Innovation Group Project #028-16 May 2016 Page 9Chicago Area VGT Development The Innovation Group Project #028-16 May 2016 Page 10
In contrast to slot trends, table revenue has generally been on an upward trend, although Peoria
and Joliet have experienced small declines. The one outlier is Aurora, which has seen a 12%
drop in table revenue. Therefore, Aurora has been excluded from subsequent analysis since it
appears that slot revenue is being impacted by factors other than VGT development.

                      Illinois Casino Table Revenue: Before and After VGT Development
                                                  2012               2015             Decline   % decline
           Par-a-Dice Peoria                $14,121,000        $13,757,586          -$363,414      -2.6%
           Joliet Combined                  $44,981,000        $44,205,599          -$775,401      -1.7%
           Aurora                           $18,918,000        $16,665,129        -$2,252,871     -11.9%
           Grand Vic Elgin                  $34,985,000        $35,405,827           $420,827       1.2%
           Rivers Des Plaines              $111,034,000       $127,099,819        $16,065,819      14.5%
           Casino Queen E St Louis          $15,083,000        $15,826,027           $743,027       4.9%
           Argosy Alton                      $3,384,000         $3,533,699           $149,699       4.4%
           Jumers Rock Island                $5,986,000         $6,282,921           $296,921       5.0%
           Total                           $248,492,000       $262,776,607        $14,284,607       5.7%
                Source: Illinois Gaming Board.

For the slot impact, removing Aurora and Rivers results in an average decline of slot revenue in
Illinois of 20.7%.

                                  Illinois Casino Slot Revenue, Adjusted Sample
                                                                             % decline
                                       Par-a-Dice Peoria                       -25.4%
                                       Joliet Combined                         -13.6%
                                       Grand Vic Elgin                         -23.3%
                                       Casino Queen E St Louis                 -23.3%
                                       Argosy Alton                            -24.5%
                                       Jumers Rock Island                      -14.0%
                                       Average                                 -20.7%
                                                 Source: Illinois Gaming Board.

It should be noted, however, that other jurisdictions, particularly in 2013 and 2014, experienced
weak slot performance because of lingering economic conditions and an aging customer base. A
number of markets unaffected by cannibalization experienced declines in 2013 and 2014,
followed by a rebound in 2015. Because of continuing VGT impacts, Illinois did not benefit by
the 2015 rebound, but a portion of the decline in 2013 and 2014 is properly attributed to other
factors than VGTs. Examining 2015 over 2012 data from control jurisdictions, we estimate that
approximately 3% points of the 20.7% can be attributed to other factors, resulting in an impact of
18% attributable to VGTs.

The Innovation Group Project #028-16                May 2016                                        Page 11
Louisiana Video Gaming Devices (VGDs) As detailed in this section, data from Louisiana shows a 13.5% impact from video poker machines. The VGD industry in Louisiana is limited to video poker, which is an important distinction since this one type of game is of more limited market reach than the VGTs operating in Illinois and proposed for Pennsylvania. In June of 1999, following local parish (county) referenda, video poker was removed from 33 of the state’s 63 parishes, as shown in the following map (parishes without video poker highlighted in yellow). Pertinent to this analysis is the removal of video poker from the Baton Rouge market. VGDs continue to operate in the other commercial casino markets. The Innovation Group Project #028-16 May 2016 Page 12
The Innovation Group Project #028-16 May 2016 Page 13
Historical Trends and Penetration Analysis
Video poker devices in Louisiana may not allow more than four dollars to be placed on a game
or award credits in excess of the value of one thousand dollars. There are three categories of
licenses as follows:

(1) Liquor licensed establishments (consumption on the premises) are limited to three devices.
(2) Truck stop facilities are permitted to operate up to fifty devices, which allows them to
function as mini-casinos. There are currently 199 facilities in this category with an average of 40
devices per.
(3) Offtrack betting facilities (OTBs) and pari-mutuel wagering facilities are permitted an
unlimited number of devices. There are currently 13 facilities in this category with an average of
78 devices per.

As shown in the following table, the majority of revenue and devices are at truck stops.

                                    Louisiana Video Poker Trends
                                   Bars, Hotels           OTBs          Truck Stops          Total
                                             &
                                   Restaurants
               2013                $151,191,278    $41,537,335      $406,780,729      $599,509,342
               2014                $145,422,608    $39,452,265      $406,883,279      $591,758,152
               2015                $139,838,919    $41,923,978      $411,706,941      $593,469,838
               # of Devices 2015          5,199          1,039             8,049            14,288
               WPU 2015                  $73.69        $110.50           $140.14           $113.80
                                       Source: Louisiana State Police

Impact on Casino Revenue
The removal of video poker in East Baton Rouge Parish and parishes to the east offers one of the
few cases where the introduction or elimination of distributed (or ambient) machines (in this case
video poker) can be seen on the revenues of casino properties. This removal resulted in a
significant revenue increase in the Baton Rouge riverboat market. Video poker continued to
operate in the other commercial casino markets in Louisiana, making Baton Rouge the only
market where the impact of distributed machines can be assessed.

The Baton Rouge market is geographically restricted by the presence of New Orleans to the
southeast, the Mississippi Gulf Coast to the east, Paragon to the northwest, the Amelia Belle,
Cypress Bayou to the southwest, Evangeline Downs to the west and Lake Charles to the west
and Natchez and Vicksburg to the north.

As the following chart shows revenues at Baton Rouge casinos increased dramatically over and
above background revenue growth trends after the elimination of video poker in some of the
surrounding parishes.
Baton Rouge Adjusted Gross Revenue
$200,000,000
$180,000,000
$160,000,000
$140,000,000
$120,000,000 Increase as a result of
elimination of Video
$100,000,000 Poker
$80,000,000
1997 1998 1999 2000 2001 2002
Source: Louisiana Gaming Control Board
We then looked more closely at the pre and post periods in the tables below to better define the
changes that occurred.
Changes in Admissions, Revenue and Win per Admission
Post Ambient Machines at Baton Rouge Casinos
Admissions Adj. Gross Rev Win Per
Admission
Jan-Jun 98 1,311,911 $60,495,584 $46.11
July-Dec 98 1,278,766 $59,765,466 $46.74
Jan-Jun 99 1,312,111 $66,038,791 $50.33
July-Dec 99 1,350,260 $73,275,890 $54.27
Jan-Jun 00 1,422,844 $83,535,632 $58.71
Source: Louisiana Gaming Control Board
Percentage Changes in Admissions, Revenue and Win per Admission
Post Ambient Machines at Baton Rouge Casinos
% change in % change in % change in Win
Admissions Revenue Per Admission
Change Jan-June 98 vs. 99 0.00% 9.20% 9.10%
Change July-Dec 98 vs. 99 5.60% 22.60% 16.10%
Change Jan-June 99 vs. 00 8.40% 26.50% 16.70%
Average Change 7.00% 24.60% 16.40%
Difference from Pre Ambient Machine Trends 7.00% 15.40% 7.20%
Inverse -6.50% -13.30% -6.70%
Source: Louisiana Gaming Control Board
The Innovation Group Project #028-16 May 2016 Page 15The change in admissions, revenues and win per admission in the six month period prior to the
removal of machines versus the same period the prior year establishes underlying trends. We
then looked at the change in each variable for the succeeding two six month periods following
the removal of machines versus the same period the prior year before their removal and took the
average. Since in Illinois we are looking at an inverse situation (i.e. the advent rather than the
removal of machines) we calculated the inverse impact. This resulted in an estimate that the
addition of ambient machines (using Baton Rouge as a surrogate) would result in a 13.3%
decrease in revenues composed of a 6.5% decline in admission and a 6.7% decline in win per
admission.
West Virginia Limited Video Lottery Terminals (VLTs)
West Virginia offers a third example in which ambient machines were introduced after casinos
were established.
Historical Trends and Penetration Analysis
West Virginia casinos opened in 1994 and “limited video lottery” operations began in December
2001. The following two tables show the growth in annual gaming revenues at the racetracks
and the limited ambient machines.
Annual Revenue
Casino VLT vs. Limited VLT
$500
$450
$400
$350
$300
Millions
$250
$200
$150
$100
$50
$0
1998 1999 2000 2001 2002 2003 2004 2005 2006 2007 2008
Mountaineer Wheeling Tristate Charles Town Limited VLTs
Source: West Virginia Lottery
The Innovation Group Project #028-16 May 2016 Page 16Total Annual Revenue
Casino VLT vs. Limited VLT
$1,200
$1,000
$800
Millions
$600
$400
$200
$0
1998 1999 2000 2001 2002 2003 2004 2005 2006 2007 2008
Limited VLTs VLTs at Racinos
Source: West Virginia Lottery
Impact on Casino Revenue
The majority of gamers (>90%) at Mountaineer and Wheeling are from states other than West
Virginia. Tri-State is the only casino located within the center of the state and as such, provides
the clearest comparable of what the potential impact of ambient machines on casinos might be.
West Virginia Gaming Revenues – Northern Panhandle and Tri-State
Northern Panhandle / Tri-State
Mountaineer + Wheeling Island
Calendar Year Gross Terminal % Change Gross Terminal % Change
Revenue Revenue
1998 $57,487,542 $11,145,021
1999 $137,166,851 138.6% $25,713,841 130.7%
2000 $217,147,014 58.3% $38,062,385 48.0%
2001 $299,491,992 37.9% $51,882,685 36.3%
2002 $373,880,212 24.8% $63,302,905 22.0%
2003 $417,759,822 11.7% $68,508,593 8.2%
2004 $447,849,639 7.2% $66,096,622 -3.5%
2005 $452,068,655 0.9% $65,477,695 -0.9%
2006 $459,562,944 1.7% $63,254,632 -3.4%
2007 $424,761,452 -7.6% $67,183,680 6.2%
Source: West Virginia Lottery
Limited video lottery machines began operation in 2002. As can be seen in the table above while
casino revenues had been growing at an impressive, though declining rate prior to 2002 much of
this can be attributed to the growth of the industry and the development of the properties in
questions. These declining growth rates are typical of a developing and maturing casino industry
as it adds positions. After 2002 when limited video lottery machines began operation (although
it should be noted that a large number of machines were in existence prior to 2002 as “grey area”
The Innovation Group Project #028-16 May 2016 Page 17machines) revenues continued to slow, with Tri-State revenues actually declining in 2004. In comparison revenues for the properties in the Northern Panhandle remained on a positive growth trend, albeit at a significantly reduced rate, until 2007 when they realized their first decline as a result of the opening of competing casinos in western Pennsylvania. In the Panhandle the majority of the natural market lies in surrounding states and would be unaffected by the development of ambient machines in West Virginia. Tri-State’s market however lies largely within West Virginia and would be expected to show a greater impact from the advent of limited video lottery machines in West Virginia. This, as the table above shows, was largely the case. Disproportionate changes in the rate of revenue growth/decline between Tri-State and the Northern Panhandle properties did not materialize until 2004. From 2004 through 2006 Tri-State saw revenues decline while the Northern Panhandle properties saw dramatically reduced growth rates. As the following table shows this delayed reaction is due largely to the growth of the limited ambient machines market. Between 2002 and 2006 the limited ambient machines market grew almost threefold. The Innovation Group Project #028-16 May 2016 Page 18
Limited Ambient Machines Revenues
                                                               Revenues
                                        2002                 $132,150,000
                                        2003                 $207,200,000
                                        2004                 $288,384,755
                                        2005                 $336,215,083
                                        2006                 $383,238,917
                                        2007                 $403,714,904
                                        2008                 $413,293,326
                                   Source: West Virginia Lottery

Two conclusions can be drawn from the West Virginia example which supports the case for a
negative impact on casino revenues from ambient machines. If ambient machines are held to
negatively impact casino revenues then it would be expected that Tri-State would experience the
greatest impact as the geography of its market would expose it to the greatest potential impact.
This in fact was the case. Second, it would be expected that the decline of casino revenues would
increase as the limited ambient machines market developed and ambient machines revenues
grew. This too also proved to be the case. Due to other extraneous factors relating to the both
the development of the West Virginia casino properties and growth in the limited ambient
machines market throughout this period frustrates any quantitative estimation of the potential
impact.

The Innovation Group Project #028-16           May 2016                           Page 19
VGT IMPACT ON PENNSYLVANIA CASINOS
In order to provide a future baseline for the analysis it is necessary to look at the recent trends in
slot revenue for the state as whole, as well as regionally. In Pennsylvania, most of the casino
properties can be divided amongst the eastern and western portions of the state. However, for
this analysis we looked more specifically at the regions around Philadelphia, Pittsburgh and the
Northeast to gain a better perspective of market trends. The two remaining properties, Presque
Isle and Penn National Harrisburg, were analyzed separately as they are isolated properties
primarily influenced by markets outside state boundaries.
Historical Trends
Since the first two Pennsylvania casinos opened in late 2006, commercial gaming rapidly
expanded across the state. Within five years, eight new properties were open in different
markets and the total number of slots in the state doubled, reaching 26,500 machines in 2011.
Since then, Total Annual Revenues from these properties have exceeded $3 billion, despite
fluctuations following the recessionary years.
Although table revenues continue to grow annually, slot revenues for the state peaked in 2012,
followed by two consecutive years of decline. The following graph shows statewide trends since
the first full year of operations occurred in the state. With no new properties opening, last year
was the first real sign of recovery for slots gaining $47 million in revenue, an increase of 2%
from 2014. However, these gains were not equally dispersed across markets as some properties
continue to lag behind in recovery.
Pennsylvania Slot Trends
$3,000
2007- 2015 30,000
$2,500 25,000
Millions
$2,000 20,000
$1,500 15,000
$1,000 10,000
$500 5,000
$0 0
2007 2008 2009 2010 2011 2012 2013 2014 2015
Revenue Machines
Source: Pennsylvania Gaming Control Board; The Innovation Group
The four casinos located in the Philadelphia metropolitan area comprise the strongest casino
market in the state with an annual growth rate of 1% over the past five years. The bar graph
The Innovation Group Project #028-16 May 2016 Page 20indicates that slot revenues from these properties have exceeded $800 million since 2011, before
Valley Forge had even entered the market. Similar to the state, revenues declined until last year
when the market rebounded after two years of decline. The overall trend indicates that the
market will exceed $925 million by 2020. However, these projections do not include anticipated
revenues or market substitution from the opening of Philadelphia Live! Casino in 2018.
Philadelphia Market Trends
$1,000
Slot Revenues
R² = 0.834
$800
Millions
$600
$400
$200
$0
2009 2010 2011 2012 2013 2014 2015
Valley Forge SugarHouse Harrah's Parx Trendline
Source: Pennsylvania Gaming Control Board; The Innovation Group
Slot revenues from Pittsburgh casinos were not as significantly impacted throughout the
recessionary years and recovery period as other properties in the state. Total annual slot
revenues for the two casinos, Rivers and Meadows, reached $530 million in 2011 prior to Lady
Luck entering the market. Excluding the net gains to the market from Lady Luck, the two
casinos only experienced a combined decline of less than 4% in 2013 and 2014. Total slot
revenues for the market are projected to increase annually by roughly 2% through 2021, reaching
$600 million.
Pittsburgh Market Trends
$600
Slot Revenue
R² = 0.7411
$500
$400
Millions
$300
$200
$100
$0
2009 2010 2011 2012 2013 2014 2015
Nemacolin The Rivers Meadows Trendline
Source: Pennsylvania Gaming Control Board; The Innovation Group
The Innovation Group Project #028-16 May 2016 Page 21The northeastern region is one of the more established markets in the state with two of the oldest
casinos, Mohegan Sun and Mount Airy. Beth Sands is the newest property to the market though
currently has the largest market share of slot revenues (44%). While Mohegan and Mount Airy
continue to lag in slot revenue recovery, Beth Sands Casino saw a 6.6% increase from 2014.
However, in the first quarter of 2016 all properties in this market are showing significant gains,
with the market currently $13 million over the previous year. With these recent trends, revenue
projections for this market are estimated to increase by 2-3% annually for the next five years.
Northeastern Market Trends
$800
Slot Revenue
R² = 0.8168
$700
$600
Millions
$500
$400
$300
$200
$100
$0
2008 2009 2010 2011 2012 2013 2014 2015
Beth Sands Mt Airy Mohegan Sun Trendline
Source: Pennsylvania Gaming Control Board; The Innovation Group
The two individual markets, Presque Isle and Penn National have experienced similar revenue
trends over the past five years with compounding effects from both expanded gaming in external
markets and the lingering recession. In 2015, Penn National saw a slight uptick (0.8%) in slot
revenue from the previous year, however is back down 1.5% in the first quarter of 2016. In
contrast, Presque Isle is up 4.5% in the first quarter from 2015 after five years of straight decline.
As both markets will continue to see impacts from out-of-state developments, neither market is
expected to increase significantly by 2021.
Individual Casino Market Trends
$300
Slot Revenues
$250
$200
Millions
$150
$100
$50
$0
2009 2010 2011 2012 2013 2014 2015
Penn National Presque Isle
Source: Pennsylvania Gaming Control Board; The Innovation Group
The Innovation Group Project #028-16 May 2016 Page 22Baseline Forecast
Using the annual slot revenue trends from the total statewide market we were able to estimate
two trendlines for this analysis. The following graph shows the higher trend approaching $2.8
billion and the lower trend closer to $2.5 billion in 2020.
Total Market Trend
Slot Revenue
$3,000
R² = 0.8073
$2,500 R² = 0.583
$2,000
Millions
$1,500
$1,000
$500
2008 2009 2010 2011 2012 2013 2014 2015 2016 2017 2018 2019 2020
Slot Revenue High Trendline Low Trendline
Source: Pennsylvania Gaming Control Board; The Innovation Group
Using the combined market projections and individual property projections, total slot revenues
for the state were forecasted to $2.6 billion in 2020. The following table shows the results of the
three projections.
Pennsylvania Slot Revenue Projections (MMs)
Low Trend Medium Trend High Trend
2015 A $2,365.7 $2,365.7 $2,365.7
2016 P $2,434.3 $2,468.1 $2,510.4
2017 P $2,462.5 $2,510.6 $2,572.4
2018 P $2,489.9 $2,552.0 $2,633.6
2019 P $2,516.7 $2,592.8 $2,694.3
2020 P $2,543.0 $2,633.0 $2,754.7
% Change 8.7% 12.5% 17.7%
Source: The Innovation Group
The 2020 revenue forecast is further adjusted to reflect four developments currently underway in
Pennsylvania and adjacent states: 1) the addition of Philadelphia Live!; 2) SugarHouse’s gaming
and amenity expansion; 3) the Montreign casino development in Monticello, New York, and; 4)
the MGM project in Prince George’s County, Maryland. The addition of a second casino in
Philadelphia and the SugarHouse expansion are estimated in gravity model analyses to slightly
outweigh the negative impacts of Montreign and MGM. The net impact to Pennsylvania is
The Innovation Group Project #028-16 May 2016 Page 23estimated to be $29 million in 2020 dollars.
Pennsylvania Slot Revenue Projection Baseline 2020: Adjusted for New Developments (MMs)
Low Trend Medium Trend High Trend
2020 Adjusted $2,571.9 $2,661.9 $2,783.6
Source: The Innovation Group
VGT Impact
As the Illinois experience has demonstrated, the VGT industry has a relatively long ramp-up
period, as thousands of individual licenses are granted and developers seek out prime
opportunities to fill demand in multiple communities throughout the state. For the purposes of
analysis we have assumed a stabilized year of VGT operation and casino impact of 2020. VGTs
are assumed to begin operation in mid- to late 2017, followed by three full years of ramp up. As
discussed in the Illinois impact section previously, casino slot revenue in affected VGT markets
fell by an average of 20.7% from 2012 to 2015. Discounting background factors other than VGT
development, we estimate that VGTs caused an 18% decline in casino slot revenue.
The following table shows the result of the impact analysis. In the base or medium forecast,
casino slot revenue is estimated to decline by $603 million compared to what otherwise would be
expected for 2020 in the absence of VGT development.
Pennsylvania Slot Revenue Projections (MMs)
Low Trend Medium Trend High Trend
2017 Baseline $2,462.5 $2,510.6 $2,572.4
2020 P with VGT impacts $2,019.2 $2,058.7 $2,109.3
% Impact -18% -18% -18%
2020 P without VGT impacts $2,571.9 $2,661.9 $2,783.6
Impact on Casino Slot Rev 2020 -$552.7 -$603.2 -$674.3
Source: The Innovation Group
The Innovation Group Project #028-16 May 2016 Page 24FISCAL ANALYSIS
Casino State Tax Impact
Unrestricted VGT development across PA will result in significant declines in revenues to four
earmarked programs. Slot machine revenue in Pennsylvania is subject to the following taxes and
distributions:
• Property Tax Relief (34%)
• Local Share Assessment (4%) 1
• PA Economic Development and Tourism Fund (5%)
• PA Race Horse Development Fund (10.5%) 2
The Property Tax Relief program is funded solely by slot revenue. It reduces the property tax
assessed by school districts for homeowners throughout the state. All homeowners are eligible
for their primary place of residence. The Pennsylvania Department of Education distributes the
slot funds among all of Pennsylvania's school districts. Typically, urban school districts—where
there are low property values and high tax rates—receive the most relief.
The Local Share Assessment is designed for host jurisdictions to enhance municipal services
such as police and fire in response to casino development as well as fund capital improvement
projects. In addition, many casinos have individual revenue-based community sharing
agreements on top of the LSA. The proposed VGT legislation provides for no local funding.
The Economic Development and Tourism Fund is a program established to fund community and
economic development projects throughout the Commonwealth.
The Race Horse Development Fund supports a significant agricultural sector in Pennsylvania.
Funds enhance racing purses, which makes Pennsylvania tracks more competitive. A portion of
revenue also goes to the breeding sector. In all, more than 23,000 Pennsylvanians benefit from
the fund, including blacksmiths, breeders, stable hands, track workers, horse trainers, jockeys
and drivers, veterinarians and farmers who produce feed.
The following table shows the decline in funding for these programs estimated to result from
VGT development:
1
The Gaming Board revenue reports show the LSA as 4%; however, $10 million minimums and individual revenue-
based community sharing agreements raise the effective LSA to approximately 6% at most casinos, resulting in a
total effective tax rate of approximately 55% statewide and as high as 56% at individual casinos.
2
The Race Horse Development Fund is determined through a complex formula tied to Category 1 slot revenue but it
has consistently averaged approximately 10.5% since July 2013.
The Innovation Group Project #028-16 May 2016 Page 25Pennsylvania Slot Revenue Tax Impacts 2020 (000s) 3
Low Medium High
Impact on Casino Slot Rev -$552,688 -$603,235 -$674,261
Property Tax Relief -$187,914 -$205,100 -$229,249
Economic Development and Tourism Fund (EDTF) -$27,634 -$30,162 -$33,713
Race Horse Development Fund (PRHDF) -$58,032 -$63,340 -$70,797
Source: The Innovation Group
In the mid-range, Property Tax relief is estimated to decline by $205 million, the EDTF by $30
million, and the PRHDF by $63 million. In the high range, these impacts would be significantly
greater, with Property Tax relief declining by $229 million, the EDTF by $33 million, and the
PRHDF by $71 million.
Lottery Impact
Lottery sales are highly dependent upon operational factors such as new games being introduced,
allowing internet games and sales, and multi-state prize levels. Draw games are particularly
volatile, while instant ticket sales seem to be less influenced by operational factors. Therefore, it
is difficult to isolate the impact of introducing new forms of gaming on lottery sales. This is
particularly true of VGTs, since only a handful of states have distributed or ambient devices. As
shown in the following table, lottery sales in Illinois did decline in FY2014 but that followed two
years of high growth. Total sales increased in 2015 but that growth came solely from instant
tickets, as draw game sales declined.
Illinois Lottery Sales ($MMs)
FY Instant Draw Games Total
2011 1,265 998 2,263
2012 1,623 28.3% 1,054 5.6% 2,676 18.3%
2013 1,768 9.0% 1,073 1.8% 2,841 6.2%
2014 1,757 -0.6% 1,045 -2.6% 2,803 -1.4%
2015 1,822 3.7% 1,020 -2.4% 2,841 1.4%
Source: Illinois Lottery
It should be noted that the Illinois Lottery was turned over to private management beginning
FY2012, a contract which was ultimately cancelled amid controversy, and it is not possible to
isolate the effect of events surrounding this contract from potential impacts that VGTs may have
had. However, other studies have shown that new gaming options can lead to a slowdown in the
growth rate of lottery sales, and impacts in Pennsylvania are possible, especially in regards to
instant ticket sales, which are more similar as a gaming product than draw lotteries and thus
3
Given the $10 million minimum LSA payments, impacts to LSAs were not quantified.
The Innovation Group Project #028-16 May 2016 Page 26estimated to have greater crossover with VGT gaming.
Total lottery sales in Pennsylvania were relatively flat in FY2015; however, instant tickets have
grown at an annual rate of 5.6% since 2006, with even higher growth in the past five years.
Pennsylvania Lottery Sales ($MMs)
FY Instant Draw Games Total
2006 1,588 1,483 3,070
2007 1,704 7.3% 1,373 -7.4% 3,076 0.2%
2008 1,707 0.2% 1,382 0.7% 3,089 0.4%
2009 1,758 3.0% 1,331 -3.7% 3,088 0.0%
2010 1,749 -0.5% 1,317 -1.0% 3,066 -0.7%
2011 1,922 9.9% 1,286 -2.4% 3,208 4.6%
2012 2,139 11.3% 1,346 4.7% 3,486 8.7%
2013 2,305 7.7% 1,395 3.6% 3,700 6.1%
2014 2,445 6.1% 1,355 -2.9% 3,800 2.7%
2015 2,586 5.8% 1,237 -8.7% 3,823 0.6%
CAGR 5.6% -2.0% 2.5%
Source: Pennsylvania Lottery
Conservatively estimating annual growth of 5% for the next five years in a baseline forecast,
sales of instant tickets would rise to $3.3 billion by 2020. If VGT development lowered the
growth rate by just one point in the years 2018 through 2020, transfers to government programs
would decrease by $34 million in 2020 terms. A decrease of two points in the growth rate results
in a loss to government transfers of $67 million. This shows the magnitude of even small
impacts to growth rates on lottery sales.
Pennsylvania Instant Tickets: VGT Impact Estimate ($MMs)
Base: 5% Low Impact: High Impact:
annual 4% annual 3% annual
growth growth 2018- growth 2018-
2020 2020
2016 2,715 2,715 2,715
2017 2,851 2,851 2,851
2018 2,993 2,965 2,936
2019 3,143 3,083 3,024
2020 3,300 3,207 3,115
Sales Differential 93 185
Transfers Differential* 34 67
Source: The Innovation Group; *Note, government transfers average 36% of sales.
The Innovation Group Project #028-16 May 2016 Page 27JOBS ANALYSIS
Casino Employment Impact
In addition to the reduction in local gaming taxes, host communities could be expected to be
impacted by lay-offs at the casinos as a result of declining revenues. In Illinois, discounting
outliers, employment has declined by 13.7% relative to a total GGR decline of 17.8% since
VGTs opened. The Grand Victoria was excluded since it has opened a hotel and thus
employment has gone up and Joliet Empress since employment decreased at a rate twice that of
GGR.
Illinois Employment and Revenue Trends: Casinos Impacted by VGTs
Employment Total GGR Employment GGR % Slot as %
% Change Change of Total
2012 4,104 770,102,000 -1.7% -3.9% 89.3%
2013 3,849 721,786,582 -6.2% -6.3% 87.6%
2014 3,727 662,386,523 -3.2% -8.2% 87.3%
2015 3,541 633,164,461 -5.0% -4.4% 86.6%
2015/2012 (563) -13.7% -17.8%
Employment Impact/Total GGR Impact 77.1%
Source: Illinois Gaming Board
This is similar to what was experienced in Atlantic City as revenues declined from the recession
and impact of Pennsylvania and New York, as shown in the following table:
Atlantic City Employment and Revenue Trends
2006 2007 2008 2009 2009/2007
Borgata
Gaming Revenue $735,145 $748,649 $734,306 $691,428 -7.60%
Casino Employment 2,758 2,620 2,508 2,483 -5.20%
Ratio of Employment/Rev Decline 68.40%
Trump Taj 2009/2006
Gaming Revenue $525,437 $504,090 $476,706 $441,111 -16.00%
Casino Employment 1,641 1,566 1,471 1,438 -12.40%
Ratio of Employment/Rev Decline 77.10%
Source: New Jersey Casino Control Commission
To estimate the impact on Pennsylvania casino employment we applied the 77% ratio to the 18%
slot revenue impact, resulting in an employment impact of 13.86%, as shown in the following
table.
The Innovation Group Project #028-16 May 2016 Page 28Pennsylvania Employment Impact Calculation
A. Slot Rev Impact 18.0%
B. Employment impact relative to total GGR decline 77.0%
C. Impact Applied (A * B) 13.86%
A further adjustment is necessary to account for the fact that we are assessing slot revenue
impacts only and the employment data we are utilizing is total property employment from the
Pennsylvania Gaming Control Board. Given the variability in slot versus table play at the
Pennsylvania casinos, we have applied the slot revenue ratio (as percentage of total GGR) on a
property-by-property basis. Therefore, for example, BethSands is estimated to have a smaller
impact on total property employment since it has the lowest ratio of slot revenue. On a statewide
basis, nearly 1,750 jobs are estimated to be cut at Pennsylvania casinos as a result of VGT
development.
Pennsylvania Employment Impact Results
Pennsylvania casino Employees Job Losses Employment % Employment Slot %
FY 2014-15 after Impact Impact of Total
Mohegan Sun 1,777 201 1,576 11.3% 82%
Parx 1,946 195 1,751 10.0% 72%
Harrah's Philly 1,442 152 1,290 10.6% 76%
Presque Isle 957 119 838 12.4% 90%
Meadows 1,363 165 1,198 12.1% 88%
Mount Airy 1,161 121 1,040 10.4% 75%
PNC 1,048 125 923 11.9% 86%
Beth Sands 2,363 191 2,172 8.1% 58%
Rivers 1,715 189 1,526 11.0% 80%
SugarHouse 1,224 110 1,114 9.0% 65%
Valley Forge 1,063 102 961 9.6% 69%
Lady Luck Nemacolin* 300 71 229 23.5% 85%
Total 16,359 1,741 14,618 10.6%
Source: Pennsylvania Gaming Control Board; *Isle of Capri—the total resort has 1,443 employees, 300 at the casino.
Given its remote location and the de minimis purchase requirement, Lady Luck Nemacolin is a
particularly vulnerable operation. The nearest sizable population base is Uniontown, a 20-
minute drive. The operation of VGTs in Uniontown and other nearby markets such as
Connellsville could put the viability of Lady Luck into question and place all 300 jobs at risk. At
minimum, Lady Luck would likely experience an impact double that of the statewide average,
which is an assumption we have utilized in the analysis above.
The Innovation Group Project #028-16 May 2016 Page 29CONCLUSION
As proposed, VGT development would represent a large expansion of gaming in Pennsylvania,
equivalent to adding 18 casinos but without the same regulatory standards that apply to the
casino industry. VGT operators would not be required to establish and implement a self-
exclusion system for the protection of vulnerable consumers and there would not be a state-
administered self-exclusion system analogous to the one governing casino operations. This,
along with lack of requirements for security and surveillance, would tend to give VGTs a
competitive advantage over casinos and maximize penetration of local markets.
The proposed tax rate for VGTs, 34%, is considerably lower than that levied on casino slot
revenue, 55%, which further enhances the competitive advantage of VGTs. Moreover, a large
portion of VGT development would be expected to occur not at existing bars and restaurants but
rather “café” chains operating primarily as mini-casinos. Nationally established route
operators—companies that operate distributed machine gaming in states such as Nevada,
Montana, and Illinois—have indicated to investors that Pennsylvania is a prime market for
expansion should VGT legislation be enacted.
We estimate that VGT development in Illinois has, over the course of three years, eroded slot
machine revenue at affected casinos by an average of 18%. Casino slot revenue in Pennsylvania
is estimated to decline by between $553 million and $674 million compared to what otherwise
would be expected for 2020 in the absence of VGT development.
The dedicated programs funded by slot revenue—including property tax relief, local payments to
host communities, 4 and economic development projects throughout the state—would experience
significant declines. Assuming the base or medium impact:
• Property Tax Relief -$205,100
• Economic Development and Tourism Fund -$30,162
• Race Horse Development Fund -$63,340
Job losses at casinos—estimated at approximately 1,750—would further affect local economies
by reducing incomes and consumer spending power. Lady Luck Nemacolin is particularly
vulnerable, given its remote location 20 minutes from the nearest sizable population base. The
operation of VGTs in the Uniontown-Connellsville area could put the viability of Lady Luck into
question and its closing would result in 230 additional job losses.
Moreover, there is the risk of negative impacts to lottery sales. We estimate that up to $67
million in lottery transfers to government programs would be at risk by VGT development.
4
Given the $10 million minimum LSA payments, impacts to LSAs were not quantified.
The Innovation Group Project #028-16 May 2016 Page 30You can also read