Permian Basin Workforce Development Board Local Plan Program Years 2021-2024
←
→
Page content transcription
If your browser does not render page correctly, please read the page content below
Permian Basin Workforce Development Board Local Plan
                         Program Years 2021-2024

Introduction
Under the Workforce Innovation and Opportunity Act (WIOA) §108, each Local Workforce
Development Board (Board) is required to develop and submit to the state a comprehensive
four-year plan (Local Plan) that identifies and describes policies and procedures as well as
local activities that are in line with the State Plan. This Local Plan must be developed openly
and be available to the public for comment for at least 15 days, but no more than 30 days,
particularly to members of the business and educational communities as well as various other
labor organizations. Along with submission of the Local Plan to the Texas Workforce
Commission (TWC), the Board must submit all public comments of disagreement with the
plan to TWC.

At the end of the first two-year period, the appropriate chief elected officials (CEOs) and the
Board will review the local plan and prepare and submit modifications to reflect changes in
the labor market and economic conditions, factors affecting the implementation of the plan,
changes in financing, changes to the structure of the Board, and/or the need to revise
strategies to meet local performance goals.

Part 1: Board Vision and Strategies
The strategic elements of the Local Workforce Development Board Planning Guidelines
(Guidelines) are as follows:

A. Vision and Goals

Boards must include a description of the Board’s strategic vision to support regional
economic growth and economic self-sufficiency. The description must include:
   a. goals for preparing an educated and skilled workforce, including early education
       services, and services for youth and individuals with barriers to employment; and
   b. goals relating to the performance accountability measures based on performance
       indicators described in WIOA §116(b)(2)(A).

Board Response
Workforce Solutions Permian Basin is governed by the Permian Basin Workforce Development
Board. PBWDB, composed of 30 members with at least 51% from business, serves as a decision-
making body and provides direction for all workforce programs and activities in the Permian
Basin Workforce Area. In addition, the Board must have at least 15% of its members come from
organized labor and community-based organizations. The remaining members come from adult
basic and continuing education, vocational rehabilitation agencies, public assistance agencies,
educational agencies, economic development, literacy councils, and public employment
agencies. The Board is also required to have a member who has expertise in child care or early
childhood development and a member who is a veteran.

Permian Basin Workforce Board                                                          Page 1 of 69
PBWDB’s mission statement is “investing in the future through jobs and training”. In addition
to the mission statement, the Board has adopted a philosophy, goals and service principles to
guide the design and delivery of workforce development programs and initiatives in the
Permian Basin region. The intent of the Board is to align efforts among workforce development
partners to achieve accessible, seamless, integrated, and comprehensive services where
possible and to strive for quality services to our customers – employers and job seekers.
Philosophy
• PBWDB believes a local community partnership between the public workforce system,
educational organizations, business and industry, economic development, and
community-based organizations is the most effective and resourceful manner to build
and implement solutions for workforce challenges.
• PBWDB delivers quality service while practicing the highest standards of ethics,
accountability to the public, and an efficient use of public resources.
• PBWDB affirms the commitment to assist individuals who assume personal
responsibility for enriching their lives through education, training, and work.
• PBWDB embraces business as the customer and believes communicating its customer’s
needs to future employees, educators, and workforce professionals will prepare our
workforce system for tomorrow’s labor market demands. PBWDB pledges to be flexible
and responsive to the ever-changing needs of the Permian Basin business community.
Goals
By partnering with the community to find innovative solutions, PBWDB can efficiently deliver
quality services to its customers thus paving the way for progress for the Permian Basin
Workforce. These goals emphasize both developing a quality workforce as well as ensuring
performance accountability.
• Partnership: Create partnerships with local businesses, community-based organizations,
elected officials, local educators, and community residents that effectively
communicate, collaborate, and problem solve for the unique needs of the Permian
Basin workforce. These partnerships not only foster community participation in the
workforce development process, but also provide an effective platform for attracting
new industries, improving current businesses, and addressing workforce deficiencies.
• Solutions: Utilize our community partnerships to implement smart solutions and
generate results that continuously upgrade the quality of life in the Permian Basin.
Streamline community resources to prevent duplication of programs. Eliminate barriers
that prevent entry-level and incumbent workers from progressing into higher skilled
jobs and sponsor business creation and expansion.
• Quality: Consistently deliver quality services to businesses, current workers, and job
seekers that ultimately empower the entire Permian Basin community. Implement
growth initiatives that supply new and current industries with their distinct, skilled labor
Permian Basin Workforce Board Page 2 of 69demands. Support entry-level and incumbent workers with the tools needed to obtain
stable and rewarding employment.
• Progress: Share labor market intelligence with employers to plan for future labor
demands. This exchange of qualitative and quantitative data will allow the Board to
assist businesses with developing and maintaining a highly skilled labor force. Motivate
our youth to select definite career paths after high school graduation and teach them
transferable job skills needed to progress through the career pipeline.
• Accountability: Performance measures are understood and inculcated into the
operations of the workforce center system. Standards are exceeded through the
diligent application of the skills, knowledge and abilities of the Board and the workforce
center system contractor in providing quality, effective workforce solutions to
employers and job seekers.
Common Service Principles
PBWDB identified three Service Principles for delivery of services.
• All customers (employers and job seekers) will receive prompt service.
• All customers regardless of location will be provided uniform high-quality service.
• State and federal performance measures will be met.
Employer Service Goals
PBWDB identified the following goals to continuously meet employer needs.
• The Workforce Solutions system must be recognized as a reliable and consistent
resource for businesses, based upon positive customer satisfaction and performance
excellence, to address and meet their employment needs.
• Access to the Workforce Solutions office services is easily available regardless of the
employer’s location.
• Dependable high-quality services are delivered by providing a skilled workforce through
effective job matching which includes utilizing WorkinTexas.com and other resources.
Job Seeker, Current Employees, and Youth Service Goals
PBWDB identified the following goals to meet job seekers and current employees’ needs.
• The Workforce Solutions offices are recognized as the resource place for job seekers,
based upon reputation for customer satisfaction and performance excellence,
regardless of the job seeker’s skills and educational achievement.
• Access to the Workforce Solutions services is easily available regardless of the office
location.
Permian Basin Workforce Board Page 3 of 69• Dependable high-quality services are delivered to meet the labor market needs of job
seekers, current employees, and youth by providing effective job matching which
includes utilizing WorkinTexas.com and other resources.
• Coordinate with businesses, economic development, community-based organizations,
and public entities to maximize resources and avoid duplication of service.
• Collaborate with educational institutions to ensure available training resources are
made known to job seekers as they seek to improve their job skills, leading to high wage
and high growth occupation.
• Coordinate planning and service delivery with child care providers and early education
services to promote quality child care and child development in the region.
B. Board Strategies
Boards must include a description of the Board’s strategy to work with the entities carrying
out the core programs and with the required partners to align resources available to the
local workforce development area, to achieve the vision and goals.
Board Response
Services are provided through a region wide workforce center system providing ready access to
all services and programs funded through the Texas Workforce Commission. Partner agencies
have representatives within the workforce centers or are easily reached by phone or email to
assist in coordinating services to our mutual customers. The Board oversees the operation of
the workforce center system by selecting a workforce center management entity to direct staff,
the workforce centers, and operate the programs available to customers. The workforce center
operator is selected through a competitive procurement process described in Part 7, item
number B.
The Board partners with employers, community colleges, chambers of commerce and economic
development, independent school districts, and community-based organizations to provide
workforce development opportunities to job seekers and employers in the Permian Basin.
Coordination with Core Partners and Programs
• Youth. Included in WIOA are youth programs that assist at-risk in-school and out of
school youth with programs to encourage them to stay in school, return to school, and
acquire work maturity skills to enhance their ability to become employed through work
internships or work experience within the public and private sectors.
• WIOA Adult Employment and Training, Dislocated Workers and Employment Services.
Providing citizens with access to job search assistance, occupational skills training,
assessment and testing, case management, support services to encourage
participations, placement services and follow up to ensure continued success in the
Permian Basin Workforce Board Page 4 of 69placement. Employers may place job orders through WorkInTexas.com or by contacting
the individual centers.
• Adult Education and Literacy. Workforce development customers are assessed for
literacy and reading skills. Workforce Solutions staff refer customers in need of literacy
or remediation services to the Adult Education and Literacy service providers.
• Vocational Rehabilitation (VR). The integration of VR into the workforce center system
has allowed close communication and referral of shared customers for services to
enhance the employability of disabled job seekers. VR staff are co-located in the Fort
Stockton Workforce Solutions Office. VR staff from Midland travel to the Workforce
Solutions Office in Big Spring approximately once a week. VR staff in Odessa and
Midland are housed in the HHSC offices in each city. Plans are in place to co-locate VR
staff in the Odessa and Midland Workforce Solutions offices in 2021.
• Child Care. Child care services are available through the workforce center system to
assist families to attain self-sufficiency and/or to participated in workforce development
programs. Child care services also promote quality child development, early childhood
education, and school readiness.
• Apprenticeship. The Board is committed to supporting apprenticeship programs in the
Permian Basin region. The Board will also work with neighboring Workforce
Development Areas (WDA) to expand the opportunities for apprenticeship as an added
training option in the greater West Texas region.
• Temporary Assistance for Needy Families (TANF)/Choices and Supplemental Nutrition
Assistance Program Employment and Training Program (SNAP E&T). Programs are for
individuals receiving public assistance whether TANF or SNAP are provided employment
assistance, community service employment, and case management provided by the
workforce center system staff. Programs are coordinated with the local Texas Health
and Human Services.
• Veterans. Veterans are a priority service group for workforce development services.
Services are coordinated with representatives of the Texas Veterans Commission to
ensure customers received the services they need to transition to self-sufficiency.
• Senior Community Service Employment Program. Seniors receive workforce
development services in coordination with the Senior Community Service Employment
Program contractor. AARP.
Coordination with Employers
• Employers provide information about labor demands, skills deficiencies, and economic
trends, which is utilized by the Board in workforce development decisions. In turn, the
Permian Basin Workforce Board Page 5 of 69Board communicates this information to community colleges to ensure students are
receiving relevant and applicable job skills in the classroom.
• Employers provide jobs, which feed the local economy.
• The Board facilitates skills training to job seekers, so employers have the skilled labor
that meets their need for skilled qualified workers.
• The Board identifies the needs of employers for skilled workers and seeks ways to meet
that need in coordination with its partners.
• The Board reviews customer feedback to improve quality of service and responsiveness
to employers and job seekers. The Board’s partners market the Permian Basin to
potential residents and employees.
Coordination with Community Colleges and Universities
• The Board tailors the Targeted Industries and Occupations list to identify jobs in demand
now and in the future. The Board networks with employers to gain local wisdom for
these lists and for course curriculum.
• Community Colleges provide training for targeted occupations while the Board refers
customers and provides WIOA funding to eligible customers.
• The partners work to improve the regional skilled labor supply. Both contribute to the
selection of workforce courses offered by colleges to ensure current and future workers
are learning applicable skills relevant in today’s marketplace.
• The Board and Colleges work on grants that improve literacy training, workforce
training, including collaborating for Skills Development Grans. The partners contribute
to the funding, grant preparation and fulfillment of grant requirements.
Coordination with Chambers of Commerce and Economic Development
• The Chambers of Commerce and the Board serve as prime contributors to business
development for the Permian Basin and act to diversify the region’s economy by
expanding business growth opportunities and workforce development.
• Chambers promote a positive business community, market the cities and region to
prospective businesses, and promote economic development, tourism, and numerous
other community organizations.
• The Economic Development sectors of the Chambers are the primary contact for
prospective businesses. Economic Development assists the Board by providing access to
regional employers and employers considering locating to the region. The Board assists
Permian Basin Workforce Board Page 6 of 69with economic development by providing funds for workforce training and business
services.
• Chambers and the Board collaborate to find solutions for workforce deficiencies and to
promote the quality and quantity of regional skilled labor. Chambers help the Board
identify regional training needs for the purpose of the targeted Industries and target
occupations list.
Coordination with Community Based Organizations (CBOs)
• CBOs assists the Board by distributing information about workforce and child care
services to their participants and partners. If the workforce system does not provide
specific services, the Workforce Solutions staff acts as a broker and refers
customers/participants to CBO partners.
• As the parent agency for 2-1-1 Texas Permian Basin, the Board collaborates with CBOs
to collect, maintain, and disseminate information to callers seeking assistance with
workforce services and social services.
• CBOs assist individuals needing to transition into the workforce by providing unique
services that the workforce system does not provide, such as courses in life skills, GED
preparation, literacy, English as a Second Language, and other services such as
counseling, food and clothing, and work experience opportunities.
Coordination with Independent School Districts
• ISDs are responsible for ensuring students are prepared for the workforce after
graduation. The Board assists with work experience and with helping build work
maturity skills in youth, offers career descriptions and information about the high-
demand, high-wage occupations for this region, and shares the targeted occupations list
as the Career and Technology departments develop their instructional programs.
• Both partners assist with providing services, such as child care, to students with children
as a measure to prevent students from dropping out of school and joining the workforce
as unskilled labor.
• Both partners to network with other community organizations to market youth to stay
in school and pursue a rewarding career.
C. High-Performing Board
(WIOA §108(b)(18); 20 CFR §679.560(b)(17))
Boards must include a description of the actions the Board will take toward becoming or
remaining a high-performing Board, consistent with the factors developed by the Texas
Workforce Investment Council (TWIC).
Permian Basin Workforce Board Page 7 of 69Board Response
The Permian Basin Workforce Board will take the following actions to remain a high-performing
workforce development board.
• Continue to recruit quality Board members, who reflecting the major industries in the
Permian Basin who possess the knowledge and understanding of the workforce needs in
the WDA.
• Hire quality Board staff with great leadership, vision, communication skills and flexibility.
• Contract with an organization who can work with Industry, Community Based
Organizations, Economic Development Corporations, Colleges, ISDs, and other advocacy
groups to deliver workforce development services effectively and efficiently in the WDA.
• Build strong local partnerships to make sure we are operating an effective and efficient
workforce system.
• Ensure a sound, effective and appropriate fiscal management system and key control of
the funds allocated to the Permian Basin.
• Strive to exceed all performance measures.
• Maintain an enhanced quality assurance process both for the Board and its contractors.
Part 2. Economic and Workforce Analysis
A. Regional Economic and Employment Needs Analysis
Boards must include a regional analysis of the following:
• The economic conditions, including existing and emerging in-demand industry
sectors, in-demand occupations, and targeted occupations.
• The employment needs of employers in existing and emerging in-demand industry
sectors, in-demand occupations, and target occupations.
As appropriate, a local workforce development area (workforce area) may use an existing
analysis, provided that it is recent and provides a current and accurate description of the
regional economy.
Board Response
The Permian Basin Workforce Development Area is located in West Texas. The region includes
seventeen counties: Andrews, Borden, Crane, Dawson, Ector, Gaines, Glasscock, Howard,
Loving, Martin, Midland, Pecos, Reeves, Terrell, Upton, Ward and Winkler counties. The region
extends 250 miles wide and 300 miles long and consists of 23,484 square miles with a
population density of 17.79 per square mile compared to the Texas state average of 95.92 per
square mile. The Permian Basin is a sedimentary basin largely contained in the western part of
Permian Basin Workforce Board Page 8 of 69the state of Texas. It is so named because it has one of the world’s thickest deposits of rocks
deposited from the Permian geologic period.
Although it is structurally a basin in the subsurface, much of the basin lies under the Llano
Estacado and the northwestern portion of the Edwards Plateau, which are topographically high.
On the west and south it extends across the Pecos River valley to mountain ranges in both New
Mexico and West Texas. The southernmost county, Terrell, borders the country of Mexico along
the Rio Grande River.
Because of good grasslands, most of the Permian Basin was inviting to both ranchers and
farmers in the early days of settlement. Since surface water was almost nonexistent (0.1
percent compared to 2.5% statewide), ranchers and farmers drilled water wells to sustain
themselves and their livestock and they often found evidence of oil or gas. Several oilfields
were discovered in Upton and Crane counties in 1925, as a result of random drilling or surface
and subsurface mapping.
Today, the Permian Basin is a large oil and natural gas producing area and, is considered a part
of the Mid-Continent Oil Producing Area. The Permian Basin is among the most important oil-
producing regions in the world. Drilling and production and the necessary supporting industries
generate business activity not only in the region, but across the state and the nation. A
Perryman Group report 1 estimates that under normal market conditions such as those
prevailing in 2019, the total economic benefits to Texas associated with oil and gas activity in
the Permian Basin are estimated to include over $163.8 billion in gross product each year and
almost 1.4 million jobs. These amounts represent about 10% of the Texas economy. For the US,
oil and gas activity in the Permian Basin leads to economic benefits of an estimated $187.2
billion in gross product each year and more than 1.5 million jobs.
The top three industries in the Permian Basin are Natural Resources and Mining (19.8% of
employment or 42, 188 employees), Trade, Transportation and Utilities (22.3% or 47,445
employees) and Education and Health Services (19.9% or 35,904 employees). Leisure and
Hospitality (9.5% or 20,191)) and Construction (8.2% or 17,509) combined make up 17.7% of
total employment with 37,700 employees. The decline in oil and gas demand coupled with the
shutdown of much of the economy due to the pandemic has greatly affected all Permian Basin
industries. Layoffs have rippled across all parts of economy.
The Pandemic
Obviously, the rapid decline in energy demand has magnified the effects of COVID-19 in the
Permian Basin. In the midst of the oil market turmoil, unfavorable comparisons to the 1980s oil
bust are inevitably being drawn. However, the current situation is completely different. In the
1980s, prices fell and did not recover for an extended period of time due to massive structural
1
Keep it Together! Preserving the Permian Basin Energy Sector and the Odessa Economy through the COVID 19
and Related Oil Market Challenges. May 2020
Permian Basin Workforce Board Page 9 of 69problems in the market, Cold War geopolitics, and a weak economy (from the savings and loan
and real estate collapse) which exacerbated a growing oversupply situation. By contrast, the
current situation is caused by a health crisis that rapidly shuttered much of the world economy.
There were no major structural problems prior to COVID-19, and once the economy can reopen,
a substantial portion of global oil consumption should resume quickly. In fact, with the recent
OPEC++ agreement and the related effects of bringing fewer wells online in the US and
elsewhere, only about half of the lost demand must be restored to facilitate a more orderly
market.
Recovery of oil prices is particularly critical to the Permian Basin. As the global economy begins
to recover from COVID-19 restrictions and travel prohibitions, oil markets can normalize
expeditiously. Prices should recover to sustainable levels for West Texas producers (where costs
were falling notably for years before the pandemic) in the next few months. The forecast for the
Midland metropolitan area calls for significant losses this year of an estimated 18,100 jobs and
$11.1 billion in output (real gross domestic product). However, some recovery is expected once
the worst virus issues have passed and oil markets begin to recover, with the addition of a
projected 11,500 jobs in 2021 (a 12.08% gain) and $8.3 billion in output (30.14% growth).
The Perryman Group: The Economic Outlook for Texas and the Midland MSA: Projected Recession and
Recovery from COVID-19. April 2020
Permian Basin Workforce Board Page 10 of 69The wage and salary information in the table below presents a snapshot of the impact of
layoffs across industry sectors.
The Odessa Economic
Development Department
noted in its Odessa Economic
Index of September 2020:
“Employment recovery has largely
stalled – the gains that would
come from reopening the
economy after the April lockdown
have been offset by the sharp
downward pressure coming from
the reeling oil and gas
sector. Total employment in the
Odessa metro area remains down
by double-digit percentage points
compared to year-ago levels and
the unemployment rate spiked
upward in September.
Oil and gas job loss has
intensified, and in fact updated
data suggests industry job loss
within the Odessa metro area is
more severe than had been
previously reported. Through
September close to 50% of the
direct oil and gas jobs in place in
Odessa in the second quarter 2019
have been eliminated, from over
14,200 jobs in May 2019 to an
estimated 7,650 jobs in September
2020.
In both Midland and Odessa,
combined oil and gas employment
nearly 18,700 jobs have been lost,
a decline of over 40% since the
second quarter 2019. Most of that
job loss occurred in 2020, however, with an estimated 16,300 jobs eliminated just since
February of this year.”
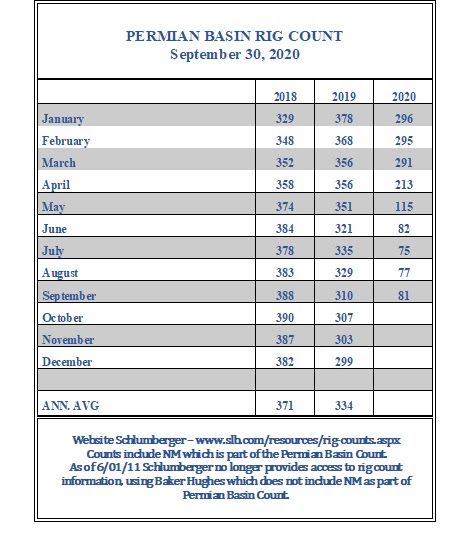
Permian Basin Workforce Board Page 11 of 69The Permian Basin Rig count for September 2020 shows the significant reduction in rig activity.
One of the fallouts of the contraction in the industry is that smaller producers are being bought
out by major players. While this trend will lead to continued decline in employment, there is a
potential for increased efficiency of operations. A Houston Chronicle article in the December
23, 2020 edition of the Midland Reporter-Telegram reported that:
“More layoffs are hitting the Oil and Gas Industry as energy companies consolidate to
help weather the worst oil bus in decades caused by the coronavirus pandemic. The new
wave of mergers and acquisitions will leave behind a smaller industry employing fewer
workers as combined companies cut redundant positions.”
There are signs that the Oil and Gas industry is beginning to rebound. Oil prices have risen from
a low of $21.04 per barrel in April 2020 to $42.30 per barrel in November 2020. After losing
more than 80,000 jobs from December 2018 to August 2020, jobs have been slowly coming
back. The Midland Reporter-Telegram reports the oilfield services and equipment sector
employment rose by 2,665 jobs in November 2020, the third consecutive monthly increase. “It
will be a long climb back to the levels seen in December 2018, if those levels are ever reached
again”. 2
2
Karr Ingram, Petroleum Economist, Texas Alliance of Energy Producers, Midland Reporter-Telegram Dec. 19, 2020
Permian Basin Workforce Board Page 12 of 69The economic effects of the COVID-19 virus have been felt across the Permian Basin region.
Employment by Industry in the 2nd Quarter of 2020 has declined significantly across all sections.
The Table below indicates the quarterly and year to date change in employment across the
major industries. No industry has been spared the effects of the shrinking economy resulting in
business closures and layoffs. The top five industries for Unemployment Insurance claims as of
December 2020 are:
1. Support activities for oil and gas operations
2. Oil and gas pipeline construction
3. Full-service restaurants
4. Food service contractors
5. Limited-service restaurants
Employment by Industry
(2nd Quarter 2020, Percent Change)
% Quarterly % Yearly
Industry Employment % of Total
Change Change
Natural Resources and
42,188 19.8% -24.2% -29.0%
Mining
Construction 17,509 8.2% -16.3% -22.9%
Manufacturing 9,165 4.3% -14.4% -21.1%
Trade, Transportation
47,445 22.3% -10.6% -11.5%
and Utilities
Information 1,397 .07% -36.8% -40.7%
Financial Activities 9,728 4.6% -8.6% -5.3%
Professional and
15,402 7.2% -12.8% -10.1%
Business Services
Education and Health
35,904 16.9% -7.4% -3.9%
Services
Leisure and
20,191 9.5% -18.5% -20.6%
Hospitality
Other Services 6,275 3.0% -11.7% -15.5%
Public Administration 7,358 3.5% -1.6% -3.8%
Source: TWC LMI October 2020
There is general agreement that once the virus’ effects have been eliminated through public
health efforts and vaccinations, federal and state assistance to employers will help create a
recovery in 2021. The Perryman Group’s projection for wage and salary employment for the
Midland MSA is a good indication for the Permian Region that economic recovery should occur
in 2021.
Permian Basin Workforce Board Page 13 of 69The Permian Basin Comprehensive Economic Development Strategy (CEDS), published by the
Permian Basin Regional Planning Commission in 2015, captures the essence of the Permian
Basin Economy that is still true six years later:
Economic development in the region, however, is challenging. Oil and gas prices are
subject to a range of external pressures including foreign production and demand,
economic cycles, regulatory policy, tariffs, weather, etc. The resultant volatility has led to
a boom-‐bust cycle of economic activity for the region that is challenging at both its
highs and lows -‐ taxing capacity on the high side and challenging maintenance on the
low. Fierce competition for labor to supply workforce demands during booms has
resulted in significant wage pressures and high labor costs that impact all industries.
Likewise, influxes of labor to supply industry during periods of high-‐production activity
has resulted in housing demand exceeding supply, particularly for multi-‐family and
temporary housing. This excess of demand inflates housing costs for all residents of the
Permian Basin, a challenge not easily tackled when building housing stock to meet peak
demand risks a glut of housing with high maintenance costs during down-‐ cycles. Such
upward wage pressures also have deleterious effects not only on business, but on the
community and quality of place as well. These factors have become impediments to
recruitment of teachers, peace officers, and other public servants in the Permian Basin
region.
Permian Basin Workforce Board Page 14 of 69In-Demand Industries The table on the next page presents the industries that are projected to add the most jobs in the next eight years. These projections on in-demand industries and occupations were provided by the Texas Workforce Commission prior to the COVID-19 pandemic. Consequently, the true fallout of the virus has not been taken into account in these projections. Still, it can serve as a base of understanding to determine what might occur in terms of job growth once the pandemic is no longer a factor. Permian Basin Workforce Board Page 15 of 69
Permian Basin - Industries Adding the Most Jobs
                                                                                        Annual Average      Annual Average      Number Change 2018-    Percent Change 2018-
    Industry Title                                                                      Employment 2018     Employment 2028     2028                   2028
    Total, All Industries                                                                           264,412             306,317                 41,905                    15.8
    Support Activities for Mining                                                                    39,567              50,607                 11,040                    27.9
    Restaurants and Other Eating Places                                                              17,794              23,914                  6,120                    34.4
    Rental and leasing services (5322, 5323, and 5324 only)                                           3,622               5,536                  1,914                    52.8
    Other Specialty Trade Contractors                                                                 3,821               5,679                  1,858                    48.6
    Utility System Construction                                                                       6,911               8,276                  1,365                    19.8
    Management, Scientific, and Technical Consulting Services                                         1,976               3,289                  1,313                    66.4
    Oil and Gas Extraction                                                                           11,555              12,793                  1,238                    10.7
    Machinery, Equipment, and Supplies Merchant Wholesalers                                           6,468               7,524                  1,056                    16.3
    General Medical and Surgical Hospitals                                                            6,881               7,797                    916                    13.3
    Building Equipment Contractors                                                                    5,163               6,040                    877                    17.0
    Merchant wholesalers, nondurable goods (4241, 4247, and 4249 only)                                1,849               2,632                    783                    42.3
    Traveler Accommodation                                                                            3,077               3,785                    708                    23.0
    Merchant wholesalers, nondurable goods (4242 and 4246 only)                                       2,013               2,720                    707                    35.1
    Merchant wholesalers, durable goods (4232, 4233, 4235, 4236, 4237, and 4239 only)                 2,214               2,896                    682                    30.8
    Local Government, Except. Education & Hospitals                                                   6,964               7,618                    654                     9.4
    Automotive Parts, Accessories, and Tire Stores                                                    1,341               1,870                    529                    39.4
    Offices of Physicians                                                                             2,277               2,783                    506                    22.2
    Automobile Dealers                                                                                2,085               2,523                    438                    21.0
    Automotive Repair and Maintenance                                                                 2,138               2,543                    405                    18.9
    Machine Shops; Turned Product; and Screw, Nut, and Bolt Manufacturing                             1,138               1,539                    401                    35.2
    Elementary and Secondary Schools                                                                 13,540              13,824                    284                     2.1
    Machinery manufacturing (3331, 3332, 3334, and 3339 only)                                         3,005               3,287                    282                     9.4
    Building Material and Supplies Dealers                                                            1,596               1,875                    279                    17.5
    Other Amusement and Recreation Industries                                                         1,529               1,799                    270                    17.7
    Foundation, Structure, and Building Exterior Contractors                                          1,150               1,410                    260                    22.6

    In-Demand Occupations
    The table on the following two pages presents a list of occupations projected to add the most jobs over the next eight years, as
    determined by the Texas Workforce Commission’s projections. Annual average employment for 2018 is compared to projected
    annual average employment for 2028.

Permian Basin Workforce Board                                                                                   Page 16 of 69
Standard Occupational
Classification (SOC) or Annual Average Annual Average Number Change Percent Change Annual Change in
In-Demand Occupation Job Title (Name)
Occupational Information Network Employment 2018 Employment 2028 2018–2028 2018–2028 Employment (Growth)
(O*NET) Job Code
53-3032 Heavy and Tractor-Trailer Truck Drivers 12,058 15,888 3,830 31.8% 383
Combined Food Preparation and Serving Workers,
35-3021 Including Fast Food 7,057 9,847 2,790 39.5% 279
47-5013 Service Unit Operators, Oil, Gas, and Mining 7,174 9,065 1,891 26.4% 189
47-5071 Roustabouts, Oil and Gas 5,960 7,534 1,574 26.4% 157
11-1021 General and Operations Managers 5,486 6,748 1,262 23.0% 126
47-1011 Supervisors of Construction and Extraction Workers 5,205 6,380 1,175 22.6% 118
47-2061 Construction Laborers 4,504 5,538 1,034 23.0% 103
35-3031 Waiters and Waitresses 3,721 4,725 1,004 27.0% 100
41-2031 Retail Salespersons 7,153 7,977 824 11.5% 82
49-9041 Industrial Machinery Mechanics 3,062 3,883 821 26.8% 82
53-7062 Laborers and Freight, Stock, and Material Movers, Hand 3,283 4,086 803 24.5% 80
35-2014 Cooks, Restaurant 1,741 2,543 802 46.1% 80
Sales Representatives, Wholesale and Manufacturing,
41-4012 Except Technical and Scientific Products 3,055 3,797 742 24.3% 74
53-3033 Light Truck or Delivery Services Drivers 2,168 2,862 694 32.0% 69
43-9061 Office Clerks, General 7,873 8,538 665 8.4% 66
13-2011 Accountants and Auditors 2,681 3,306 625 23.3% 62
Operating Engineers and Other Construction Equipment
47-2073 Operators 2,186 2,783 597 27.3% 60
47-2111 Electricians 2,552 3,133 581 22.8% 58
49-3031 Bus and Truck Mechanics and Diesel Engine Specialists 2,107 2,665 558 26.5% 56
41-3099 Sales Representatives, Services, All Other 2,205 2,744 539 24.4% 54
29-1141 Registered Nurses 3,026 3,501 475 15.7% 48
17-2171 Petroleum Engineers 2,247 2,706 459 20.4% 46
35-1012 Workers 1,426 1,867 441 30.9% 44
47-5081 Helpers--Extraction Workers 1,593 2,022 429 26.9% 43
47-2152 Plumbers, Pipefitters, and Steamfitters 2,060 2,481 421 20.4% 42
47-5071 Roustabouts, Oil and Gas 5,960 7,534 1,574 26.4% 157
47-5011 Derrick Operators, Oil and Gas 1,120 1,426 306 27.3% 31
47-5012 Rotary Drill Operators, Oil and Gas 1,297 1,656 359 27.7% 36
31-9092 Medical Assistants 630 788 158 25.1% 16
43-3031 Bookkeeping, Accounting/Auditing 3,098 3,356 258 8.3% 26
13-1199 Business Operations Specialist 974 1,178 204 20.9% 20
47-2031 Carpenters 1,065 1,199 134 12.6% 13
119021 Construction Managers 1,435 1,657 222 15.5% 22
43-5032 Dispatchers, except Police/Fire/Ambulance 745 951 206 27.7% 21
49-9051 Electrical Powerline Installers/Repairers 679 812 133 19.6% 13
49-9021 Heating/Air Conditioning Refrigeration Mechanics 534 639 105 19.7% 10
51-4041 Machinists 919 1,129 210 22.9% 21
Permian Basin Workforce Board Page 17 of 69Standard Occupational
Classification (SOC) or Annual Average Annual Average Number Change Percent Change Annual Change in
In-Demand Occupation Job Title (Name)
Occupational Information Network Employment 2018 Employment 2028 2018–2028 2018–2028 Employment (Growth)
(O*NET) Job Code
49-9071 Maintenance and Repair Workers 2,039 2,356 317 15.5% 32
43-6013 Medical Secretaries 1,196 1,404 208 17.4% 21
47-1011 Managers/Supervisors, Construction Trade Workers 5,205 6,380 1,175 22.6% 118
49-1011 Managers/Supervisors, Mechanics/Installers 1,293 1,590 297 23.0% 30
51-1011 Managers/Supervisors, Production/Operation Worke 1,116 1,319 203 18.2% 20
43-1011 Managers/Supervisors Office/Admin Support 1,832 1,975 143 7.8% 14
53-1048 Managers/Supervisors Transportation/Moving 1,216 1,593 377 31.0% 38
51-8093 Petroleum Pump System/Refinery Operator 701 840 139 19.8% 14
29-2034 Radiologic Technologists and Technicians 289 335 46 15.9% 5
51-4121 Welders/Cutters/Solderers/Brazers 2,375 2,781 406 17.1% 41
17-3023 Electrical and Electronic Technicians 294 350 56 19.0% 6
15-1151 Computer User Support Specialist 448 532 84 18.8% 8
29-2052 Pharmacy Technician 476 549 73 15.3% 7
31-2021 Physical Therapists Assistants 151 171 20 13.2% 2
31-9097 Phlebotomists 159 198 39 24.5% 4
49-3021 Auto Body and Related Repairers 290 343 53 18.3% 5
49-3023 Auto Service Technicians & Mechanics 1,666 1,957 291 17.5% 29
29-9011 Occupational Health and Safety Specialists 611 778 167 27.3% 17
Target Occupations
Target occupations are those occupations considered in demand in one or more industries for which growth in employment is
projected over the next five years, and for which training may be funded through Workforce Innovation and Opportunity Act training
dollars. Wages for these occupations are at least $14.00 per hour or above. Training time is up to two years. The target
occupations are presented in the table on the pages.
Permian Basin Workforce Board Page 18 of 69Annual Annual
Annual Average Number Percent
Average Change in
Target Occupation Job Title (Name) Employment Change Change
Employment Employment
2028 2018–2028 2018–2028
2018 (Growth)
Heavy and Tractor-Trailer Truck Drivers 12,058 15,888 3,830 31.8% 383
Service Unit Operators, Oil, Gas, and
7,174 9,065 1,891 26.4% 189
Mining
Roustabouts, Oil and Gas 5,960 7,534 1,574 26.4% 157
General and Operations Managers 5,486 6,748 1,262 23.0% 126
Industrial Machinery Mechanics 3,062 3,883 821 26.8% 82
Accountants and Auditors 2,681 3,306 625 23.3% 62
Operating Engineers and Other
2,186 2,783 597 27.3% 60
Construction Equipment Operators
Electricians 2,552 3,133 581 22.8% 58
Bus and Truck Mechanics and Diesel
2,107 2,665 558 26.5% 56
Engine Specialists
Registered Nurses 3,026 3,501 475 15.7% 48
Permian Basin Workforce Board Page 19 of 69Annual Annual
Annual Average Number Percent
Average Change in
Target Occupation Job Title (Name) Employment Change Change
Employment Employment
2028 2018–2028 2018–2028
2018 (Growth)
Plumbers, Pipefitters, and Steamfitters 2,060 2,481 421 20.4% 42
Roustabouts, Oil and Gas 5,960 7,534 1,574 26.4% 157
Derrick Operators, Oil and Gas 1,120 1,426 306 27.3% 31
Rotary Drill Operators, Oil and Gas 1,297 1,656 359 27.7% 36
Medical Assistants 630 788 158 25.1% 16
Bookkeeping, Accounting/Auditing 3,098 3,356 258 8.3% 26
Carpenters 1,065 1,199 134 12.6% 13
Construction Managers 1,435 1,657 222 15.5% 22
Dispatchers, except Police/Fire/Ambulance 745 951 206 27.7% 21
Electrical Powerline Installers/Repairers 679 812 133 19.6% 13
Permian Basin Workforce Board Page 20 of 69Annual Annual
Average Annual Average Number Percent Change in
Target Occupation Job Title (Name)
Employment Employment Change Change Employment
2018 2028 2018–2028 2018–2028 (Growth)
Heating/Air Conditioning Refrigeration
534 639 105 19.7% 10
Mechanics
Machinists 919 1,129 210 22.9% 21
Maintenance and Repair Workers 2,039 2,356 317 15.5% 32
Medical Secretaries 1,196 1,404 208 17.4% 21
Managers/Supervisors, Construction Trade
5,205 6,380 1,175 22.6% 118
Workers
Managers/Supervisors,
1,293 1,590 297 23.0% 30
Mechanics/Installers
Managers/Supervisors,
1,116 1,319 203 18.2% 20
Production/Operation Workers
Managers/Supervisors Office/Admin
1,832 1,975 143 7.8% 14
Support
Managers/Supervisors
1,216 1,593 377 31.0% 38
Transportation/Moving
Petroleum Pump System/Refinery
701 840 139 19.8% 14
Operator
Permian Basin Workforce Board Page 21 of 69Annual Annual
Average Annual Average Number Percent Change in
Target Occupation Job Title (Name)
Employment Employment Change Change Employment
2018 2028 2018–2028 2018–2028 (Growth)
Radiologic Technologists and Technicians 289 335 46 15.9% 5
Welders/Cutters/Solderers/Brazers 2,375 2,781 406 17.1% 41
Electrical and Electronic Technicians 294 350 56 19.0% 6
Computer User Support Specialist 448 532 84 18.8% 8
Pharmacy Technician 476 549 73 15.3% 7
Physical Therapists Assistants 151 171 20 13.2% 2
Phlebotomists 159 198 39 24.5% 4
Auto Body and Related Repairers 290 343 53 18.3% 5
Auto Service Technicians & Mechanics 1,666 1,957 291 17.5% 29
Occupational Health and Safety Technician 105 135 30 28.6% 3
Licensed Practical and Licensed Vocational
1,104 1,127 23 2.1 2
Nurses
Firefighters 658 733 75 11.4 8
Permian Basin Workforce Board Page 22 of 69Annual Annual
Average Annual Average Number Percent Change in
Target Occupation Job Title (Name)
Employment Employment Change Change Employment
2018 2028 2018–2028 2018–2028 (Growth)
Emergency Medical Technicians and
350 408 58 16.6 6
Paramedics
Elementary School Teachers
2133 2206 73 3.4 7
Except Special Education
Secondary Education School Teachers
1870 1938 68 3.6 7
Except Special and Career/Tech Ed
Middle School Teachers
754 781 27 3.6 3
Except Special and Career/Tech Ed
Permian Basin Workforce Board Page 23 of 69B. Knowledge and Skills Analysis
Boards must include an analysis of the knowledge and skills needed to meet the employment
needs of the employers in the region, including employment needs for in-demand industry
sectors, in-demand occupations, and target occupations.
Board Response
It is common knowledge throughout Texas that the key areas of knowledge and skills deficiency
are in the basic reading, writing, math and language skills. Students entering post-secondary
education often have to take remediation courses to bring their skills up to the levels needed to
competently take course work, especially in STEM fields.
The concerns regarding skills gaps can be seen in the Oil and Gas sector. Oil and gas companies
are continually upgrading drilling and production facilities in response to safety, regulatory, and
technology advances, causing the amount of data that an operator must interpret in order to
optimize a facility’s production to increase exponentially. Trained employees are at premium
demand in the field, and companies are willing to pay for skills. However, there are too many
skill-specific positions available and too many untrained applicants, and companies within this
industry lack the recruiting, training, and experience necessary to train them.
A recent 3 article in the Odessa American presented the following discussion:
“Asked about the culture of educational attainment in Ector County, school
Superintendent Scott Muri said although people may think they don’t have to go to
school and can just work in the oilfield many jobs in the oilfield may not require a four-
year degree but they do require some type of technical certification or vocational
credential. “The vast majority of jobs require some form of post-secondary credential.
Again, that doesn’t mean four years. It’s four, two, technical or military, but it’s
something and we’ve got to get our kids prepared for those things. In our state right
now, the data say that 70 percent of jobs in Texas require something. In our district, 6.5
percent of our kids have it. That’s just unacceptable. Our jobless rate is partly because
our folks are not educated,” Muri said. “They don’t have the credentials that they need
to be successful. Why is that here? Why does Ector County have the highest
unemployment rate right now? Is it because our populace needs academic experience
that is different from what they may have had in the past. We’ve got to provide it.
That’s why we’re here. That’s why ECISD exists … to prepare them for whatever future
they may want.” Economist Ray Perryman said in a recent column for the Odessa
American that the correlation between education level and employment is well
established. “Not only do those with more education typically earn greater incomes, they
are also less likely to be unemployed. The pandemic has caused this pattern to
accelerate,” Perryman wrote. “Remote work had been growing before COVID-19, but its
prevalence has increased dramatically. More people are working at home, with
companies planning to maintain this posture for now. However, workers with less
education tend to be in jobs for which this approach is not feasible; rather than shifting
to remote work, they have become unemployed. “Given the types of jobs and industries
3
Local economy a mixed bag By Ruth Campbell rcampbell@oaoa.com | Posted: Sunday, November 1, 2020
Permian Basin Workforce Board Page 24 of 69which lend themselves to remote work, it’s not surprising that higher levels of education
have meant a greater likelihood of working from home. Recent surveys by the Bureau of
Labor Statistics indicate that about 70 percent of people with a bachelor’s degree and
higher are in jobs suitable to perform remotely, compared to just 25-30 percent of those
with only a high school diploma,” he stated.
The challenge facing the region is steep because it suffers from low educational attainment
rates relative to the state and nation. The region is responding to these challenges by
developing progressive workforce and education programs and partnerships that (1) develop
the transferable and technical skills necessary to be competitive within its Adult Labor Force
and (2) provide for rapid skill attainment and credentialing for area youth in secondary and
post-secondary education and training programs.
The Board has determined that approximately 70% of the jobs the region will not require a
college degree, but they will require something beyond a high school diploma, i.e., certificate,
certification. Representatives of local industry strongly believe that having a skilled and flexible
workforce is important for the future growth of the region. The most important skill: ability to
communicate verbally with people inside and outside the company. Employers also want new
hires to have technical skills related to the job and be able to work in teams.
Permian Basin employers are experiencing the same skills issues as other employers in the
country. It is difficult to find people with the technical skills required for many of the growing
occupations. The increase in technological based work processes is making it difficult for those
in need of basic skills remediation to find employment. Many job seekers have had very little
work experience. Many applicants lack the so-called soft skills that are tied to work maturity
and emotional intelligence: communication skills, making decisions, self-motivation, leadership
skills, team working skills, creativity and problem-solving skills, and time management.
Employers are seeking applicants with active learning, active listening, critical thinking, reading
comprehension, monitoring and assessing performance, using scientific methods, speaking to
convey information and writing ability. Employers need applicants able to demonstrate social
skills: coordination, instructing others, negotiating, persuasion, service orientation and social
perceptiveness, and successful interpersonal relations. Many of these skills cannot be directly
taught but must be learned through work ready instruction and experience on the job.
Consequently, it is extremely important to work with employers willing to give applicants the
time to help acquire and advance these skills and abilities.
For specific occupations applicants need four sets of abilities: cognitive, physical, psychomotor,
and sensory abilities. Cognitive abilities include skills such as deductive reasoning, fluency of
ideas, inductive reasoning, information ordering, mathematical reasoning, oral comprehension
and expression as well as others. ONETonline.org presents the required skills for any
occupation an applicant might research and gain an understanding of what skills will be needed
for specific occupations. Physical abilities relate to strength and flexibility, stamina and
equilibrium. Psychomotor abilities refer to the capacity to manipulate and control objects to
Permian Basin Workforce Board Page 25 of 69include dexterity and response orientation. Sensory abilities include depth perception, hearing
sensitivity, near vision, auditory attention among others.
System skills, the capacity to be able to work with people to achieve goals, and technical skills
can be obtained through occupational skills training provided by our education partners and
funded through workforce development programs. PBWDB’s workforce center system
contractor determines, through testing and assessment, what skills an applicant may have and
what skills need additional work. That capacity determines to a great extent what job
opportunities an individual might be referred to by the case manager. The Board requires the
workforce center system contractor to only refer applicants who are qualified for the job
opening.
The challenge for the Board and its partners is to develop programs and activities that provide
access to the opportunity for acquisition of these skills, in terms of basic skills remediation,
acquiring soft skills through work experience and technical skills through occupational skills
training. Occupational skills training is underfunded and falls short of meeting the need to
ensure a pipeline of skilled applicants for future job openings.
One of the partners working with the Board on the skills issue is the Region 18 Education
Service Center. Region 18 Education Service Center has recently become part of the Texas
EcosySTEM partnership. The goal of the Texas EcosySTEM is to bring together educators,
community members, and business people to provide opportunities that will prepare our
students for the STEM workforce.
The Texas Education Agency (TEA) has defined STEM (Science, Technology, Engineering, and
Mathematics) education as: a method of hands-on teaching and learning in which students
apply academic content to creatively solve real-world problems with innovative design-based
thinking that prepares students for future career opportunities. Over the course of three years
(2016-2018), only 9,161 students in Texas completed a STEM endorsement as part of their high
school graduation requirements. It is predicted that in 2026 there will be 1.9 million STEM job
openings in Texas. The Region 18 EcosySTEM community will work together to ensure
equitable access to STEM opportunities for students from Pre-K to college in our area in order
to better prepare students for these jobs of the future.
The Region 18 EcosySTEM Design Team will be charged with determining what the specific
STEM needs and opportunities are for our geographic area. The Design Team will look at the
labor market data for Texas and Region 18 and will work together to determine the goals for
the Region 18 EcosySTEM. Members of the design team will include STEM business/industry
partners, informal and formal STEM educators at the primary, secondary, and university level,
and STEM community members. This stakeholder group meets quarterly.
The Board is also partnering with area colleges in the 60X30TX initiative, whose stated goals
include the following.
• By 2030, at least 60 percent of Texans age 25-34 will have a certificate or degree.
Permian Basin Workforce Board Page 26 of 69• By 2030 at least 550,000 students in that year will complete a certificate, associate,
bachelor’s or master’s degree from an institution of higher education in Texas.
• By 2030, all graduates from Texas public institutions of higher education will have
completed programs with identified marketable skills.
• By 2030, undergraduate student loan debt will not exceed 60 percent of first year wages
for graduates of Texas public institutions.
The role of the Permian Basin Workforce Development Board is to:
• Support workforce development and education initiatives that expand training
opportunities and enhance the skills of job applicants in the region.
• Align workforce initiatives to support industry clusters targeted for development
by state and local government and economic development stakeholders.
• Promote entrepreneurship skills to improve the ability of individuals to start their own
business.
C. Labor Force Analysis and Trends
Boards must include an analysis of the regional workforce, including current labor force
employment and unemployment data, information on labor market trends, and
educational and skill levels of the workforce, including individuals with barriers to
employment.
Board Response
Permian Basin WDA Labor Force
October 2020 September 2020 October 2019 Yearly Change
Civilian Labor
266,539 268,470 276,419 -6,880
Force
Employed 242,671 240,591 266,788 -24,117
Unemployed 23,868 27,879 6,631 17,237
UI Rate 9% 10.4% 2.4% 6.6%
Continued UI
12,928 19,169 1,281 11,647
Claims
Historical Unemployment Rates
Months Permian Basin % Texas % US %
October 2020 9.0 6.7 6.6
September 2020 10.4 8.2 7.7
August 2020 8.8 7.0 8.5
Permian Basin Workforce Board Page 27 of 69July 2020 10.2 8.3 10.5
June 2020 10.3 8.7 11.2
May 2020 13.5 12.7 13.0
April 2020 11.0 13.1 14.4
March 2020 4.0 5.1 4.5
February 2020 2.8 3.6 3.8
January 2020 2.9 3.8 4.0
December 2019 2.5 3.3 3.4
November 2019 2.5 3.4 3.3
October 2019 2.4 3.3 3.3
As a result of the pandemic and the crash in the oil markets, the Permian Basin civilian labor
force dropped by 6,880 workers between October 2019 and October 2020. Unemployed
individuals peaked at 27,879 in September 2020. There were 12,928 continued UI claims in
October 2020. The ranks of the unemployed persons increased by 11,647 persons from
October 2019 to October 2020. This loss in employment had a devastating impact on all the
major industry sectors, with Natural Resources and Mining being hardest hit, losing almost 29%
of its workforce.
As has occurred throughout the US economy, the corona virus pandemic hit the Permian Basin
region hard with layoffs and business closures beginning between March and April 2020.
Unemployment went from four percent in March 2020 to a peak of 13.5% in May. The State of
Texas experienced a similar increase, but recovery seems to be occurring more rapidly as
Permian Basin’s unemployment rate is still several percent points higher than the State and
National rates.
The table below presents employment by industry for the second quarter 2019 to the second
quarter 2020. All industries experience a drop in employment save one: Public Administration,
which actually increased 3.79% over 2019. Natural Resources and Mining had the largest
decline in terms of numbers of employees. Construction, Manufacturing, and Trade,
Transportation and Utilities lost between 20% to 22% of their workforce. The Leisure and
Hospitality industry also was significantly impacted with 5,254 individuals losing their jobs, or
20.65%, between the second quarter 2019 and 2020.
Employment by Industry
(2nd Quarter 2020 to 2nd Quarter 2019, Percent Change)
% of Total % of Total 2020 % Change
Industry Q2 2020 Q2 2019
Employment Employment Difference from 2019
Natural
Resources and 42,188 19.8 59,391 23.3 -17,203 -28.97%
Mining
Construction 17,509 8.2 22,714 8.9 -5,205 -22.92%
Manufacturing 9,165 4.3 11,620 4.6 -2,455 -21.13%
Permian Basin Workforce Board Page 28 of 69You can also read