PHOENIX MARKET REPORT - Q4 2020: INDUSTRIAL - LPC Desert West
←
→
Page content transcription
If your browser does not render page correctly, please read the page content below
Q4 2020: INDUSTRIAL

PHOENIX
   MARKET
   R E P O RT
O NTENT
          MARKET FUNDAMENTALS                                      02
          LEASING                                                  04
          SALES ACTIVITY                                           06
          CONSTRUCTION & DEVELOPMENT                               08
          FOURTH QUARTER DATA                                      09
          ABOUT US: DESERT WEST REGION                             10

          SOURCES
          Lincoln Property Company reflects market data averaged
          from across the market’s major brokerage houses.
MARKET
FUNDAMENTALS

           LINCOLN PROPERTY COMPANY / Q4 PHOENIX INDUSTRIAL / 1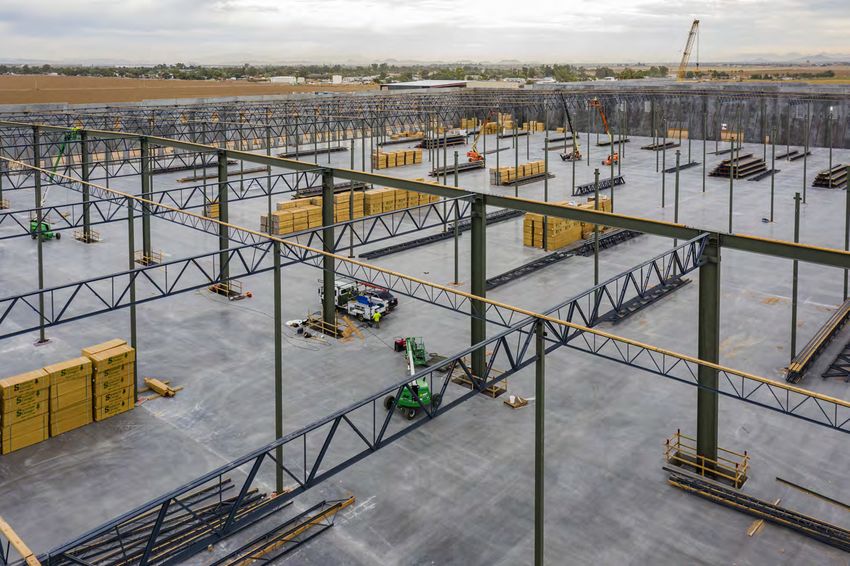
"Industrial demand continues to grow in Phoenix as approximately
               55% of the space delivered this quarter was pre-leased."

 Q4 2020                                                                           Q4 2019
  7.58%
    VACANCY
                                                     0.59%
                                                                                    6.99%
                                                                                    VACANCY

   $0.64
    RENTAL RATES
                                                      2.22%                        $0.63
                                                                                    RENTAL RATES

   8.33M
    SF UNDER CONSTRUCTION
                                                     21.08%                        10.56M
                                                                                    SF UNDER CONSTRUCTION

   14.45M
    SF DELIVERED YTD
                                                      103.29%                      7.11M
                                                                                    SF DELIVERED YTD

   12.70M
    NET ABSORPTION YTD
                                                     97.34%                        6.43M
                                                                                    NET ABSORPTION YTD

                            LINCOLN PROPERTY COMPANY / Q4 PHOENIX INDUSTRIAL / 2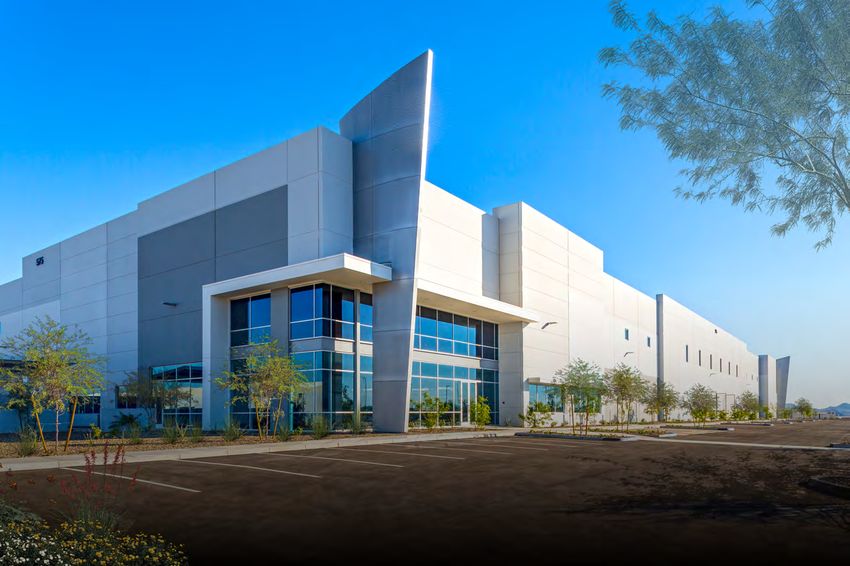
LEASING
FUNDAMENTALS

           LINCOLN PROPERTY COMPANY / Q4 PHOENIX INDUSTRIAL / 3
L
       easing activity has maintained strong momentum              PHOENIX ASKING RATES
       throughout the fourth quarter as market
       fundamentals improved quarter-over-quarter in                $0.65                                                                                                $0.64
the Phoenix industrial sector. With a centralized location
in the region, deep labor pool and business-friendly                $0.64
regulations, these trends are expected to continue                                                                  $0.63                                   $0.63
throughout 2021.                                                    $0.63                                $0.62
                                                                                                                                              $0.62
                                                                    $0.62                                                        $0.62
At the end of 2020, asking rates averaged $0.64,                                  $0.61      $0.61
representing a 222-basis-point increase from year-end               $0.61
2019. Major leasing activity continues to be
                                                                    $0.60
concentrated around the Southwest submarket, with
the largest lease transaction of the quarter occurring at           $0.59
Liberty Logistics Center I for 594k SF. Despite an uptick in                      19' Q1     19' Q2      19' Q3    19' Q4       20' Q1        20' Q2        20' Q3       20' Q4
construction activity, vacancy rates have remained
steady at 7.58%. With 55% of the space developed
during the fourth quarter already pre-leased,
construction activity is expected to continue in order to
                                                                   PHOENIX VACANCY
keep pace with a growing demand.
                                                                    319,500,000                                                                                             10.00%
TOP LEASES                                                                                                                                                                  9.00%
                                                                    284,000,000
     Tenant - The Real Real                                                                                                                                                 8.00%
                                                                    248,500,000
     Building - Liberty Logistics Center I
 •   Square Feet - 593,600                                          213,000,000
                                                                                                                                                                            7.00%
                                                                                                                                                                            6.00%
     Submarket - Southwest Valley                                   177,500,000
                                                                                                                                                                            5.00%
                                                                    142,000,000
     Tenant - Thrift Books Global                                                                                                                                           4.00%
                                                                    106,500,000
     Building - Logic Park 91                                                                                                                                               3.00%
 •   Square Feet - 189,174                                           71,000,000                                                                                             2.00%
     Submarket - Southwest Valley                                    35,500,000                                                                                             1.00%
                                                                             0                                                                                              0.00%
     Tenant - Express Scripts                                                       19' Q1    19' Q2      19' Q3   19' Q4     20' Q1       20' Q2   20' Q3      20' Q4
     Building - Elliot Business Park 2
 •   Square Feet - 125,000                                                                    Total Existing SF       Total Available SF        Vacancy %
     Submarket - Tempe

                                                   LINCOLN PROPERTY COMPANY / Q4 PHOENIX INDUSTRIAL / 4
SALES
ACTIVITY
LINCOLN PROPERTY COMPANY / Q4 PHOENIX INDUSTRIAL / 5A
s the fourth quarter came to a close, the Phoenix NET ABSORPTION
industrial sector continued to be the focal point
7,000,000
of investment sales activity. Sales volume
increased nearly 125% quarter-over-quarter and cap 6,000,000
rates compressed to 6.2%. The largest single transaction
of the quarter was Chandler Airport Commerce Center 5,000,000
(201,784 SF), which was sold to Lexington Realty Trust 4,000,000
and is 100% occupied by Amazon on a long-term lease.
Several major portfolio transactions also occurred, 3,000,000
including Starwood Capital Group’s acquisition of a Average: 2,378,993 SF
multi-state portfolio consisting of approximately 2.4 2,000,000
million square feet, about half of which is located in the 1,000,000
Chandler, Tempe and Southwest Valley submarkets.
0
Economic conditions in Phoenix continue to show 19' Q1 19' Q2 19' Q3 19' Q4 20' Q1 20' Q2 20' Q3 20' Q4
quarter-over-quarter improvement. COVID-19 cases Net Absorption Average
have fallen substantially throughout Arizona while
vaccinations pick up. Arizona now reports passing the
millionth vaccine dose mark, which represents TOP SALES
approximately 10% of the state’s population. After losing
Building - Chandler Airport Commerce Park
295k jobs in April 2020, the state has rebounded and
Seller - Ryan Companies
approximately two-thirds of those jobs have been • Buyer - Lexington Realty Trust
recovered. As Arizona remains one of the leading growth Price - $87,250,000 / $434.75 PSF
states for population, income and employment, Phoenix
is well-positioned to return to near normalcy as we move Building - Southwest Industrial Center
into 2021. Seller - CBRE Global Investors
• Buyer - BlackRock Realty Advisors
Price - $72,500,000 / $105.93 PSF
Building - Ryan West Business Park
Seller - Cohen Asset Management
• Buyer - KKR
Price - $31,850,000 / $131.14 PSF
LINCOLN PROPERTY COMPANY / Q4 PHOENIX INDUSTRIAL / 6CONSTRUCTION
ACTIVITY
LINCOLN PROPERTY COMPANY / Q4 PHOENIX INDUSTRIAL / 7A
s consumers continue to shift toward online PHOENIX DELIVERIES
shopping, demand for warehouse/distribution
space has increased. Approximately 8.33 million 7,000,000
square feet of industrial space is under construction and
6,000,000
14.45 million square feet was delivered in the fourth
quarter – nearly 55% of which was pre-leased as users 5,000,000
recognize the economic and logistical benefits of
4,000,000
Phoenix. To keep pace with demand, development
activity is expected to ramp up this year through a 3,000,000 Average: 2,837,963 SF
combination of speculative and build-to-suit projects.
2,000,000
Lincoln Property Company’s Park303 is a single-phased 1,000,000
development consisting of two 40’ clear height, cross
dock facilities of 705,531 RSF and 487,415 RSF. Offering 0
maximum flexibility, these buildings can also be 19' Q1 19' Q2 19' Q3 19' Q4 20' Q1 20' Q2 20' Q3 20' Q4
combined to form a single, contiguous 1.25 million-
Deliveries Average
square-foot building. Additional project features include:
clerestory windows, R-30 insulation, north/south docks,
fully secured perimeter, expandable parking options and
concrete truck courts. Park303 will be delivered in the PHOENIX CONSTRUCTION ACTIVITY
first quarter of 2021.
20' Q4
UNDER CONSTRUCTION
Building - Park303
Developer - Lincoln Property Company 20' Q3
• Submarket - Glendale
Delivery - Q1 2021
20' Q2
Building - Elwood Logistics Center
Developer - Tratt Properties
• Submarket - Goodyear
20' Q1
Delivery - Q1 2021
Building - Mark Anthony Brewing 0 2,000,000 4,000,000 6,000,000 8,000,000 10,000,000 12,000,000 14,000,000
Developer - Merit Partners
• Submarket - Glendale
Delivery - Q1 2021
LINCOLN PROPERTY COMPANY / Q4 PHOENIX INDUSTRIAL / 8FOURTH
QUARTER DATA
DATA SOURCE TOTAL EXISTING SF TOTAL AVAILABLE SF VACANCY % NET ABSORPTION Q4
CBRE 340,544,179 20,378,475 5.98% 5,085,688
Colliers 326,705,035 24,320,884 7.44% 7,085,545
Cushman & Wakefield 345,631,502 26,876,401 7.78% 7,747,486
JLL 293,680,577 24,669,168 8.40% 3,603,213
NGKF 318,491,621 26,434,805 8.30% 5,449,206
LPC Averages 325,010,583 24,535,947 7.58% 5,794,228
DATA SOURCE NET ABSORPTION YTD UNDER CONSTRUCTION COMPLETED Q4 ASKING RATES
CBRE 13,143,535 11,132,558 4,741,872 $0.70
Colliers 13,908,003 7,009,753 6,537,748 $0.63
Cushman & Wakefield 14,594,291 9,582,586 9,500,000 $0.65
JLL 9,123,535 6,254,673 5,276,802 $0.58
NGKF 12,723,086 7,676,053 6,600,000 $0.66
LPC Averages 12,698,490 8,331,125 6,531,284 $0.64
LINCOLN PROPERTY COMPANY / Q4 PHOENIX INDUSTRIAL / 9ABOUT US
NATIONAL PRESENCE. Local Focus.
Lincoln Property Company’s Desert West Region
includes Arizona, Nevada, Utah and New Mexico.
Based in Phoenix and operating since 2001, we offer
a comprehensive suite of value-added services for
our clients ranging from development, construction
management, property management, leasing and
asset management services for the office, industrial
and retail sectors. Our expertise across a broad
spectrum of real estate services enables us to design
and execute projects for our clients and partners in
support of their business and financial objectives.
Desert West Region.
LINCOLN PROPERTY COMPANY / Q4 PHOENIX INDUSTRIAL / 10FOR ADDITIONAL INFORMATION, PLEASE CONTACT: David R. Krumwiede Senior Executive Vice President 602.912.8877 dkrumwiede@lpc.com John H. Orsak Vice President 602.912.8879 jorsak@lpc.com Nick E. Nudo Director of Real Estate 602.912.8888 nnudo@lpc.com Justin M. Arnitz Associate Director of Real Estate 602.912.8876 jarnitz@lpc.com
You can also read