Photocatalysis applied to concrete products - part 2 : influencing factors and product performance - Pure
←
→
Page content transcription
If your browser does not render page correctly, please read the page content below
Photocatalysis applied to concrete products - part 2 :
influencing factors and product performance
Citation for published version (APA):
Hunger, M., Hüsken, G., & Brouwers, H. J. H. (2008). Photocatalysis applied to concrete products - part 2 :
influencing factors and product performance. ZKG international, 61(10), 76-84.

Document status and date:
Published: 01/01/2008

Document Version:
Publisher’s PDF, also known as Version of Record (includes final page, issue and volume numbers)

Please check the document version of this publication:
• A submitted manuscript is the version of the article upon submission and before peer-review. There can be
important differences between the submitted version and the official published version of record. People
interested in the research are advised to contact the author for the final version of the publication, or visit the
DOI to the publisher's website.
• The final author version and the galley proof are versions of the publication after peer review.
• The final published version features the final layout of the paper including the volume, issue and page
numbers.
Link to publication

General rights
Copyright and moral rights for the publications made accessible in the public portal are retained by the authors and/or other copyright owners
and it is a condition of accessing publications that users recognise and abide by the legal requirements associated with these rights.

       • Users may download and print one copy of any publication from the public portal for the purpose of private study or research.
       • You may not further distribute the material or use it for any profit-making activity or commercial gain
       • You may freely distribute the URL identifying the publication in the public portal.

If the publication is distributed under the terms of Article 25fa of the Dutch Copyright Act, indicated by the “Taverne” license above, please
follow below link for the End User Agreement:
www.tue.nl/taverne

Take down policy
If you believe that this document breaches copyright please contact us at:
openaccess@tue.nl
providing details and we will investigate your claim.

Download date: 23. Oct. 2021
Materials Science
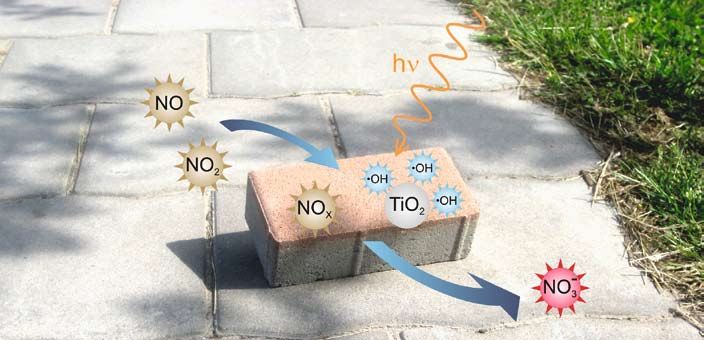
Photocatalysis applied to concrete products
Part 2: Influencing factors and product performance
Martin Hunger, Götz Hüsken, Jos Brouwers
University of Twente, Enschede/The Netherlands
Summary: The second part of this three-part article series addresses the influence of physicochemical parameters on the degradation
performance of concrete products containing photocatalytic active TiO2. The influence of process conditions like irradiance, relative
humidity, pollutant concentration and flow rate on the degradation mechanism is investigated. Furthermore, a short overview on
photo catalytic powders (especially TiO2) and their influence on the degradation of NO are presented. In addition the application of
TiO2 coatings and their microstructural analysis is explained.
Photokatalytische Betonprodukte Produits de béton photocatalytiques La fotocatálisis aplicada a los
Teil 2: Einflussgrößen Partie 2: Grandeurs influentes productos del hormigón
und Leistungspotenzial et potentiels de performance Parte 2: Factores de influencia
y rendimiento del producto
Zusammenfassung: Der zweite Teil Résumé: La seconde partie de cette pu-
dieses dreiteiligen Artikels beinhaltet den blication en trois parties porte sur l’in- Resumen: La segunda parte de este artícu-
Einfluss physikochemischer Größen auf fluence des grandeurs physico-chimi- lo, que consta de un total de tres, describe
die schadstoffreduzierende Wirkung pho- ques exerçant un effet réducteur sur les la influencia de los parámetros físico-quí-
tokatalytisch aktiver Betonwaren. Hier- substances nocives des produits de béton micos en la resistencia a la degradación
bei werden der Einfluss prozessbedingter actifs du point de vue photocatalytique. de los productos del hormigón con con-
Größen des Versuchsaufbaus wie Be- Pour cela, l’influence des grandeurs in- tenido en TiO2 fotocatalítico activo. Se
strahlungsstärke, relative Luftfeuchtigkeit, hérentes au processus sur la dégradation investiga la influencia de las condiciones
Schadstoffkonzentration und Durchfluss- dans le cas du montage d’essai, tel qu’in- de proceso como la irradiación, la hume-
rate in der Reaktorzelle auf den Abbau- tensité d’irradiation, humidité relative de dad relativa, la concentración de elemen-
prozess untersucht. Weiterhin wird ein l’air, concentration en substances nocives tos dañinos y el avance de la reacción del
kurzer Überblick über photokatalytische et débits, est examinée dans la cellule de mecanismo de degradación. Además, se
Materialien (TiO2 im Speziellen) und de- réacteur. Par ailleurs, il est donné un bref introduce brevemente los materiales fo-
ren Einfluss auf den NO-Abbau gegeben. aperçu sur les matières photocatalytiques tocatalíticos (en especial el TiO2) y su in-
Eine Untersuchung des Mikrogefüges (notamment le TiO2) et leur influence fluencia en la degradación del NO. Y por
hinsichtlich verschiedener Applikations- sur la dégradation de NO. Un examen de último, se describe la aplicación de reves-
möglichkeiten von TiO2-Beschichtungen la microstructure concernant différents timientos de TiO2 y su microestructura.
vervollständigt den Beitrag. moyens d’application des enductions de
TiO2 complète l’article.
76 ZKG INTERNATIONAL No. 10-2008 (Volume 61)Materials Science
50 50
0.431 2
y = 8.583x ; R = 0 .998
40 40
Degradation rate [%]
Degradation rate [%]
30 30
20 20
10 10
y = -0.251x + 33.7; R 2 = 0.99
0 0
0 3 6 9 12 15 10 20 30 40 50 60 70 80
Irradiance [W/m 2 ] Relative humidity [%]
1 Influence of the irradiance on the degradation rate 2 Influence of the relative humidity on the degradation rate
Einfluss der Bestrahlungsstärke auf die Umsatzrate Einfluss der relativen Luftfeuchtigkeit auf die Umsatzrate
1 Influencing factors 1 Einflussgrößen
The degradation of NO and therewith the performance of the Der Abbau von NO und die damit verbundene Leistungsfähig-
photocatalytic reaction is governed by physicochemical as well keit des photokatalytischen Systems sind von den physikoche-
as product-related parameters. In the following, a short and de- mischen Eigenschaften des Photokatalysators sowie von phy-
scriptive explanation of the influencing factors irradiance, rela- sikalischen Eigenschaften des Betons abhängig. Im Folgenden
tive humidity, pollutant concentration and flow rate is given. wird eine kurze Übersicht zu den Einflussfaktoren Bestrah-
Furthermore, the influence of product-related parameters like lungsstärke, relative Luftfeuchtigkeit, Schadstoffkonzentration
the type of TiO2 as well as content and application technique und Durchflussmenge gegeben. Weiterhin werden der Einfluss
will be addressed. The remaining process conditions of the verschiedener TiO2-Präparate sowie deren unterschiedliche
below-mentioned measurements are based on the suggestions Dosierung erläutert. Die übrigen Prozessgrößen der im Nach-
given in part 1 [1] and kept constant at 50 % relative humidity, folgenden beschriebenen Versuche basieren auf den Vorschlägen
3 l/min flow rate, 1 ppmv pollutant concentration and 10 W/m2 aus Teil 1 [1] und werden konstant auf 50 % relativer Luftfeuch-
irradiance. tigkeit, 3 l/min Durchflussrate, 1 ppmv Schadstoffkonzentra
tion sowie 10 W/m2 Bestrahlungsstärke gehalten.
1.1 Process conditions of the setup
1.1.1 Irradiance 1.1 Einflussgrößen des Versuchsaufbaus
The degradation process of NO molecules is caused by the 1.1.1 Bestrahlungsstärke
photo catalytic activity of TiO2 in the anatase modification. Der Abbau von NO wird durch die photokatalytische Aktivität
This photocatalytic behaviour results from the optoelectronic von TiO2 in der Anatasmodifikation hervorgerufen. Das pho-
properties of this semiconductor. According to the explana- tokatalytische Verhalten wird durch die optoelektronischen Ei-
tion of the photocatalytic process given in part 1, the UV-A genschaften dieses Halbleiters verursacht. Entsprechend der in
light shows the most suitable range regarding the wavelength Teil 1 gegebenen Erläuterung des photokatalytischen Prozesses
() to start the photocatalytic oxidization (PCO). However, not eignet sich Licht im UV-A Bereich aufgrund seiner Wellenlänge
only the wavelength influences the efficiency of the system, but (), um die photokatalytische Oxidation (PCO) zu induzieren.
also the light intensity or irradiance (E) has an effect on the Die Effizienz des Gesamtsystems wird jedoch nicht nur durch
degradation rate. According to Herrmann [2], the increase in die Wellenlänge des verwendeten Lichtes beeinflusst, sondern
the photocatalytic activity caused by increased irradiance can hängt in entscheidendem Maß auch von der Bestrahlungsstärke
be divided into two phases: a) for E 250 W/m2 the degra- (E) ab. Die Steigerung der photokatalytischen Aktivität kann
dation increases proportional to E and b) for E 250 W/m2 entsprechend den Aussagen von Herrmann [2] in zwei Pha-
the photocatalytic activity grows as the square root of E. This sen unterteilt werden: a) für E 250 W/m2 nimmt der Abbau
linear behaviour in the range of low irradiance (E 15 W/m2) proportional zu und b) für E 250 W/m2 steigt die photoka-
could not be verified by own measurements. Figure 1 shows talytische Aktivität im Verhältnis der Quadratwurzel aus E. Das
the dependence of the NO removal on the irradiance for low lineare Verhalten konnte im Bereich geringer Bestrahlungs-
values of irradiance based on own measurements on a paving stärke (E 15 W/m2) nicht durch eigene Messungen bestä-
block containing TiO2. A power function describes the relation tigt werden. Bild 1 zeigt die Abhängigkeit des NO-Abbaus bei
between the irradiance and achieved degradation rate for low geringen Beleuchtungsstärken an einem TiO2-enthaltenden
values of irradiance (E 15 W/m2). According to Blöß [3], Pflasterstein, basierend auf eigenen Messdaten. Das Verhältnis
the averaged UV-A irradiance of a cloudless summer midday zwischen Beleuchtungsstärke und erreichbaren Abbauraten
amounts to approximately 35 W/m2 for Central Europe. Fur- kann im Bereich geringer Beleuchtungsstärken (E 15 W/m2)
thermore, values in the range of 7 to 10 W/m2 for the UV-A durch eine Potenzfunktion beschrieben werden. Entsprechend
irradiance on cloudy days have been confirmed by own meas den Aussagen von Blöß [3] kann die UV-A Beleuchtungsstärke
ZKG INTERNATIONAL No. 10-2008 (Volume 61) 77Materials Science
100 100
90 90
80 80
Degradation rate [%]
Degradation rate [%]
70 68.4 70 66.6
60 60
50 47.6 50
40 38.3 36.9 40 36.9
30 30
22.1
20 20
10 10
0 0
0.1 0.3 0.5 1.0 1 3 5
Concentration NO [ppmv] Flow rate [l/min]
3 Influence of the pollutant concentration on the degradation rate 4 Influence of the flow rate on the degradation rate
Einfluss der Schadstoffkonzentration auf die Umsatzrate Einfluss der Durchflussrate auf die Umsatzrate
urements. Based on these values, the theoretical functional an einem wolkenfreien Sommertag gegen Mittag mit 35 W/m2
capability is ensured even for cloudy weather conditions with für Mitteleuropa angenommen werden. Des Weiteren kön-
low values of UV-A irradiance. nen Werte im Bereich von 7 bis 10 W/m2 an bedeckten Ta-
gen durch eigene Messungen bestätigt werden. Folglich ist die
1.1.2 Relative humidity theoretische Wirkungsweise auch bei Bewölkung mit geringen
The influence of the relative humidity depends to a large ex- Bestrahlungsstärken sichergestellt.
tent on the type of material used. According to Beeldens [4],
the hydrophilic effect at the surface increases over the oxidiz- 1.1.2 Relative Luftfeuchtigkeit
ing effect when high values of relative humidity are applied. Der Einfluss der relativen Luftfeuchtigkeit ist stark vom verwen-
The water molecules are adsorbed at the surface and therefore deten Probenmaterial abhängig. Laut Beeldens [4] überwiegt
prevent the pollutants from adsorbing to the surface and react- der hydrophile Charakter der Oberfläche dem oxidierenden
ing with the TiO2. Figure 2 gives an overview of the achieved Effekt, wenn hohe relative Luftfeuchtigkeiten vorherrschen.
degradation rates depending on the relative humidity. It is evi- Dabei werden die Wassermoleküle vorzugsweise an der Ober-
dent from Figure 2 that with increasing relative humidity the fläche des Katalysators adsorbiert und verhindern so eine Anla-
total efficiency of the system regarding the degradation of NO gerung des Schadstoffs und damit eine weitere Abbaureaktion.
decreases linearly. Bild 2 gibt einen Überblick über die erreichten Abbauraten in
Abhängigkeit von der relativen Luftfeuchtigkeit. Aus Bild 2
1.1.3 Pollutant concentration ist weiterhin ersichtlich, dass mit zunehmender relativer Luft-
The influence of the pollutant concentration on the NO deg- feuchtigkeit die Effizienz des Systems im Hinblick auf den Ab-
radation plays an important role when paving blocks are com- bau von NO linear abnimmt.
pared with each other. Figure 3 shows the influence of varying
NO inlet concentrations on the achievable degradation rates 1.1.3 Schadstoffkonzentration
for a paving block containing TiO2. It is obvious from Figure 3 Für den Vergleich der Effizienz verschiedener Pflastersteine
that increasing inlet concentrations result in lower degradation untereinander ist der Einfluss der Schadstoffkonzentration von
rates whereas lower pollutant concentrations are performance entscheidender Bedeutung. Bild 3 zeigt den Einfluss von verän-
enhancing. Furthermore, changes of the pollutant concentra- derlichen NO-Eingangskonzentrationen auf die erreichbaren
tion in the lower range result in remarkable higher changes of Abbauraten eines photokatalytischen Pflastersteins. Aus Bild 3
the degradation rate than changes in the range of higher con- wird deutlich, dass erhöhte Eingangskonzentrationen zu gerin-
centrations.Therefore, also a limit value for the degradation rate geren Abbauraten führen, wobei geringe Schadstoffkonzentra-
exists which will not fall short. tionen die Effizienz des Systems erhöhen. Weiterhin ist ersicht-
lich, dass Änderungen der Schadstoffkonzentration im Bereich
1.1.4 Flow rate geringer Konzentration größere Veränderungen nach sich zie-
The flow rate or the connected residence time of the pollutant hen als Änderungen im Bereich hoher Konzentration. Daher
on the active surface of the concrete product can vary under ist anzunehmen, dass für die Abhängigkeit der Abbaurate von
practical conditions extensively as the wind speed as well as the der Schadstoffkonzentration ebenfalls ein Grenzwert existiert,
wind direction is changing by time. Under laboratory condi- der nicht unterschritten wird.
tions, various flow rates can be realized which result in different
simulations of environmental conditions and therefore in un- 1.1.4 Durchflussrate
equal conditions for comparative tests. Figure 4 shows the results Die Durchflussrate oder die damit verbundene Verweilzeit des
for varying flow rates on the NO degradation. High flow rates Schadstoffs auf der aktiven Oberfläche des Betons ist in der
reduce the residence time of the model pollutant on the active Praxis beträchtlichen Änderungen unterworfen, da sich sowohl
78 ZKG INTERNATIONAL No. 10-2008 (Volume 61)Materials Science
die Windgeschwindigkeit als auch die Windrichtung zeitlich
50
verändern. Unter Laborbedingungen können verschiedene
45 Ground Durchflussraten in der Reaktorzelle realisiert werden, welche in
Sandblasted 39.1 unterschiedlichen Simulationen der Umweltbedingungen und
40
nicht vergleichbaren Randbedingungen des Versuchs resultie-
Degradation rate [%]
35
ren. Bild 4 zeigt die Ergebnisse für den NO-Abbau bei unter-
30 27.6 schiedlichen Durchflussraten. Hohe Durchflussraten reduzieren
24.2 die Verweilzeit des Modellschadstoffs auf der aktiven Ober
25
20
19.5 fläche, was zu geringeren Abbauraten führt. Geringe Durch-
flussraten erhöhen hingegen die Abbauraten durch eine längere
15
10.5 11.2 Verweilzeit des Modellschadstoffs innerhalb des Systems.
9.4
10 7.6 7.0
5.5
5 1.2 Produktbezogene Eigenschaften
Nicht nur Änderungen der physikochemischen Randbedin-
0
TiO2 A TiO2 B TiO2 C TiO2 D TiO2 E gungen des Versuchsaufbaus beeinflussen den Abbau von NO,
sondern auch produktbezogene Kenngrößen sind von entschei-
dender Bedeutung. Hierbei haben die Art sowie der Anteil von
5 Degradation rates of the analyzed powders TiO2 im Endprodukt große Relevanz für den Abbauprozess.
Umsatzraten der verwendeten photokatalytischen Materialien Ebenso bestimmen die Anwendungsmethode und eine homo-
gene Verteilung des feinen TiO2 die Effizienz des Endprodukts.
surface, and hence the degradation rate is subsequently reduced, Daher wurden fünf verschiedene TiO2-Präparate für Mör-
whereas lower flow rates enhance the degradation rate by a lon- teluntersuchungen ausgewählt (Tabelle 1). Die ausgesuchten
ger residence time of the model pollutant within the system. TiO2 umfassen vier Standard-TiO2 in der Anatasmodifikation
(TiO2 A-D) sowie ein kohlenstoffdotiertes TiO2 (TiO2 E), des-
1.2 Product related parameters sen Korngrößenverteilung (PSD) der PSD des nicht dotierten
Not only changes of the physicochemical parameters of the TiO2 für den Einsatz im UV-A Bereich (TiO2 D) entspricht.
test setup will influence the degradation of NO, but also prod- Versuchsmörtel mit einem Gehalt von 3 %, 5 % und 10 % TiO2
uct-related parameters are of great influence. Here, the type wurden hergestellt und getestet. Die Mischungszusammenstel-
of TiO2 as well as its content in the final product is relevant lung der Mörtel ist aus Tabelle 2 ersichtlich. Der Gehalt an TiO2
for the degradation process. Also the application method and basiert auf der Masse des eingesetzten Bindemittels, welche für
a homogeneous distribution of the fine powder determine the alle Mörtel einheitlich gehalten wurde. Neben verschiedenen
efficiency of the final product. Therefore, five different types TiO2-Konzentrationen wurde auch die Anwendung des TiO2
of TiO2 were selected for mortar tests (Table 1). The selected innerhalb der Versuche variiert. Es stellte sich dabei heraus, dass
powders cover four standard TiO2 in the anatase modifica- die Anwendung des TiO2 in Pulverform oder als Suspension
tion (TiO2 A-D) as well as one carbon-doped TiO2 (TiO2 E) auf Wasserbasis für die Durchführung der Versuche geeignet ist.
of which the particle size distribution (PSD) is comparable to Das trockene Pulver wurde dem Zement beigemengt, wohin-
the PSD of the non-doped powder acting in the UV-A range gegen die Suspension dem Anmachwasser zugegeben wurde.
(TiO2 D). Test mortars containing 3 %, 5 % and 10 % TiO2 are Weiterhin wurde der Einfluss unterschiedlicher Oberflächen-
produced. The mix design of the composed mortars is given in strukturen durch eine Nachbearbeitung der Ober- und Un-
Table 2. The TiO2 content is based on the binder mass of the terseite der Proben berücksichtigt. Die Unterseite der erhär-
reference mortar which will be the same for all tested powder. teten Platten wurde sandgestrahlt, um diese Seite aufzurauen
Besides varying powder contents, the application technique of und einen die TiO2-Partikel bedeckenden Zementschleier zu
the powder was changed during the experiments. Applying the entfernen. Die Oberseite der Proben wurde durch Anschleifen
TiO2 as dry powder or water based suspension was suitable for geebnet. Anschließend wurden die nachbearbeiteten Platten
the experiments in the lab. The dry powder was added com- entsprechend dem in Teil 1 erläuterten Versuchsablauf getestet.
bined with the binder whereas the suspension was added with
In Bild 5 sind die Ergebnisse aller Proben, die mit einer 3 %-igen
Tab. 1: Properties of deployed TiO2 TiO2-Suspension hergestellt wurden, dargestellt. Die experi-
Eigenschaften der verwendeten TiO2 mentellen Daten belegen eindeutig die Abhängigkeit zwischen
TiO2 A TiO2 B TiO2 C TiO2 D TiO2 E‡
Abbaurate und Feinheit des TiO2 (Bild 5 und Tabelle 1). Dies
Specific density [g/cm3]
entspricht den Erwartungen aufgrund einer erhöhten spezi-
3.9* 3.94 3.9 3.9* 3.9* fischen Oberfläche, die beispielsweise im Fall des TiO2 C um
Reindichte [g/cm3]
Characteristic particle sizes [μm]/Charakteristische Teilchengröße [μm] 30 % höher ist als für das Produkt TiO2 B. Weiterhin konn-
d0.1 0.65# 1.193 0.641# 0.593# 0.574#
d0.5 1.245# 2.72 2.104# 2.014# 2.075# Tab. 2: Mortar composition
d0.9 2.487# 6.535 7.123# 4.349# 4.92# Mörtelzusammenstellung
Surface area (computed)/Oberfläche (berrechnet)
Reference mortar
Specific surface [cm2/g] 3 % TiO2 5 % TiO2 10 % TiO2
15 847# 7 916 11 910# 13 139# 13 113# Referenzmörtel
Spezifische Oberfläche [cm2/g]
[dm³/m³] [kg/m³] [kg/m³] [kg/m³] [kg/m³]
Specific surface [m2/cm3]
6 181# 3 115 4 645# 5 195# 5 114# CEM I 52.5N 195.8 600.0 600.0 600.0 600.0
Spezifische Oberfläche [m2/cm3]
Sand 0 –2 490.6 1300.0 1 300.0 1 300.0 1 300.0
‡ carbon-doped TiO2/kohlenstoffdotiertes TiO2
TiO2 – – 18.0 30.0 60.0
* taken from data sheet/aus Datenblatt entnommen
# based on measured agglomerates/basierend auf gemessenen Agglomeraten Water/Wasser 250.0 250.0 250.0 250.0 250.0
ZKG INTERNATIONAL No. 10-2008 (Volume 61) 79Materials Science
50 50
45 Dry powder 45 3% TiO2 E
Suspension
40 40 5% TiO2 E
Degradation rate [%]
Degradation rate [%]
35 35
30 30
25 25
20.8
20 18.1 20
16.5
15 15
11.2 10.4
10 9.4
10
6.2
5 5 3.1 3.9
2.2 2.6
0 0
3 5 10
10W/m2 UV-A 10W/m2 VIS-L 20W/m2 VIS-L
TiO 2 content [M.-%]
6 Influence of varying powder contents on the degradation rate for 7 Performance of doped photocatalyst in dependence on the light
TiO2 B source
Einfluss unterschiedlicher Photokatalysatorkonzentrationen auf die Effizienz dotierter Photokatalysatoren in Abhängigkeit der Bestrah-
Abbaurate von TiO2 B lungsquelle
the mixing water. Furthermore, the influence of different sur- te die Effizienz des NO-Abbaus durch die Verwendung eines
face conditions is considered by different treatment of the bot- dotierten TiO2 erhöht werden. Dieses modifizierte TiO2 nutzt
tom and top side of the produced slabs. The bottom side of the sowohl UV-A-Strahlung als auch größere Teile des sichtbaren
hardened slabs was sandblasted in order to remove a covering Lichts. Bild 6 zeigt die Ergebnisse für die sandgestrahlte Oberflä-
cement layer from the TiO2 particles and to roughen this side. che der Proben mit TiO2 B für verschiedene Konzentrationen
The top side of the slabs was ground in order to equalize this und Anwendungsarten. Es wird deutlich, dass mit steigender
surface. The produced and pretreated concrete slabs are tested TiO2-Konzentration die NO-Abbaurate ebenfalls zunimmt.
according to the procedure described in part 1. Ebenso zeigt sich, dass höhere Umsatzraten durch die Verwen-
dung einer Suspension erreicht werden können. Der Vorteil
In Figure 5 the results for all samples containing the 3 % suspen- einer besseren und homogeneren Verteilung des TiO2 wird
sion of TiO2 are shown. The experimental data show a clear anhand der höheren Umsatzraten der Proben mit einer Kon-
dependence on the fineness of the powder (Fig. 5 and Table 1). zentration von 3 % bzw. 5 % TiO2 eindeutig bestätigt. Hier-
This is in line with the expectations caused by the higher specif- bei ermöglicht die Verwendung des pulverförmigen TiO2 als
ic surface area of e.g. TiO2 C, which is about 30 % higher than Suspension eine homogenere Verteilung der Partikel innerhalb
the surface area of TiO2 B. Furthermore, the effectiveness of the der Matrix. Der NO-Abbau in Abhängigkeit von der verwen-
degradation of NO could be increased for the doped TiO2 E deten Lichtquelle ist in Bild 7 für ein dotiertes TiO2 dargestellt.
as this modified powder uses UV-A radiation as well as bigger Im Vergleich mit Bild 5 zeigt das dotierte TiO2 E eine höhere
parts of the visible light. In Figure 6 the results of the sandblast- Effizienz als das nicht dotierte TiO2 D. Obwohl der Beitrag
ed surface for TiO2 B are shown for varying powder contents im Bereich des sichtbaren Lichts (Messbereich des VIS-L-
and application methods. The test results clearly show that with Sensors 500 – 640 nm) als eher gering einzustufen ist, wird die
increasing powder content the degradation rate also increases. UV-A-Strahlung im Übergangsbereich zum sichtbaren Licht
Furthermore, it is obvious from Figure 6 that higher conversion ( 380 nm) und im Farbbereich Violett-Blau ( 500 nm)
rates can be obtained when the powder is applied as suspension. effizienter genutzt. Dies führt zu einer Erhöhung der photo-
The advantage of a better distribution of the powder can be katalytischen Aktivität in diesem Bereich sowie zu einer Erhö-
shown by the higher conversion rates of the slabs containing hung der Leistungsfähigkeit des Gesamtsystems [3].
3 % and 5 % TiO2 as suspension. Here, applying the powder as
suspension added to the mixing water allows a better and more 2 Habitus des Photokatalysators im Mikrogefüge
homogeneous distribution of the powder. The degradation of Es wird davon ausgegangen, dass TiO2 inert ist und sich somit
NO in dependence on the light source for a doped TiO2 pow- nicht an den Reaktionen im Beton während der Hydratation
der is shown in Figure 7. In comparison with Figure 5, the doped beteiligt. Aus diesem Grund wird keine Änderung der Gestalt
TiO2 E shows a better performance as the non-doped TiO2 D. des TiO2 im Betongefüge erwartet. Ziel der mikroskopischen
Although the contribution in the visible light spectrum (measur- Untersuchungen war erstens, TiO2 im Mikrogefüge der un-
ing range of the VIS-L sensor 500 – 640 nm) is marginal, the UV- tersuchten Mörtelproben zu identifizieren, bei denen TiO2
A radiation is used more efficiently in the higher UV-A range während des Mischvorgangs zugegeben wurde, sowie zweitens,
( 380 nm) and the lower visible light range ( 500 nm) die Gestalt der mittels Sprühen auf ebene Mörtelproben aufge-
as the relative photo catalytic activity is enhanced in this brachten TiO2-Beschichtungen zu untersuchen. Bei Letzterem
range [3] and increases the overall performance of the TiO2 E. ist es von besonderem Interesse, inwieweit TiO2 vom Gefüge
aufgenommen wird, wenn die Beschichtung frisch in frisch her-
2 Catalyst morphology in the microstructure gestellt wird. Daraus abgeleitete Erkenntnisse sollten Hinweise
Titanium dioxide is expected to be inert to the hydration reac- zur effizienteren Nutzung von TiO2 im Hinblick auf dessen
tions of concrete. Therefore, no morphological change is ex- reaktive Oberfläche geben. Im Rahmen der mikroskopischen
80 ZKG INTERNATIONAL No. 10-2008 (Volume 61)Materials Science
pected when analyzing Analyse wurde ein Zeiss
samples containing TiO2. 1550 HR-SEM Elektro-
600
Aim of the microscopical nenmikroskop verwendet.
analysis was to identify 0
Die Proben wurden in
first TiO2 in the matrix unbeschichtetem Zustand
of mortar samples, where mit geringen Beschleu-
it was mixed in bulk, and nigungsspannungen un-
Counts
second, to observe the Si tersucht. Bei Proben, die
morphology of sprayed Ca
photokatalytisches Mate-
TiO2 coatings on plain Ti
rial homogen verteilt im
mortar samples. Here, it Gefüge enthalten, wurde
A1
is of special interest how TiO2 mittels energiedis-
Mg Ca
far TiO2 is absorbed by 0
persiver Röntgenstrah-
the matrix when being 0.000 keV 6.155 lenanalyse (EDX) fest-
sprayed on fresh mortar gestellt (Bild 8). Das Auf-
substrates. This should 8 Energy dispersive X-ray spectroscopy of a paving stone top-layer with TiO2 mixed finden einzelner Primär-
give an indication of in bulk (accelerating voltage: 10 keV, live time: 140 sec) und Sekundärpartikel war
the most efficient use of Energiedispersive Röntgenspektroskopie der Deckschicht eines Pflastersteines mit jedoch nicht möglich. Es
photocatalysts regarding eingemischtem TiO2 (Beschleunigungsspannung: 10 keV, Messdauer: 140 s) wird angenommen, dass
the available reactive sur- ein einfacher Nachweis
face. For this analysis a Zeiss 1550 HR SEM was applied. The mittels der Detektion von Rückstreuelektronen durchgeführt
samples have been scanned in the uncoated state with low ac- werden kann, da hierbei die deutlich höhere Ordnungszahl des
celeration voltage. For the samples containing the photocatalyst Titans das TiO2 im Vergleich zu den Hydratationsprodukten
dispersed in the whole matrix, TiO2 was detected with integral heller erscheinen lässt. Aufgrund der fehlenden Probenpräpara-
energy dispersive X-ray spectroscopy scans (Figure 8). However, tion und der zu niedrigen Beschleunigungsspannungen konnte
the detection of single primary or secondary particles did not eine solche Darstellungsweise jedoch nicht verwendet werden.
succeed in this case. It is assumed that an evidence of anatase
can be obtained by using backscattered electron images tak- Im Gegensatz zu den Proben, die TiO2 homogen im Gefü-
ing advantage of the higher average atomic number of TiO2 ge verteilt enthalten, konnten bei den mit TiO2 beschichteten
compared to the other hydration products. Due to the missing Proben deutlichere Beobachtungen gemacht werden. Hierbei
coating of the samples and the low acceleration voltage, the use wurden Beschichtungen mit Filmdicken von mehr als 1 μm
of backscattered images was not possible for this investigation. Dicke gemessen. Die Schichtdicke variiert dabei in Abhängig-
keit von der Oberflächenbeschaffenheit der Mörtelsubstrate. In
In contrast to the bulk mixed samples, the coated samples result Bild 9 ist hierzu beispielhaft die Oberfläche einer Beschichtung
in more distinct results. Here a homogeneous TiO2 film of part- dargestellt, die in der unteren Bildhälfte in eine Bruchfläche
ly more than 1 μm thickness was observed. The layer thickness übergeht. In dieser Darstellung sind Primärpartikel mit Korn-
varies due to the surface roughness of the mortar specimens. größen von 30 bis 50 nm zu erkennen. Basierend auf der Tat-
Figure 9 shows the surface of a coating with a fracture surface in sache, dass die Beschichtung für diese Probe frisch in frisch
the lower part of the image. From this picture primary anatase aufgebracht wurde, wird angenommen, dass Teile der Suspen-
particles in the size range from 30 to 50 nm can be observed. sion von den oberen Mörtelschichten aufgenommen wurden.
Given that the present coating was sprayed on the fresh surface Diese Annahme wird durch den Nachweis von TiO2-Partikeln
of a before produced mortar substrate of stiff consistency, it is in oberflächennahen Hohlräumen und Poren gestützt. Dieser
assumed that part of the dispersion will be absorbed by the Sachverhalt ist in Bild 10 dargestellt. Ebenso können hier TiO2-
outer mortar layers. This assumption is proven by the fact that beschichtete nadelförmige Hydratphasen festgestellt werden.
internal voids are filled with TiO2 particles, and the presence of Diese weisen große Ähnlichkeit mit Aragonitphasen auf. Deren
anatase coated hydration products as shown in Figure 10. They Anwesenheit kann aber ausgeschlossen werden, da keine Cal-
have morphological similarity with aragonite phases. Their ciumcarbonatquelle vorhanden ist. Weiterhin kann bei diesen
presence, however, can be excluded as no calcium carbonate Proben auch keine deutliche Grenzschicht zwischen Beschich-
source is available. Furthermore, no distinct interface between tung und Mörtelsubstrat festgestellt werden, was für eine struk-
the mortar and anatase phase is observable which again sup- turelle Einbindung des TiO2 spricht.
ports the theory of structural embedding of TiO2 particles.
3 Beschichtung zementgebundener Trägermaterialien
3 Coating of cementitious substrates In den vorherigen Abschnitten wurden Betonwaren diskutiert,
In the previous paragraphs concrete products were discussed, deren funktionale Deckschichten einen homogen verteilten
which contain a photocatalyst homogeneously dispersed in a Photokatalysator enthalten. Dies stellt eine gängige Methode
functional layer. This describes a proven method of attaching des Einbringens eines Katalysators in die Mörtelmatrix dar.
the catalyst to the matrix. However, it is an inefficient system Dennoch ist dieses Verfahren als ineffizient anzusehen, da ein
since most of the cost intensive powder is hidden in the ma- Großteil des TiO2 innerhalb der Matrix gebunden ist und somit
trix, is not exposed to light, and hence will not contribute to a nicht einer Bestrahlung ausgesetzt wird. Insofern ist ein Bei-
degradation process. Higher efficiencies can be obtained while trag dieses TiO2 am Abbauprozess nicht gegeben. Eine größere
applying thin coatings on concrete substrates. In this case, it is Effizienz des eingesetzten TiO2 kann durch die Verwendung
expected that all the material added to the substrate will con- dünner Beschichtungen erreicht werden. In diesem Fall ist da-
tribute to the degradation process. A great amount of literature von auszugehen, dass das gesamte photokatalytische Material
ZKG INTERNATIONAL No. 10-2008 (Volume 61) 81Materials Science
9 A coating of titanium dioxide on a mortar substrate 10 Needle shaped hydration products covered by a layer of titanium
(SEM; magnification: 72.6 k) dioxide particles (SEM, magnification: 101.3 k)
Mit Titandioxid beschichtete Mörtelprobe Nadelförmige Hydratphasen mit einem Überzug von TiO2-Partikeln
(REM, Vergrößerung: 72,6 k) (REM Vergrößerung: 101,3 k)
has been published on photo catalytic coatings on construction der Oberflächenbeschichtung einen Beitrag zum Abbauprozess
materials. In most of these cases a catalyst is mixed with a suit- liefert. In der Literatur sind zahlreiche Veröffentlichungen zu
able binder like cementitious binders, siloxanes or aqueous so- photokatalytischen Beschichtungen von Baustoffen zu finden.
lutions of sodium silicates. A number of problems are involved Meist werden hierbei katalytische Materialien mit geeigneten
with the selection of a suitable binder. Firstly, if no change in Bindemitteln wie Zement, Siloxanen oder wässrigen Natrium-
the appearance of the substrate is allowed, the binder needs to silikatlösungen gemischt. Bei der Auswahl der Bindemittel sind
be transparent or at least translucent to a high degree. Secondly, jedoch einige Punkte zu beachten. So muss zum Beispiel der
the binder should not cover the reactive surface of the catalyst verwendete Bindemitteltyp transparent oder zumindest hoch-
and furthermore not seal the surface of the substrate, especially gradig lichtdurchlässig sein, wenn eine visuelle Veränderung des
when being applied on porous media like concrete or natural zu beschichtenden Bauteils unerwünscht ist. Weiterhin darf ein
stone. Thirdly, the binder needs to resist the decomposing ac- solches Bindersystem weder die reaktive Oberfläche des Kataly-
tion of the catalyst. Therefore, it is recommended to use inor- sators bedecken, noch die Oberfläche des Substrates abdichten,
ganic binders. Due to the above constraints the selection of a insbesondere wenn es sich dabei um poröse Materialien wie
suitable binder is difficult. Based on these considerations it ap- Beton oder Naturstein handelt. Letztlich muss das Bindemittel
pears to be of interest to check the general application of binder auch gegen die zersetzende Wirkung des Photokatalysators re-
free-systems. TiO2 particles are very fine powder systems, often sistent sein. Das bedeutet, dass anorganischen Bindemitteln der
having primary particle sizes in the nano-range.Therefore, they Vorzug zu geben ist. Aufgrund dieser Einschränkungen gestaltet
will provide high adhesive forces to the substrate. Nevertheless, sich die Auswahl eines geeigneten Bindemittelsystemes schwie-
coating systems on concrete elements need to withstand harsh rig. Daher erscheint es sinnvoll, die Anwendung bindemittel-
environmental impacts, even if they are not exposed to direct freier Systeme zu untersuchen. TiO2-Partikel stellen sehr feine
mechanical loads like abrasion due to wheel loads. Partikelsysteme dar, oft mit Teilchengrößen im Nanobereich.
Bedingt durch die geringe Teilchengröße weist das TiO2 eine
3.1 Experimental work hohe Adhäsionswirkung zum Substrat auf. Dennoch müssen
In order to investigate the effect of different application types Betonbeschichtungssysteme den rauen Einflüssen der Umwelt
on the degradation rate, aqueous suspensions of one anatase standhalten, auch wenn keine direkten mechanischen Einwir-
type are produced. In this case 2.5 % and 5 % (m/m) disper- kunken durch Radlasten zu erwarten sind.
sions are used. These suspensions are produced following a
fixed procedure of alternating high-speed stirring and sonica- 3.1 Experimentelle Durchführung
tion steps. From each suspension an amount of 5 g was sprayed Um den Einfluss unterschiedlicher TiO2-Applikationsarten auf
on a mortar substrate. This is done with a reference mortar in die Umsatzraten zu untersuchen, wurden wässrige Suspensi-
an already hardened state (after 28 days), and with freshly pro- onen eines TiO2-Präparates hergestellt. Es handelt sich hierbei
duced mortar samples (fresh in fresh). For every single system um eine 2,5 %- und eine 5 %-(M/M-)Suspension. Diese Sus-
two samples are produced. The following analysis is based on pensionen wurden nach einem definierten Herstellungsprozess
the average of two samples. mit abwechselnder Hochgeschwindigkeitsmischung und Ultra
schallbehandlung hergestellt.Von jeder Suspension wurden 5 g
3.2 Analysis of photo catalytic coatings mittels einer Sprühpistole auf jeweils eine Referenzmörtel-
The degradation rates of the different coating systems are de- probe aufgebracht. Dabei wurden bereits ausgehärtete Mörtel
termined following the measurement procedure introduced (nach 28 Tagen) sowie frisch hergestellte Mörtel („frisch in
in part 1. The adjustable parameters are kept constant at 50 % frisch“) verwendet. Für jedes System wurden zwei Proben an-
relative humidity, 3 l/min volumetric flow rate, 1 ppmv pollut- gefertigt, wobei sich die nachfolgende Analyse jeweils auf die
ant concentration and 10 W/m2 of UV-A irradiance. From the Mittelwerte bezieht.
82 ZKG INTERNATIONAL No. 10-2008 (Volume 61)Materials Science
100 1.2
Fresh substrate
90
Hardened substrate 80.6 1
80
77.6
Degradation rate [%]
Concentration [ppmv]
70
0.8
60 Hardened substrate
50 0.6 Fresh substrate
40
0.4
30
20 14.4 0.2
10 8.0
0 0
2.5 5.0 0 5 10 15 20 25 30 35 40 45
TiO2 content [M.-%] Time [min]
11 Different coating systems and catalyst concentrations regarding the 12 Increasing degradation rate of coating systems sprayed on hard-
NO degradation rate ened substrates
Vergleich verschiedener Beschichtungssysteme und Katalysator- Zunehmende Umsatzraten von Beschichtungssystemen, bei denen
konzentrationen im Hinblick auf die NO-Abbaurate erhärtete Substrate verwendet wurden
results presented in Figure 11 it becomes clear that the anatase 3.2 Analyse photokatalytischer Beschichtungen
dosage of the suspension used hardly influences the perform Die Abbauraten der verschiedenen Beschichtungssysteme wur-
ance of the system. Both concentrations, 2.5 % and 5 %, show den nach dem in Teil 1 beschriebenen Schema berechnet. Die
degradation rates of about 80 %. This observance suggests that variablen Parameter wurden auf konstant 50 % relative Luft-
for both systems a complete coverage of the surface with TiO2 feuchtigkeit, 3 l/min Durchflussrate, 1 ppmv Schadstoffkon-
particles is obtained, i. e. the effective reactive surface is about zentration sowie 10 W/m2 Bestrahlungsstärke eingestellt. Aus
the same. Hence, an “optimum” catalyst concentration would den in Bild 11 dargestellten Ergebnissen wird deutlich, dass die
in this case be below the applied dosage. An optimum dos- auf bereits erhärteten Proben verwendeten unterschiedlichen
age is considered to result in a homogeneous layer of catalyst Anataskonzentrationen kaum die Leistung der photokataly-
with a thickness of one particle. The above-stated assumption tischen Reaktion beeinflussen. Proben beider Dosierungen,
of multilayered coatings is confirmed by Figure 9. Here a ho- sowohl 2,5 % als auch 5 %, zeigen Umsatzraten von ungefähr
mogeneous TiO2 layer of at least 30 particles thickness is shown 80 %. Diese Beobachtung lässt darauf schließen, dass die Pro-
for the case of a coated sample. benoberfläche vollständig mit TiO2-Partikeln bedeckt ist, die
reaktive Oberfläche also in etwa gleich ist. Daraus folgt, dass
On the other hand, the application of the same suspension on eine „optimale“ Photokatalysatorkonzentration deutlich unter
a fresh substrate resulted in a distinct loss of degradation abil- der hier verwendeten liegt. Unter optimaler Photokatalysator-
ity. The reason for this decrease is assumed to be caused by konzentration ist in diesem Fall die vollständige Bedeckung
the absorption of the suspension from the surface by the set- der Probenoberfläche mit einer Monoschicht von TiO2-Parti-
ting mortar substrate. This again is confirmed by the fact that keln zu verstehen. Die Annahme einer multischichtdicken Be-
TiO2 was found in the near-surface voids and cavities of those schichtung wird durch Bild 9 bestätigt. Hier ist eine homogene
samples as given in Figure 10. Here TiO2 covered hydration Lage von TiO2-Partikeln mit einer Mächtigkeit von mindestens
phases can be observed. This evidence of structurally embed- 30 Primärpartikeln zu erkennen.
ded photocatalyst leads to the expectation of a higher resistance
of these systems compared to coatings sprayed on already hard- Auf der anderen Seite zeigt die Anwendung der „frisch in
ened substrates. The tested samples are meanwhile subject of an frisch“-Technik deutlich verringerte Umsatzraten. Der Grund
accelerated aging process and are going to be tested at a later dafür wird darin vermutet, dass während des Abbinde- und
date again. Aushärtevorganges große Mengen der TiO2-Suspension vom
Mörtelgefüge absorbiert werden und somit nicht mehr für die
Besides a notable drop in the performance the fresh systems Reaktion zur Verfügung stehen. Diese Annahme wiederum
also show a difference depending on the deployed catalyst con- wird durch die Anwesenheit von TiO2 in oberflächennahen
centration. In the present case the system using a 2.5 % suspen- Poren und Hohlräumen gestützt, was in Bild 10 dargestellt ist.
sion shows a degradation rate of 8.0 % whereas the 5 % system Dort können TiO2-überzogene CSH-Phasen festgestellt wer-
achieves a degradation rate of 14.4 %. Both, the degradation den. Dieser Nachweis strukturell fest eingebundener photoka-
rates and original catalyst concentrations, show a factor of talytisch aktiver Partikel führt zu der Annahme einer höheren
about 2. Therefore, a linear dependency of the degradation rate Dauerhaftigkeit der „frisch in frisch“-Systeme gegenüber den
and catalyst dosage seems to apply. Another interesting observa- erst im erhärteten Zustand beschichteten Proben. Zu diesem
tion refers to the progress of degradation during the course of Zweck werden die verwendeten Proben gegenwärtig einer be-
the 30 minutes test procedure. Whereas previous experiments schleunigten Alterung unterzogen, um später konkrete Aussa-
always showed steady or slightly decreasing conversion rates, gen zur Dauerhaftigkeit der Systeme in Bezug zum Beschich-
all samples on hardened substrate resulted in increasing con- tungsverfahren machen zu können.
version rates during the present experiments. An example is
ZKG INTERNATIONAL No. 10-2008 (Volume 61) 83Materials Science
given in Figure 12. This observation is new and to the authors’ Neben dem deutlichen Abfall der Leistungsfähigkeit der „frisch
knowledge not referred to in literature before. An attempt to in frisch“-Systeme zeigen hier auch die verschiedenen TiO2-
explain this behaviour is linked to the multilayered structure Dosierungen Unterschiede auf. Im vorliegenden Fall erreicht
of the coating. The layer thickness of the hardened systems is die 2,5 % -ige Suspension eine Umsatzrate von 8,0 % während
much bigger compared to the fresh substrates since most of the die 5 % -ige Suspension eine Umsatzrate von 14,4 % erzielt.
materials remains on the surface. It is conceivable that during Beide Verhältnisse, Umsatzraten sowie TiO2-Konzentrationen,
the course of experiment more NO is absorbed by deeper lay- weisen ungefähr einen Faktor 2 auf, sodass von einer linearen
ers of the dense catalyst coating. Due to the dense structure of Abhängigkeit beider Größen auszugehen ist. Eine andere in-
this layer, the diffusion of NO and NO2 takes more time with teressante Beobachtung betrifft den Verlauf des NO-Abbaus
increasing depth. This could lead to an additional absorption innerhalb des 30-minütigen Tests. Während bei früheren Ex-
effect, independent from the first prominent absorption peak. perimenten die Umsatzraten im Verlauf der Versuchsdurchfüh-
Furthermore, due to the high refractive index of the TiO2 UV- rung allmählich abnahmen oder zumindest konstant blieben,
A radiation can possibly get access to a few layers underneath zeigen alle Proben, die im erhärteten Zustand beschichtet
the top particle layer. That means deeper layers can maybe con- wurden, konstant ansteigende Umsatzraten. Hierfür ist in Bild
tribute to some extent to the degradation process. 12 ein Beispiel gegeben. Diese Beobachtung ist neu und nach
Kenntnis der Verfasser noch nicht in der Literatur erwähnt. Ein
Acknowledgment Erklärungsversuch dieses Phänomens bezieht sich auf die Mul-
The authors wish to express their sincere thanks to the European tilagenstruktur der Beschichtung. Die Schichtdicke ist bei den
Commission (I-Stone Project, Proposal No. 515762-2) and the erhärteten Systemen deutlich dicker als bei den frisch in frisch
following sponsors of the research group: Bouwdienst Rijks hergestellten Proben. Dadurch verbleibt mehr Material auf
waterstaat, Rokramix, Betoncentrale Twenthe, Betonmortel- der Oberfläche. Es wird angenommen, dass sich während der
centrale Flevoland, Graniet-Import Benelux, Kijlstra Beton, Durchführung des Versuchs NO auch an TiO2-Oberflächen
Struyk Verwo Groep, Hülskens, Insulinde, Dusseldorp Groep, tieferer Lagen anlagern kann. Aufgrund der dichten Struktur
Eerland Recycling, Enci, Provincie Overijssel, Rijkswaterstaat der Beschichtung nimmt die Dauer der Diffusion von NO und
Directie Zeeland, A&G Maasvlakte, BTE and Alvon Bouw NO2 in tiefere Lagen mit dem Abstand zur Oberfläche zu. Dies
systemen (chronological order of joining). kann zu einem zusätzlichen Adsorptionsprozess, unabhängig
von der ersten deutlich erkennbaren Adsorptionskurve, führen.
Weiterhin könnte aufgrund des hohen Brechungsindex von
Literaturverzeichnis/Literature TiO2 UV-A Strahlung auch in tiefere Lagen der Beschichtung
gelangen. Somit könnten die TiO2-Partikellagen, welche direkt
[1] Hunger, M.; Hüsken, G.; Brouwers, J.: Photocatalysis: Photocatalysis der Oberfläche nachfolgen, auch zu einem geringen Teil zum
applied to concrete products - Part 2: Influencing factors and prod- Abbau von NO beitragen.
uct performance, ZKG INTERNATIONAL 61 (2008), No. 8 pp.
77–85.
[2] Herrmann, J. M.; Péruchon, L.; Puzenat, E.; Guillard, C.: Photoca- Danksagung
talysis: From fundamentals to self-cleaning glass application, Proceed- Die Autoren möchten der Europäischen Kommission (Projekt
ings International RILEM Symposium on Photocatalysis, Environ- I-Stone, Vorschlag Nr. 515762-2) und folgenden Sponsoren
ment and Construction Materials 8–9 October 2007, Florence, Italy, der Forschungsgruppe: Bouwdienst Rijkswaterstaat, Rokra-
Eds. P. Baglioni and L. Cassar, RILEM Publications, Bagneux, France,
pp. 41–48.
mix, Betoncentrale Twenthe, Betonmortelcentrale Flevoland,
[3] Blöß, S. P.; Elfenthal, L.: Doped titanium dioxide as a photocatalyst Graniet-Import Benelux, Kijlstra Beton, Struyk Verwo Groep,
for UV and visible light, Proceedings International RILEM Sym- Hülskens, Insulinde, Dusseldorp Groep, Eerland Recycling,
posium on Photocatalysis, Environment and Construction Materials Enci, Provincie Overijssel, Rijkswaterstaat Directie Zeeland,
8–9 October 2007, Florence, Italy, Eds. P. Baglioni and L. Cassar, A&G Maasvlakte, BTE und Alvon Bouwsystemen (in chrono-
RILEM Publications, Bagneux, France, pp. 31–38.
[4] Beeldens, A.: Air purification by road materials: results of the test
logischer Reihenfolge ihres Beitritts) ihren aufrichtigen Dank
project in Antwerp, Proceedings International RILEM Symposium aussprechen.
on Photocatalysis, Environment and Construction Materials 8–9
October 2007, Florence, Italy, Eds. P. Baglioni and L. Cassar, RILEM
Publications, Bagneux, France, pp. 187–194.
84 ZKG INTERNATIONAL No. 10-2008 (Volume 61)You can also read