Phylogenetic analyses of Eurasian lynx (Lynx lynx Linnaeus, 1758) including new mitochondrial DNA sequences from Iran
←
→
Page content transcription
If your browser does not render page correctly, please read the page content below
www.nature.com/scientificreports
OPEN Phylogenetic analyses of Eurasian
lynx (Lynx lynx Linnaeus, 1758)
including new mitochondrial DNA
sequences from Iran
Farshad Behzadi1, Mansoureh Malekian1, Davoud Fadakar1*, Mohammad Ali Adibi2 &
Eva V. Bärmann3
The Eurasian lynx (Lynx lynx) is one of the widespread felids in Eurasia; however, relatively little
is known about the Asian subspecies, and especially the Iranian populations, which comprise the
most southwestern part of its range. The current study aimed to assess the phylogenetic status of
Iranian populations relative to other populations of Eurasia, by sequencing a 613 bp fragment of the
mitochondrial control region. In total, 44 haplotypes were recorded from 83 sequences throughout
Eurasia, two of which were found in Iran. The haplotype (H1) is dominant in all Iranian lynx populations
and identical to specimens from SW Russia and central China. The second haplotype (H2) is unique
and was recorded only from Ghazvin Province in the central Alborz Mountains. Both haplotypes occur
in Ghazvin Province. The phylogenetic tree and a median-joining network identified four clades (i.e.,
East, West 1, West 2, and South). These results are congruent with previous studies and suggest that
Eurasian lynx was restricted to the southern part of its range during the glacial maxima and expanded
from there to East Asia and to Europe during several independent re-colonization events. The
Caucasus region most like plays an important role as a refugium during glacial cycles.
Eurasian lynx (Lynx lynx Linnaeus, 1758) is one of the widespread felids in Eurasia, distributed from western
Norway to east of the Kamchatka Peninsula in the Russian Far E ast1–3. The species has been classified as ‘Least
Concern’ in the IUCN red list due to its wide range and stable populations in E urope4; however, status and trend
vary greatly across its r ange1,4.
Based on the morphological differences, 11 subspecies have been recognized for the Eurasian lynx5. How-
ever, only six subspecies are proposed by the IUCN Cat Specialist Group, including northern lynx (L. l. lynx),
Balkan lynx (L. l. balcanicus), Carpathian lynx (L. l. carpathicus), Caucasian lynx (L. l. dinniki), Turkestan lynx
(L. l. isabellinus), and Siberian lynx (L. l. wrangeli)6. Iranian populations of the Eurasian lynx are assigned to L.
l. dinniki7, distributed in Caucasus Mountains, Asia Minor, Iraq, and Iran6.
Caucasian lynx is broadly, but patchily, distributed across Iran in a variety of habitats, including the Hyrcanian
forests along Alborz Mountain Range, Zagros oak forests from the north-west towards the south-west, and the
semi-arid highland steppes of southern Alborz Mountain Range as far as north-eastern Iran8,9. The subspecies is
currently listed as “protected” under Iranian environmental conservation laws and regulations. Habitat destruc-
tion and fragmentation are suggested to be the main threats, which occur particularly through deforestation
(expansion of agricultural and residential areas) in north and northwestern I ran8,10.
The evolutionary history and population genetics of the Eurasian lynx have received much attention in
Europe and Siberia11–17. Three phylogenetic clades have been described which overlap partially, suggesting a
common evolutionary history of the lynx populations until recent t imes15,17. Gugolz et al.17 suggested a postglacial
recolonization scenario for the Eurasian lynx in Europe after the Last Glacial Maximum. In another large scale
phylogenetic study, using mitochondrial control region and cytochrome b sequences as well as microsatellites,
Rueness et al.15 found that the most ancient lynx lineage exists in central Asia, proposing that Eurasian lynx
populations originated in central Asia and expanded to north-western Siberia and Scandinavia after the Last
Glacial Maximum. Lucena-Perez et al.16 studied the genomic patterns of five out of the six subspecies; however,
no samples of L. l. dinniki were included. Thus, the phylogenetic status of this subspecies remained unclear.
1
Department of Natural Resources, Isfahan University of Technology, 84156‑83111 Isfahan, Iran. 2Department of
Environmental Science, Science and Research Branch, Islamic Azad University, Tehran, Iran. 3Zoological Research
Museum Alexander Koenig, Adenauerallee 160, 53113 Bonn, Germany. *email: davoudfadakar@gmail.com
Scientific Reports | (2022) 12:3293 | https://doi.org/10.1038/s41598-022-07369-z 1
Vol.:(0123456789)
www.nature.com/scientificreports/
Figure 1. Distribution of subspecies of L. lynx based on the morphological data and CR sequences. Yellow (L.
l. wrangeli), pink (L. l. lynx), green (L. l. carpathicus), light blue (L. l. isabellinus), blue (L. l. dinniki), and doted
light blue (L. l. balcanicus) polygons correspond to the distribution based on the six suggested subspecies by the
IUCN Cat Specialist Group6 which are modified from distribution map of L. lynx4, circle and triangle represent
samples sequenced for CR and showed four recognized clades. Different shades of gray represent different
altitudes.
Although a large portion of the lynx’s distribution occurs in Asia, insufficient sampling left a large gap of
knowledge in the natural history and phylogenetic status of this species, particularly in southwestern Asia includ-
ing Iran. Current knowledge of the Eurasian lynx in Iran is limited to studies which addressed the distribution
of the species8,10. Phylogenetic status and genetic diversity of the subspecies are yet to be investigated. Under-
standing of the evolutionary history and molecular genetic variation of the subspecies is necessary to develop
management and conservation plans. The current study aimed to assess the phylogenetic relationship of Iranian
lynx populations in relation to other populations using mitochondrial DNA (mtDNA) control region sequence
variation. Control region is a non-coding and fast evolving sequence of the mitochondrial g enome18,19 which is
a standard marker in population genetic analysis of mammals20–22 and has been used in phylogenetic studies of
the Eurasian lynx across E urasia11–13,15,17.
Results
In total, the control region (CR) fragment of 15 samples of Iranian lynx was successfully amplified. All new
mtDNA sequences were submitted to GenBank (accession numbers OM743776-OM743790). These sequences
were aligned with 68 published Eurasian lynx D-loop sequences, retrieved from GenBank. The available mtDNA
sequences were slightly trimmed to match our sequence length, therefore we added only 38 instead of 48 hap-
lotypes detected by Rueness et al.15, plus five haplotypes from other s ources12,13 (Fig. 1). A complete list of the
mtDNA sequences and corresponding haplotypes used in the present study are given in Supplementary Table S1,
supporting information.
Haplotype network. Based on 613 base pairs (bp) of CR from 83 mtDNA sequences, 44 unique haplotypes
(including one new haplotype from Iran) were defined by 61 variable sites. The overall level of genetic variability
in Iran was very low with only two haplotypes (H1 and H2) found. A median-joining (MJ) network illustrating
the relationship between Eurasian lynx haplotypes is depicted in Fig. 2. Four haplogroups can be differentiated:
South, West 1, West 2, and East.
Haplotype H1 was the most common haplotype among Iranian samples, occurring in 86% of Iranian samples
(13 individuals) and was identical with EU818858 from Southwest Russia (approximate latitude and longitude:
43.2, 44.35) and EU818861 central China (approximate latitude and longitude: 37.3, 100). H1 belongs to hap-
logroup South.
The second haplotype H2 was unique, occurring only in two specimens (GHZV1 and GHZV2) from Ghazvin
Province in the south of the Caspian Sea (approximate latitude and longitude: 35.36, 49.14). H2 was connected
to H37 in the Caucasus region, and formed part of haplogroup East (Fig. 2). In contrast, another sample from
Ghazvin (GHZV3) was found to possess H1. Therefore, both recorded haplotypes for Iran occur in Ghazvin
Province in central Alborz Mountain Range.
Phylogenetic analysis. In the preliminary analyses, Lynx canadensis (AY319505) rooted the tree within
the South clade between (H1, H25, H26, H27) and the remaining haplotypes, Lynx pardinus (KF561247) between
H26 and the remaining haplotypes, while Lynx rufus (NC014456), Caracal caracal (KP202272), and Leopardus
jacobita (FJ960826) rooted the tree within the East clade (large polytomy). Including all outgroup representatives
lead to a badly resolved tree with a huge polytomy (within the South clade) at the base of the ingroup.
The phylogeny from the ingroup-only analysis showed two separate groups, a southern group (posterior
probability (PP) = 1, Fig. 3) with samples from southern Eurasia (South clade), and a northern group comprising
samples from northern Eurasian localities. The northern group was further subdivided into one paraphyletic
Scientific Reports | (2022) 12:3293 | https://doi.org/10.1038/s41598-022-07369-z 2
Vol:.(1234567890)www.nature.com/scientificreports/
Figure 2. Median-joining network based on CR gene depicting the relationships between the main four
groups described for Eurasian lynx including East (purple), South (red), West 1 (blue), and West 2 (turquoise).
The colors correspond to the respective clades in the phylogenetic tree. Additional details of haplotypes and
accession numbers are provided in Supplementary Table S1, supporting information. Black small dots represent
missing haplotype, circle sizes are proportional to haplotype frequencies, and numbers are haplotype numbers.
H1 and H2 were found in Iran.
Asian group (East clade) and two monophyletic European groups (West 1 (PP = 0.9) and West 2 (PP = 0.92),
Fig. 3). This pattern corresponds with the haplotype network (Fig. 2). Accordingly, the new mtDNA sequences
from Iran belonged to both, the southern and the northern groups. In the analysis with the trimmed alignment
(326 bp) only one split was well supported (PP = 1, Supplementary Fig. S1): the split between the southern group
and the northern group. The haplotype from the Balkan region grouped with our clade South in the analysis with
the trimmed alignment (including only the 326 bp also present in Lucena-Perez et al.16, Supplementary Fig. S1).
The four other haplotypes of Lucena-Perez et al. were included in the northern group, but no further structure
within this northern group was recovered.
In the time-calibrated CR mitochondrial phylogeny, the split between Eurasian lynx and other lynx species
(L. rufus, L. pardinus, and L. canadensis) is well supported (PP = 1, Supplementary Fig. S2). The split of European
lynx and the sister species Canadian lynx was estimated to have occurred around 45.6 kya (95% confidence
interval [CI]: 30.8–62.4 kya). Within Eurasian lynx, the northern group (West 1 + West 2 + East) was found
monophyletic and well supported (PP = 0.97), with the corresponding split from the southern group dated to
around 15.7 kya (95% CI: 9.7–22.4 kya). However, each of the four subclades found in the ingroup-only analysis
and the haplotype network (South, West 1, West 2, and East) did not receive support from posterior probabili-
ties (PP < 0.7 in all four groups), so reporting on the divergence times between these groups seems inadequate
considering the very limited amount of data for this analysis.
Population differentiation and structure. In order to obtain an overview of the CR genetic diversity
of L. lynx, basic molecular diversity indices were determined for the species and for three proposed subspe-
cies that correspond to the geographic groups of southern, eastern, and western samples (Table 1). The highest
level of genetic diversity was found in the nominate subspecies L. l. lynx (corresponding to clades West 1 and
West 2) with h: 0.848 ± 0.027 and π: 0.00484 ± 0.00031. The haplotype diversity of L. l. wrangeli (East clade, h:
0.574 ± 0.089) is higher than the L. l. isabellinus (South clade, h: 0.411 ± 0.131; π: 0.00251 ± 0.00122), while its
nucleotide diversity is lower (π: 0.00229 ± 0.00051).
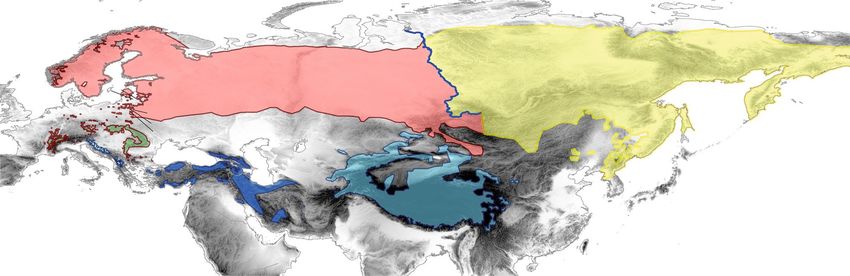
Mismatch distributions were calculated separately for the total group that includes all sequences (Lynx lynx),
as well as for L. l. lynx, L. l. wrangeli, and for L. l. isabellinus (Fig. 4). The mismatch distributions for the total
group (Fig. 4a) and L. l. lynx (Fig. 4b) were unimodal and fully consistent with population expansion, but for
L. l. wrangeli (Fig. 4c) and L. l. isabellinus (Fig. 4d) the graphs showed a pattern that is interpreted to represent
demographic equilibrium. A similar picture is found using R 2 statistic (Table 2), which was significant, and
therefore supporting population expansion, for Lynx lynx (the total group, p < 0.01) and L. l. lynx (p < 0.05), but
Scientific Reports | (2022) 12:3293 | https://doi.org/10.1038/s41598-022-07369-z 3
Vol.:(0123456789)www.nature.com/scientificreports/
Figure 3. Phylogeny of Eurasian lynx based on partial mitochondrial control region sequences. Consensus tree
from Bayesian analysis of 44 haplotypes using the HKY + G substitution model. Numbers at branches indicate
support from posterior probability. The colors of the lines correspond to groups in the haplotype network:
red = South, blue = West 1, turquoise = West 2, purple = East.
n S H h ± std. dev π ± std. dev k
Lynx lynx (all sequences) 172 61 44 0.906 ± 0.012 0.00534 ± 0.00033 3.27173
L. l. isabellinus (South clade) 22 16 6 0.411 ± 0.131 0.00251 ± 0.00122 1.5368
L. l. wrangeli (East clade) 43 16 12 0.574 ± 0.089 0.00229 ± 0.00051 1.40642
L. l. lynx (West 1 + West 2 clades) 107 32 26 0.848 ± 0.027 0.00484 ± 0.00031 2.96632
Table 1. CR mtDNA genetic diversity revealed for proposed subspecies of L. lynx. n number of individuals,
S number of segregating sites, H number of haplotypes, h haplotype diversity, π nucleotide diversity, k mean
number of pairwise differences.
not for L. l. wrangeli and L. l. isabellinus. Fu’s F
s values were highly significant (p < 0.01) for the L. l. lynx, and all
sequences, but it is not significant for the L. l. isabellinus and L. l. wrangeli.
Bayesian skyline plot (BSP) demonstrated apparent evidence of recent increase in the effective population size
in last 10 kya within the Holocene (Fig. 5). Therefore, L. lynx was found under expansion and demographically
increase over the last 10 kya.
Discussion
Population structure and comparison with previous analyses. The distribution of the lynx in Asia
is described as continuous, with demographically healthy and well-connected p opulations15; however, the infor-
mation in most areas is scattered or completely lacking16. Rueness et al.15 identified three main clades for Lynx
lynx (western, eastern, and southern) based on the mtDNA, with an east–west gradient, which do not appear
to correspond to putative subspecies6. Rueness et al.15 proposed the southern clade of Lynx lynx, inhabiting the
Himalayas, and (among others) the Caucasus and other Asian regions, to be the ancestral clade, as it had the
highest level of haplotype diversity, was the most diverse clade in terms of private alleles, and formed the sister
group to the other two groups in their phylogenetic analysis. However, a robust conclusion on the phylogeo-
Scientific Reports | (2022) 12:3293 | https://doi.org/10.1038/s41598-022-07369-z 4
Vol:.(1234567890)www.nature.com/scientificreports/
Figure 4. Mismatch distributions of pairwise differences of CR haplotypes for the L. l. lynx (West 1 clade
and West 2 clade) from northern Eurasia in the west of Yenisey river, L. l. wrangeli (East clade) from northern
Eurasia in the east of Yenisey river, L. l. isabellinus (South clade) from southern Eurasia, and for the whole
species (L. lynx). Depicted are observed (solid black lines) and expected (solid gray lines) frequencies obtained
under a model allowing for demographic expansion.
R2 Fu’s Fs
Lynx lynx (all sequences) 0.0263** − 33.099**
L. l. isabellinus (South clade) 0.1199 (n.s.) − 0.848 (n.s.)
L. l. wrangeli (East clade) 0.0463 (n.s.) − 6.4031 (n.s.)
L. l. lynx (West 1 + West 2 clades) 0.0432* − 12.515**
Table 2. Tests for population expansion for proposed subspecies of L. lynx using R s49. n.s. not
248 and Fu’s F
significant. *Significant (p < 0.05). **Highly significant (p < 0.01).
Scientific Reports | (2022) 12:3293 | https://doi.org/10.1038/s41598-022-07369-z 5
Vol.:(0123456789)www.nature.com/scientificreports/
1000
100
10
1
0 1 2 3 4 5 6 7 8 9
Time
Figure 5. Bayesian skyline plot of mitochondrial DNA control region haplotypes of Eurasian lynx. The x-axis
represents time in thousand years ago (kya) and the y-axis shows effective population size of females (Ne)
multiplied by generation time (T). The solid line shows the median effective population size (NeT) over time to
the present, and the blue areas represent the 95% highest posterior density (HPD).
graphical relationships among populations was hampered due to the low resolution imposed by the few micros-
atellites and the small mitochondrial region used16.
In the genomic study by Lucena-Perez et al.16, analysing 80 samples, the authors found only 89 segregating
sites arranged in 24 haplotypes within the whole mitochondrial genome of European lynx from a geographical
range spanning from Norway to Primorsky Krai in Russia. It has to be noted though that their analysis excluded
large parts of the mitochondrial control region due to problems with assembling the sequencing reads in this
highly variable region. They arranged their recovered haplotypes in five haplogroups. The Balkan haplotype is
the only member of haplogroup 1 which might be the sister-group to the other haplotypes. These are arranged
in two western (haplogroup 2 and 3) and two eastern (haplogroup 4 and 5) groups, with haplogroup 3 forming
the sister-group to haplogroups 4 + 5 in the mitochondrial phylogeny.
Our results expand on previous data sets of control region sequences11–13,15,23, but consider each of the haplo-
types instead of haplotypes based on informative sites only, as done by Rueness et al.15. We found 61 segregating
sites within 631 bp of the mitochondrial control region, identifying 44 haplotypes. These form four clades in the
phylogenetic analysis, i.e., South, East (paraphyletic), West 1 and West 2 (Fig. 2). As in Rueness et al.15, the South
clade might be the sister group to the other groups, and this clade contains the common haplotype found in Iran.
Although we were not able to include the control region sequences by Lucena-Perez et al.16 in the final
analysis, we suggest that their haplogroups correspond to our haplogroups/clades as follows: (1) our clade West
1 is equivalent to haplogroup 2, i.e., the first western clade to branch off in the phylogeny, as they both include
samples from the Carpathians that are not present in the other western clade. Nonetheless, our clade West 1 has
a much wider distribution, including regions that were sampled for haplogroup 2 only by Lucena-Perez et al.16,
which might be caused by including museum sample sequences by Rueness et al.15 from populations that are now
extinct or severely decimated. In Rueness et al.15, the corresponding clade is their clade West. (2) Our clade West
2 is equivalent to haplogroup 3, the other western clade that forms the sister-group to the Asiatic haplogroups
in Lucena-Perez et al.16. Again, our clade West 2 has a much wider distribution, overlapping widely with clade
West 1 from eastern Poland to the Yenisey river. (3) Our paraphyletic clade East corresponds to haplogroups
4 + 5 from Lucena-Perez et al.16, but we did not find any differentiation within this group, probably due to the
much smaller mtDNA sequence length that we used. In Rueness et al.15, their clade Northeast corresponds to our
clades West 2 + East. (4) Our clade South corresponds to haplogroup 1 by Lucena-Perez et al.16, as their haplotype
from the Balkan region grouped with our clade South in the analysis with the trimmed alignment (including
only the 326 bp also present in Lucena-Perez et al.16, Supplementary Fig. S1). Clade South from Rueness et al.15
corresponds to our clade South.
Taxonomy. Although six subspecies of Eurasian lynx were suggested based on the morphological traits such
as fur color, body size, and degree of spottiness6, our genetic data is not completely corresponding to these puta-
tive subspecies. However, three subspecies might have a genetic basis considering the mitochondrial genome.
The Siberian lynx (L. lynx wrangeli) corresponds to our paraphyletic clade East, and the combined Asian popula-
Scientific Reports | (2022) 12:3293 | https://doi.org/10.1038/s41598-022-07369-z 6
Vol:.(1234567890)www.nature.com/scientificreports/
tions by Lucena-Perez et al.16. The nominate northern lynx (L. lynx lynx) includes two mitochondrial clades, i.e.,
clade West 1 and West 2 in both our analysis and the study by Lucena-Perez et al.16. The third putative subspe-
cies is distributed in southern localities including populations in the Himalaya region, Tibet, Iran, Iraq, Turkey,
and the Caucasus region. It corresponds with our clade South. Two subspecies have been described from these
regions, i.e., L. lynx isabellinus (Blyth, 1847) with type locality in Tibet, and L. lynx dinniki (Satunin, 1915) with
type locality in the Caucasus24. L. lynx isabellinus takes priority over L. lynx dinniki, so we propose to use this
name for the whole southern subspecies. Unfortunately, there is no large-scale study including these southern
localities, and the Balkan and Carpathian populations as well, so their genetic relationship remains speculative.
Gugolz et al.17 found that L. l. balcanicus from the Balkan population and L. l. dinniki (here synonymized with
L. l. isabellinus) from Caucasus share one haplotype and are perhaps con-subspecific6, which was also supported
by our analysis using the trimmed alignment (326 bp of the control region). During glacial cycles, a land bridge
existed between Asia Minor and the Balkans25, so it is possible that the Balkan lynx was connected to L. l. isa-
bellinus, forming its westernmost population. The only mitochondrial haplotype from the Carpathian region15
belongs to clade West 1, and also in Lucena-Perez et al.16 the Carpathian population belongs to haplogroup 2,
so we consider it to belong to the northern subspecies L. lynx lynx. In any case, the genetic distinction between
the subspecies is small and implies that morphological traits such as size, fur colour, and texture are, to a large
degree, environmentally plastic. Considerable variation in phenotypic traits and division in subspecies, which
was not reflected in genetic structuring, has been reported in another lynx species (Lynx rufus26).
Population differentiation and taxonomic implications. When looking at population differentiation
measures according to the proposed subspecies, the values for genetic diversity of L. l. lynx (h: 0.848 ± 0.027, π:
0.00484 ± 0.00031) is higher than the L. lynx wrangeli (h: 0.574 ± 0.089, π: 0.00229 ± 0.00051) and L. l. isabellinus
(h: 0.411 ± 0.131, π: 0.00251 ± 0.00122). It is worth to note that many more sequences are available for L. l. lynx
than for the other subspecies. Especially for L. l. isabellinus, a large part of the range, i.e., the Balkan region, have
not been sampled for this study, so the population differentiation could be underestimated for this subspecies.
Population expansion. The mismatch distribution analysis clearly supports a demographic expansion for
the whole L. lynx species and L. l. lynx subspecies (Fig. 4). For L. l. wrangeli the curve is relatively flat with two
marked peaks, while multimodal pattern is obvious for L. l. isabellinus.
Statistical tests support this interpretation (Table 2): the species as a whole shows clear signs of range expan-
sion in all tests, and this expansion can mostly be attributed to the nominate subspecies (L. l. lynx), while the
statistics were not significant for L. l. wrangeli. Both tests, R2 and Fu’s Fs, did not find evidence for range expansion
in L. l. isabellinus, so it seems that this southern subspecies has not significantly increased its range compared
to the historic distribution and still occurs in the geographic area where it originated in southern Eurasia.
This agrees with the assumption that Eurasian lynx was restricted to the southern populations and from there
expanded northwards as the habitats became available after the glaciation ended.
The Bayesian skyline Plot also shows population expansion that happened mostly between 8 and 4 thousand
years ago, which is after the separation of the southern group (L. l. isabellinus) and the northern group (L. l. lynx
and L. l. wrangeli).
Population history. A previous study on the demographic history of Eurasian lynx concluded that the
entire lynx population was very homogenous and large until about 600,000 years ago and started to decline more
steeply until 200,000 years ago16. Around 100,000 years ago the lynx populations started to diverge genetically,
which likely corresponds with several cycles of glaciation that periodically decreased the lynx habitat to small
refugia15.
Based on the mitogenomic divergence of Eurasian lynx16, separation of haplogroup 1, currently restricted to
the Balkan population, is the oldest split (around 96.5 kya). This split might also include the southern subspecies
from the Himalayas to the Caucasus region and Turkey that was postulated to be the oldest lineage by Rueness
et al.15. In our study, the oldest split (15.7 kyr) is between the South clade (not including the Balkan region) and
the northern clades (West 1, West 2 and East), which is a lot younger, but we urge not to put too much into this
as we only analysed a short fragment of mitochondrial DNA.
The next split is the separation of haplogroup 2 (West 1 in our study) from the Carpathian Mountains and the
Baltic states populations (around 47.4 kya), followed by the split of haplogroup 3 (West 2 in our study) including
other European populations from northern and eastern Europe at around 28.6 k ya16. It is therefore very likely
that the northern subspecies L. lynx lynx originated from at least two postglacial colonization events where
individuals from southern refugia expanded northwards as the ice retreated. One of these refugia for members
of the northern subspecies that originated from the first expansion might be the Carpathian region12,17,27–29 with
haplotypes belonging only to clade West 1. The occurrence of other southern refugia in Europe is also supported
by a number of fossil records from the late P leistocene30.
The Asian haplogroups (East clade in our study) diversified around 17 kya, coinciding with internal diver-
sification within haplogroup 2 (i.e., clade West 1 in our study)16. At that time, the split between the northern
subspecies L. lynx lynx and the Siberian subspecies L. lynx wrangeli was c omplete16. It seems that the Yenisey river
forms the barrier between L. l. lynx and L. l. wrangeli, although it has been doubted that it could act as a strong
barrier for such a large and mobile carnivore31. Only one instance of an Eastern haplotype (H39) found west of
the Yenisey river (Fig. 1) was recorded, so there seems to be some possibility for migration across the subspecies
boundaries, as also found in Lucena-Perez et al.16 between haplogroup 3 in the Urals and the Asian haplogroups.
Scientific Reports | (2022) 12:3293 | https://doi.org/10.1038/s41598-022-07369-z 7
Vol.:(0123456789)www.nature.com/scientificreports/
The Caucasus region. One of the most interesting and diverse regions in terms of mitochondrial diversity
is the Caucasus. It harbors mitochondrial haplotypes from all four haplogroups, i.e., H1 (the most common
haplotype found in Iran and also found in the Himalaya region), H8 (the central haplotype of clade West 1), H20
(the central haplotype of clade West 2), and H37 from the East clade. This region is a well-known biodiversity
hotspot and the Caucasus forest refugium is the largest throughout the Western Asian/near Eastern region (e.g.
Tarkhnishvili et al.32). It is very likely that the one of the northwards expansions of the northern group, i.e., clades
West 1, West 2, and East, started in this region.
Conclusion
The present study provides new insights into the genetic diversity of Iranian lynx populations, and their rela-
tionships with other Eurasian lynx. Our research demonstrates the importance of southwestern Asia to address
questions regarding genetic relationships among the Asian and European lynx populations. The central haplo-
types of two clades (H8 for West 1 and H20 for West 2) that colonized Europe exist in the Caucasus beside H1
(most frequent haplotype of South clade) and H37 (East clade); therefore, the Caucasus region was an important
refugium for the Eurasian lynx during the glacial maxima, and one of sources for subsequent colonization of
northern habitats after the Last Glacial Maximum. The population expansion signatures for the Eurasian lynx,
star-like patterns in phylogenetic networks, and population expansion times support recent and quick coloniza-
tion of northern Eurasia, and appear to reflect responses to postglacial climate warming. Future genetic studies
with larger sample size from Iran and neighboring countries such as Iraq and Afghanistan are required to further
clarify the evolutionary history of the Eurasian lynx and the taxonomic status of the putative subspecies L. l.
isabellinus, synonymised here with (and taking priority over) L. l. dinniki, and L. l. balcanicus.
Material and methods
Sampling. The elusive nature of the lynx, which is a highly mobile solitary predator, makes field observation
and sampling very difficult. Previous field surveys conducted extensive and intensive camera trapping within
several protected areas across the country, but were unsuccessful in capturing any photograph of the species
(e.g., Hamidi et al.33 and Moqanaki et al.34). In addition to low detectability, the population size of the lynx in
Iran is unknown. Therefore, optimizing a sampling protocol is a major challenge for Iranian researchers. Some
previous research relied on museum specimens, for example, Rueness et al.15 used about 150 museum specimens
collected between 1844 and 2002.
We collected samples across the species range in Iran, including north, northwest, and west, with the permis-
sion of and in accordance with the national regulations of the Department of Environment. A total of 15 samples
were collected, including fresh muscle or skin tissues obtained from dead animals (e.g. road killed individuals)
(Fig. 1, Supplementary Table S1). Samples were preserved in 96% ethanol and stored at − 20 °C, prior to DNA
extraction.
DNA extraction, amplification and sequencing. Whole genomic DNA was extracted from tissue
samples using AccuPrep genomic DNA extraction tissue kit (Bioneer Co., South Korea) following the manu-
facture’s instructions. Polymerase chain reaction was performed for amplification of a 613 bp fragment of the
control region using, mtU (5ʹ-CTTTGGTCTTGTAAACCAAAAAA-3ʹ) and R3 (5ʹ-TAAGAACCAGATGCC
AGGTA-3ʹ) primers35. Amplifications were performed in 25-μl volumes, containing 1 unit of Euro Taq DNA
polymerase, 10 μM Tris–HCl, 30 μM KCl, 1.5 mM MgCl2, 250 μM of each dNTP and 2 pmol primers (Bioneer,
South Korea). The thermocycling was performed in a SensoQuest thermocycler using an initial denaturing at
95 °C for 4 min followed by 40 cycles of 30 s at 94 °C, 35 s at 55 °C, and 50 s at 72 °C, and a final extension at 72 °C
for 5 min. Sanger sequencing was performed using the BigDye Terminator Cycle Sequencing kit v.3.1 (Applied
BioSystems) and electrophoresis of the purified sequencing product was carried out on an ABI PRISM 3730xl
automatic sequencer.
Alignment and haplotype network. Sequences were edited with SeqScape v.2.6 (Applied Biosystems),
and aligned with 68 previously published mtDNA sequences from GenBank using the Clustal W algorithm36
implemented in Mega v.537, and checked visually. Unfortunately, the mitochondrial genomes generated by
Lucena-Perez et al.16 could not be included in the final analysis, as their control region sequences only matched
our (and other previously published) lynx sequences for the first 211 bp and the last 115 bp. However, we made
a trimmed alignment for a Bayesian analysis (same settings as in the final analysis, see below) and restricted the
sequences to the parts that overlapped with the sequences from Lucena-Perez et al.16.
DnaSP v.538 was used to find the number of haplotypes and the distribution map of haplotypes was made in
QGIS v.3.10. A MJ network was constructed using PopART v.1.739 with the default settings.
Phylogenetic analysis. For the phylogenetic analysis, we included only one representative of each hap-
lotype. HKY + G was selected as the best model of nucleotide substitution based on the Akaike information
criterion (AIC) using jModelTest v.0.1.140. Bayesian phylogenetic tree was constructed in MrBayes v.3.2.7a41,
using two independent runs of four Markov Chain Monte Carlo (MCMC), ran simultaneously for 10,000,000
generations and sampling every 1,000 generations. The first 25% of the sampled trees and estimated parameters
were discarded as burn-in. Convergence of the model parameters was monitored using the program Tracer
v.1.7.142. The consensus phylogenetic tree was then edited in FigTree v.1.4.4 (http://tree.bio.ed.ac.uk/software/
figtree/). MtDNA is more divergent (having more parsimony informative sites) compared with yDNA, nDNA,
and xDNA in the felid species, but its homoplasy index is higher; therefore, mtDNA is not suitable to separate
Scientific Reports | (2022) 12:3293 | https://doi.org/10.1038/s41598-022-07369-z 8
Vol:.(1234567890)www.nature.com/scientificreports/
felid species43. In preliminary phylogenetic analyses, we used different outgroup representatives for rooting the
phylogeny of Eurasian lynx, but different species (e.g., Lynx canadensis (AY319505), Lynx rufus (NC014456),
Lynx pardinus (KF561247), Caracal caracal (KP202272), and Leopardus jacobita (FJ960826)) rooted the tree at
different branches and we could not decide a priori which of these rootings was the most appropriate. Although
it can be regarded as certain that the Canadian lynx is the sister species to the Eurasian lynx, the rooting by this
species might still be artificial due to long branch attraction in this fast-evolving marker. We therefore decided
to analyse only the ingroup in the phylogenetic analysis.
The BEAST v.2.6.6 program package44 was employed to co-estimate topology and divergence times using a
strict clock model. This analysis included one representative each for all other species in the genus Lynx. We used
the BEAUti program to set up the MCMC run using the following parameters: the best corresponding model
(HKY + G) as indicated by jModelTest v.0.1.140, a strict clock, and a calibrated Yule model as the tree prior. The
MCMC analyses were run for 50 million generations with sampling each 5,000 generations. We used calibration
of Rueness et al.15 based on age calibration on priors from Johnson et al.43. The log-normal distribution of the root
prior (i.e. the split between L. rufus (NC014456) and the other lynx species, including Eurasian lynx haplotypes,
L. canadensis (AY319505), and L. pardinus (KF561247)) was set (M = 0.4762 and S = 0.2445) with mean of 1.61
(95% CI 1.06–2.60) Myr and M = 0.1655 and S = 0.2641 of the log-normal distribution were set approximately
for the internal node prior (i.e. the split between Eurasian lynx haplotypes and L. canadensis) with mean of 1.18
(95% CI 0.7–1.98) Myr. Analysis of the posterior distributions of tree likelihood and other parameters using
the program Tracer v.1.7.142 showed ESS values > 200. TreeAnnotator v.2.6.6 was then used to remove the first
10% of trees as burnin and extract the maximum clade credibility tree with nodes scaled to the mean heights
recovered by the posterior sample and visualized using FigTree v.1.4.4 (http://t ree.b
io.e d.a c.u
k/s oftwa re/fi
gtre e/).
Population differentiation and structure. Measures of DNA polymorphism were estimated for L. lynx
as a whole, as well as for the subspecies that we propose, i.e., L. l. lynx (combined West 1 and West 2 clades), L.
l. wrangeli (East clade), and L. l. isabellinus (South clade). Using DnaSP v.538 we calculated haplotype diversity
(h, the probability that any two randomly sampled haplotypes are d ifferent45), nucleotide diversity (π, the aver-
age number of nucleotide differences per site), and the mean number of pairwise differences within a group (k).
We further estimated mismatch distributions separately for the total group and the putative subspecies (see
above) to test if their frequency graph shows a chaotic/multimodal pattern characteristic for populations in demo-
graphic equilibrium, or a unimodal profile which is found in populations that experienced recent geographic
expansion46. The test was performed using Arlequin v.3.5.2.247 under the null hypothesis that the observed data
fit the sudden expansion model using a generalized least-square approach with 1000 bootstrap replicates. Other
statistics for analyzing population expansions or declines were also calculated using DnaSP v.538, i.e., R 248 which
49
use information on the frequency of segregating sites, and Fu’s F s which is a measure for estimating the amount
of rare alleles (young mutations in expanding populations), where a negative value is interpreted as indicating
recent demographic expansion.
In addition, a coalescent based Bayesian skyline p lot50 was reconstructed using the BEAST v.2.6.6 program
package with HKY + G and empirical base frequencies under the substitution model and 1 07 MCMC repeti-
44
tions. We used a strict molecular clock model, setting tuning parameters of operators to yield effective sample
sizes (ESS) larger than 200. Convergence was visually checked in Tracer v.1.7.142.
Received: 25 August 2021; Accepted: 16 February 2022
References
1. Kaczensky, P. et al. Status, management and distribution of large carnivores-bear, lynx, wolf & wolverine-in Europe. (Verlag nicht
ermittelbar, 2013).
2. Nowell, K., Jackson, P. & others. Wild cats: status survey and conservation action plan. 382, (IUCN Gland, 1996).
3. Sunquist, M. & Sunquist, F. Wild cats of the world. (University of Chicago Press, 2017).
4. Breitenmoser, U. et al. Lynx lynx (errata version published in 2017). The IUCN Red List of Threatened Species 2015 (2015).
5. Ghigi, A. Ricerche faunistiche e sistematiche sui mammiferi d’Italia che formano oggetto di caccia. Natura 2, 289–337 (1911).
6. Kitchener, A. et al. A revised taxonomy of the Felidae. Cat News 11, 80 (2017).
7. Ellerman, J. R. & Morrison-Scott, T. C. S. Checklist of Palaearctic and Indian mammals, 1758–1946. 3, (British Museum (Natural
History), 1951).
8. Mousavi, M. et al. The largest lesser cat in Iran—current status of the Eurasian lynx. Cat News 10, 33–37 (2016).
9. Mahdavi, T., Shams-Esfandabad, B., Toranjzar, H., Abdi, N. & Ahmadi, A. Potential impact of climate change on the distribution
of the Eurasian Lynx (Lynx lynx) in Iran (Mammalia: Felidae). Zool. Middle East 66, 107–117 (2020).
10. Moqanaki, E., Farhadinia, M. S., Mousavi, M. & Breitenmoser, U. Distribution and conservation status of the Eurasian lynx in
Iran. Cat News 53, 32–35 (2010).
11. Hellborg, L. et al. Differentiation and levels of genetic variation in northern European lynx (Lynx lynx) populations revealed by
microsatellites and mitochondrial DNA analysis. Conserv. Genet. 3, 97–111 (2002).
12. Ratkiewicz, M. et al. High levels of population differentiation in Eurasian lynx at the edge of the species’ western range in Europe
revealed by mitochondrial DNA analyses. Anim. Conserv. 15, 603–612 (2012).
13. Ratkiewicz, M. et al. Long-range gene flow and the effects of climatic and ecological factors on genetic structuring in a large,
solitary carnivore: The Eurasian lynx. PLoS ONE 9, 1–29 (2014).
14. Rueness, E. K. et al. Cryptic population structure in a large, mobile mammalian predator: The Scandinavian lynx. Mol. Ecol. 12,
2623–2633 (2003).
15. Rueness, E. K., Naidenko, S., Trosvik, P. & Stenseth, N. C. Large-scale genetic structuring of a widely distributed carnivore—The
Eurasian lynx (Lynx lynx). PLoS One 9, e93675 (2014).
16. Lucena-Perez, M. et al. Genomic patterns in the widespread Eurasian lynx shaped by Late Quaternary climatic fluctuations and
anthropogenic impacts. Mol. Ecol. 29, 812–828 (2020).
Scientific Reports | (2022) 12:3293 | https://doi.org/10.1038/s41598-022-07369-z 9
Vol.:(0123456789)www.nature.com/scientificreports/
17. Gugolz, D. et al. Historical DNA reveals the phylogenetic position of the extinct Alpine lynx. J. Zool. 275, 201–208 (2008).
18. Aquadro, C. F. & Greenberg, B. D. Human mitochondrial DNA variation and evolution: Analysis of nucleotide sequences from
seven individuals. Genetics 103, 287–312 (1983).
19. Brown, J. R., Beckenbach, A. T. & Smith, M. J. Intraspecific DNA sequence variation of the mitochondrial control region of white
sturgeon (Acipenser transmontanus). Mol. Biol. Evol. 10, 326–341 (1993).
20. Nabholz, B., Mauffrey, J. F., Bazin, E., Galtier, N. & Glemin, S. Determination of mitochondrial genetic diversity in mammals.
Genetics 178, 351–361 (2008).
21. Gomerčić, T. et al. High genetic variability of the grey wolf (Canis lupus L.) population from Croatia as revealed by mitochondrial
DNA control region sequences. Zool. Stud. 49, 816–823 (2010).
22. Galtier, N., Nabholz, B., GlÉmin, S. & Hurst, G. D. D. Mitochondrial DNA as a marker of molecular diversity: A reappraisal. Mol.
Ecol. 18, 4541–4550 (2009).
23. Sindičić, M. et al. Repetitive sequences in Eurasian lynx (Lynx lynx L.) mitochondrial DNA control region. Mitochondrial DNA
23, 201–207 (2012).
24. Heptner, V. H. & Sludskii, A. A. Mammals of the Soviet Union. Vol II: Carnivores (hyaenas and cats). Vyssha Shkola ([English
translation published in 1992, Smithsonian Institution Libraries, Washington D.C.], 1972).
25. Hewitt, G. Post-glacial re-colonization of European biota. Biol. J. Linn. Soc. 68, 87–112 (1999).
26. Reding, D. M., Bronikowski, A. M., Johnson, W. E. & Clark, W. R. Pleistocene and ecological effects on continental-scale genetic
differentiation in the bobcat (Lynx rufus). Mol. Ecol. 21, 3078–3093 (2012).
27. Kotlík, P. et al. A northern glacial refugium for bank voles (Clethrionomys glareolus). Proc. Natl. Acad. Sci. USA 103, 14860–14864
(2006).
28. Babik, W. et al. Phylogeography of two European newt species - Discordance between mtDNA and morphology. Mol. Ecol. 14,
2475–2491 (2005).
29. Sommer, R. S. & Nadachowski, A. Glacial refugia of mammals in Europe: Evidence from fossil records. Mamm. Rev. 36, 251–265
(2006).
30. Sommer, R. S. & Benecke, N. Late Pleistocene and Holocene development of the felid fauna (Felidae) of Europe: A review. J. Zool.
269, 7–19 (2006).
31. Zimmermann, F. & Breitenmoser, U. Potential distribution and population size of the Eurasian lynx Lynx lynx in the Jura Mountains
and possible corridors to adjacent ranges. Wildl. Biol. 13, 406–416 (2007).
32. Tarkhnishvili, D., Gavashelishvili, A. & Mumladze, L. Palaeoclimatic models help to understand current distribution of Caucasian
forest species. Biol. J. Linn. Soc. 105, 231–248 (2012).
33. Hamidi, A. K. et al. Camera trap study of Persian leopard in Golestan National Park Iran. Cat News 60, 12–14 (2014).
34. Moqanaki, E., Jafarzadeh, F., Hosseini-Zavarei, F. & Farhadinia, M. S. Assessing the status of the Eurasian lynx (Lynx lynx) in
Anguran Wildlife Refuge using multiple survey methods. J. Anim. Environ. 7, 47–56 (2015).
35. Rueness, E. K. et al. Ecological and genetic spatial structuring in the Canadian lynx. Nature 425, 69–72 (2003).
36. Thompson, J. D., Higgins, D. G. & Gibson, T. J. CLUSTAL W: Improving the sensitivity of progressive multiple sequence alignment
through sequence weighting, position-specific gap penalties and weight matrix choice. Nucleic Acids Res. 22, 4673–4680 (1994).
37. Tamura, K. et al. MEGA5: Molecular evolutionary genetics analysis using maximum likelihood, evolutionary distance, and maxi-
mum parsimony methods. Mol. Biol. Evol. 28, 2731–2739 (2011).
38. Librado, P. & Rozas, J. DnaSP v5: A software for comprehensive analysis of DNA polymorphism data. Bioinformatics 25, 1451–1452
(2009).
39. Leigh, J. W. & Bryant, D. Popart: full-feature software for haplotype network construction. Methods Ecol. Evol. 6, 1110–1116 (2015).
40. Posada, D. jModelTest: Phylogenetic model averaging. Mol. Biol. Evol. 25, 1253–1256 (2008).
41. Ronquist, F. et al. Mrbayes 3.2: Efficient bayesian phylogenetic inference and model choice across a large model space. Syst. Biol.
61, 539–542 (2012).
42. Rambaut, A., Drummond, A. J., Xie, D., Baele, G. & Suchard, M. A. Posterior summarization in Bayesian phylogenetics using
Tracer 1 . 7. Syst. Biol. 67, 901–904 (2018).
43. Johnson, W. E. et al. The late Miocene radiation of modern Felidae: A genetic assesstment. Science (80-. ). 311, 73–77 (2006).
44. An advanced software platform for Bayesian evolutionary analysis. Bouckaert, R. et al. BEAST 2.5. PLoS Comput. Biol. 15, 1–28
(2019).
45. Nei, M. Molecular Evolutionary Genetics. Molecular Evolutionary Genetics (Columbia university press, 1985).
46. Hey, J. & Nielsen, R. Multilocus methods for estimating population sizes, migration rates and divergence time, with applications
to the divergence of Drosophila pseudoobscura and D. persimilis. Genetics 167, 747–760 (2004).
47. Excoffier, L., Laval, G. & Schneider, S. Arlequin (version 3.0): An integrated software package for population genetics data analysis.
Evol. Bioinforma. 1, 117693430500100 (2005).
48. Ramos-Onsins, S. E. & Rozas, J. Statistical properties of new neutrality tests against population growth. Mol. Biol. Evol. 19,
2092–2100 (2002).
49. Fu, Y.-X. Statistical tests of neutrality of mutations against population growth, hitchhiking and background selection. Genetics
147, 915–925 (1997).
50. Drummond, A. J., Rambaut, A., Shapiro, B. & Pybus, O. G. Bayesian coalescent inference of past population dynamics from
molecular sequences. Mol. Biol. Evol. 22, 1185–1192 (2005).
Acknowledgements
We thank the Iranian Department of Environment for sampling authorizations.
Author contributions
M.M., F.B., and D.F. conceived and designed the study. D.F., E.V.B., M.M., and F.B. wrote the main manuscript
text. F.B., M.A.A., and D.F. collected samples. D.F., F.B., and E.V.B. analysed the data. All authors reviewed the
manuscript.
Competing interests
The authors declare no competing interests.
Additional information
Supplementary Information The online version contains supplementary material available at https://doi.org/
10.1038/s41598-022-07369-z.
Correspondence and requests for materials should be addressed to D.F.
Scientific Reports | (2022) 12:3293 | https://doi.org/10.1038/s41598-022-07369-z 10
Vol:.(1234567890)www.nature.com/scientificreports/
Reprints and permissions information is available at www.nature.com/reprints.
Publisher’s note Springer Nature remains neutral with regard to jurisdictional claims in published maps and
institutional affiliations.
Open Access This article is licensed under a Creative Commons Attribution 4.0 International
License, which permits use, sharing, adaptation, distribution and reproduction in any medium or
format, as long as you give appropriate credit to the original author(s) and the source, provide a link to the
Creative Commons licence, and indicate if changes were made. The images or other third party material in this
article are included in the article’s Creative Commons licence, unless indicated otherwise in a credit line to the
material. If material is not included in the article’s Creative Commons licence and your intended use is not
permitted by statutory regulation or exceeds the permitted use, you will need to obtain permission directly from
the copyright holder. To view a copy of this licence, visit http://creativecommons.org/licenses/by/4.0/.
© The Author(s) 2022
Scientific Reports | (2022) 12:3293 | https://doi.org/10.1038/s41598-022-07369-z 11
Vol.:(0123456789)You can also read