Mapping of Malaria Risk Related to Climatic and Environmental Factors by Multicriteria Analysis in the Marahoué Region of Côte d'Ivoire
←
→
Page content transcription
If your browser does not render page correctly, please read the page content below
Journal of Geoscience and Environment Protection, 2022, 10, 234-252
https://www.scirp.org/journal/gep
ISSN Online: 2327-4344
ISSN Print: 2327-4336
Mapping of Malaria Risk Related to Climatic
and Environmental Factors by Multicriteria
Analysis in the Marahoué Region of Côte
d’Ivoire
Assikohon Pulchérie Gouzile1*, Martial Bama1, Bi Yourou Guillaume Zamina1, Ellélé Aimé Yapi2,
Gneneyougo Emile Soro3, Bi Tie Albert Goula3, Tiembré Issiaka1,2
1
National Institute of Public Hygiene, Abidjan, Côte d’Ivoire
2
Félix Houphouët Boigny University, Abidjan, Côte d’Ivoire
3
Nangui-Abrogoua University, Abidjan, Côte d’Ivoire
How to cite this paper: Gouzile, A. P., Abstract
Bama, M., Zamina, B. Y. G., Yapi, E. A.,
Soro, G. E., Goula, B. T. A. and Issiaka, T. Malaria, a febrile human disease transmitted by female anopheles whose ecol-
(2022). Mapping of Malaria Risk Related to ogy is linked to water, is a major public health problem in Côte d’Ivoire, more
Climatic and Environmental Factors by Mul-
precisely in the Marahoué region located in the southwest of the country. In
ticriteria Analysis in the Marahoué Region of
Côte d’Ivoire. Journal of Geoscience and order to effectively control this disease, it is necessary to understand the eti-
Environment Protection, 10, 234-252. ology and the diffusion pattern of the vectors. This justifies this study, which
https://doi.org/10.4236/gep.2022.106015 proposes to determine the areas at risk of malaria transmission in order to
Received: March 19, 2022 carry out an effective fight against this disease in this region of Côte d’Ivoire.
Accepted: June 27, 2022 To achieve this, a combined approach of geographic information systems and
Published: June 30, 2022 multicriteria analysis was adopted. The analysis reveals that the south and
northwest of the Marahoué region present a high risk for malaria transmis-
Copyright © 2022 by author(s) and
Scientific Research Publishing Inc. sion. This risk is linked to indicators such as climatic factors that cover 48.36%
This work is licensed under the Creative of the study area, environmental factors such as vegetation cover (NDVI), soil
Commons Attribution International moisture (NDWI), altitude, hydrography (water point) and population that
License (CC BY 4.0).
http://creativecommons.org/licenses/by/4.0/ covers 55.29% of the area and land use. Also, the results indicated that 50.70%
Open Access of the region has favorable conditions for malaria transmission. Overall, cli-
matic and environmental indicators are the risk factors associated with the
resurgence of malaria.
Keywords
Mapping, Palustrum, Multicriteria Analysis, Marahoué,
Ivory Coast
DOI: 10.4236/gep.2022.106015 Jun. 30, 2022 234 Journal of Geoscience and Environment Protection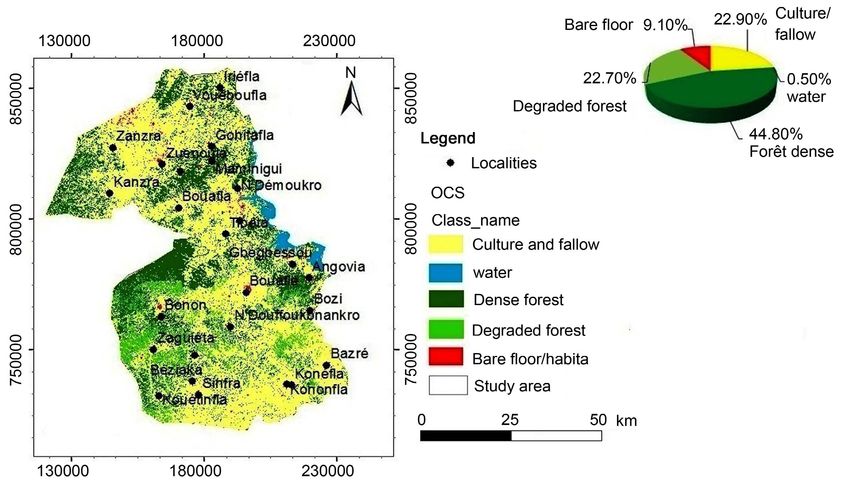
A. P. Gouzile et al.

                               1. Introduction
                               Malaria is one of the major public health problems. According to the latest WHO
                               report on malaria in the world, 241 million cases were reported in 2020 with
                               627,000 deaths (WHO, 2021). The most affected region is sub-Saharan Africa
                               with 96% of deaths, 80% of which are in children under five (WHO, 2021). Cli-
                               mate plays an important role in the dynamics and distribution of malaria (Gou-
                               ataine & Ymba, 2018; Fosah et al., 2022). Variations in climatic conditions, such
                               as temperature, rainfall patterns, and humidity have a significant effect on vector
                               life span, parasite development, and subsequently disease transmission (Dio-
                               mandé et al., 2017; Fosah et al., 2022; Zewga, 2021). Furthermore, the risk of
                               transmission increases in a poorly maintained environment characterized by the
                               proliferation of illegal dumpsites, the discharge of wastewater in the streets, and
                               the presence of stagnant water after rainfall. Stagnant water provides potential
                               breeding grounds for the malaria vector (Gramado et al., 2006; Gouataine &
                               Ymba, 2018).
                                 Côte d’Ivoire is a malaria endemic country (Eholié et al., 2004; Konan et al.,
                               2009). More than 80% of general consultations in the Etablissements Sanitaires
                               de Premiers Contacte (ESPC) are attributed to malaria (PNLP, 2005). The major
                               vector in this country is Anopheles gambiae (PNLP, 2005). The Marahoué re-
                               gion, located in the central-western part of Côte d’Ivoire, presents favorable con-
                               ditions for the development of many species of mosquitoes (excessive dumping of
                               household waste, collection of wastewater due to the failure of the sanitation
                               system, presence of shallows and ponds on sunny surfaces with the presence of
                               vegetation). Despite the efforts put in place by the country, with the National
                               Malaria Control Program (PNLP) created in 1996 and the adaptation of the Na-
                               tional Strategic Plan (PSN) in 2016, this pathology remains endemic throughout
                               the country with an incidence of 230‰ (PNS 2016-2020). In the Marahoué re-
                               gion, the incidence is 222.78‰ (RASS, 2018). This finding seems to indicate that
                               the malaria control strategy does not exist sufficiently on the environmental
                               health risk. This justifies this study whose objective is to determine the malaria
                               risk areas for a more effective control of this disease in the Marahoué region of
                               Côte d’Ivoire. The interest of this work is to provide results that will be used to
                               solve health problems in which climatic and environmental factors intervene as
                               factors favoring diseases and their vectors. Indeed, some tools such as mapping,
                               remote sensing and geographic information systems are used to better target
                               populations and areas at risk (Somé, 2010; Kotchi et al., 2019). Their studies re-
                               spectively (Oluwafemi et al., 2022; Kouame et al., 2017) used multi-criteria anal-
                               ysis modeling and Geographic Information Systems (GIS) to map areas at risk to
                               the Yellow Fever epidemic in Nigeria and the Acute Respiratory Infection in Côte
                               d’Ivoire. Thus, this approach is best suited for assessing environmental health risk
                               by combining epidemiological, statistical, and Geographic Information Systems
                               (GIS) methods (Beale et al., 2008; Zewga, 2021).

DOI: 10.4236/gep.2022.106015                        235            Journal of Geoscience and Environment Protection
A. P. Gouzile et al.

                               2. Study Area
                               The Marahoué region is located in the central west of Côte d’Ivoire and straddles
                               the forest zone and the savannah zone. This region includes three departments,
                               Bouaflé, Sinfra and Zuénoula, and eleven (11) sub-prefectures, the largest of
                               which are Bouaflé, Bonon, Gohitafla, Sinfra, Zaguiéta, and Zuénoula (Figure 1).
                               According to the 2014 General Census of Population and Housing (RGPH), the
                               population of the Marahoué region is estimated at 862,344 inhabitants, including
                               409,683 for the department of Bouaflé, 238,015 for the department of Sinfra, and
                               214,646 for the department of Zuénoula, with an average density of 94.57 hbts/km2.
                               The climate is equatorial and transitional, with an annual rainfall of 1800 mm.
                               The climate has four seasons: a long rainy season from mid-March to mid-July
                               characterized by abundant and frequent rainfall, followed by the short dry sea-
                               son from mid-July to mid-September, characterized by a quantitative decrease in
                               rainfall. The short rainy season from (mid-September to November) is characte-
                               rized by slow cumuliform cloud formations. The long dry season from Novem-
                               ber to mid-March is characterized by frequent morning fog. The Marahoué re-
                               gion is largely drained by the Marahoué River and Lake Kossou.

                               Figure 1. Presentation of the study area.

DOI: 10.4236/gep.2022.106015                          236             Journal of Geoscience and Environment Protection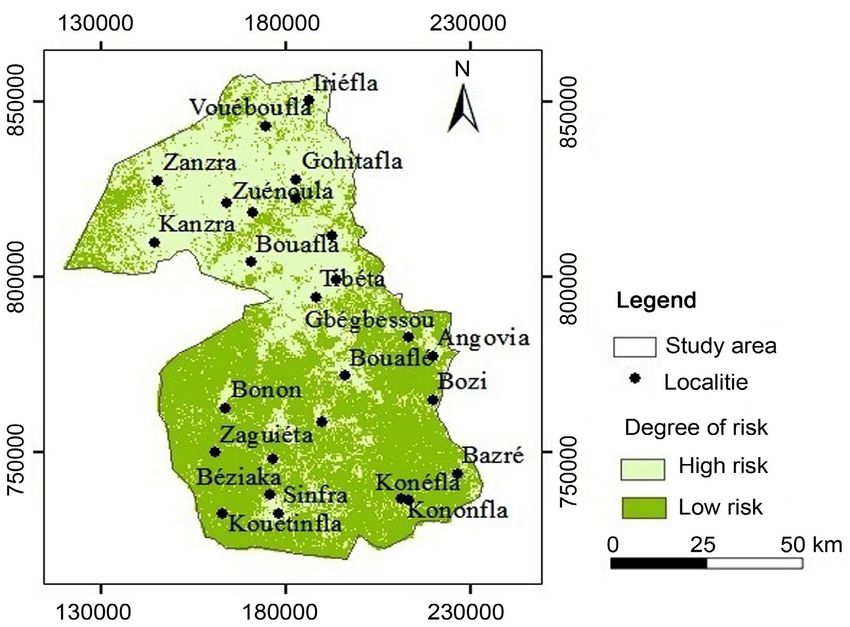
A. P. Gouzile et al.

                               3. Materials and Methods
                               3.1. Materials
                               3.1.1. Climatic Data
                               The climatic data come from two sources made available to us by the National
                               Meteorological Department, namely the Société d’Exploitation et de Développe-
                               ment Aéroportuaire, Aéronautique et Météorologique de Côte d’Ivoire (SODE-
                               XAM). They concern rainfall, minimum temperatures (min), maximum tem-
                               peratures (max) and relative humidity. The first source concerns maximum and
                               minimum temperature and relative humidity data from Daloa and Yamoussou-
                               kro, which are the closest synoptic stations to the region, as well as rainfall data
                               from Bouaflé and Sinfra. The second source of rainfall, temperature and relative
                               humidity data from the Zuénoula agro-climatic station was provided by the
                               SUCAF sugar complex in Zuénoula. Thus, the study area is covered by a net-
                               work of three rainfall stations, two synoptic stations and one agro-climatological
                               station with a study time window of 1980 to 2013. These data are estimated to
                               assess the risk related to climatic factors. The characteristics of the stations are
                               recorded in Table 1.

                               3.1.2. Data
                               These data are composed of Landsat7 ETM+ (Enhancement Thematic Mapper
                               plus) images at 30 m spatial resolution, Scene 197/055 acquired on December 12,
                               2003. These images were used to develop the land cover, vegetation index (NDVI)
                               and soil moisture index (NDWI) maps.
                                  The Schuttle Radar Topography Mission (SRTM) 3 digital elevation model
                               (DEM) with a resolution of 30 m was used to produce the elevation map and the
                               hydrographic network map. These data are estimated to assess the risk from en-
                               vironmental factors. The characteristics of the ETM images are presented in Ta-
                               ble 2.

                               3.1.3. Population Data
                               The population data comes from the 2014 general population and housing cen-
                               sus. This is data on human populations of communes and villages in the Ivory
                               Coast. For this study, we used estimated 2018 data provided by the Direction de

                               Table 1. Climatological stations selected for the study.

                                                                        Latitude    Longitude    Altitude
                                    Name               Station                                                  Period
                                                                         North        West         (m)

                                    Bouaflé             Rainfall          9˚31            6˚28     421         1980-2013
                                    Sinfra             Rainfall           9˚30            7˚34     434         1980-2013
                                   Zuénoula            Rainfall          10˚29            6˚24     356         1980-2013
                                    Daloa              Synoptic           6˚52            6˚28     276         1980-2013
                                   Zuénoula      Agro-climatological      7˚25            6˚30     209         1980-2013
                                Yamoussoukro           Synoptic           6˚54            5˚21     196         1980-2013

DOI: 10.4236/gep.2022.106015                          237              Journal of Geoscience and Environment Protection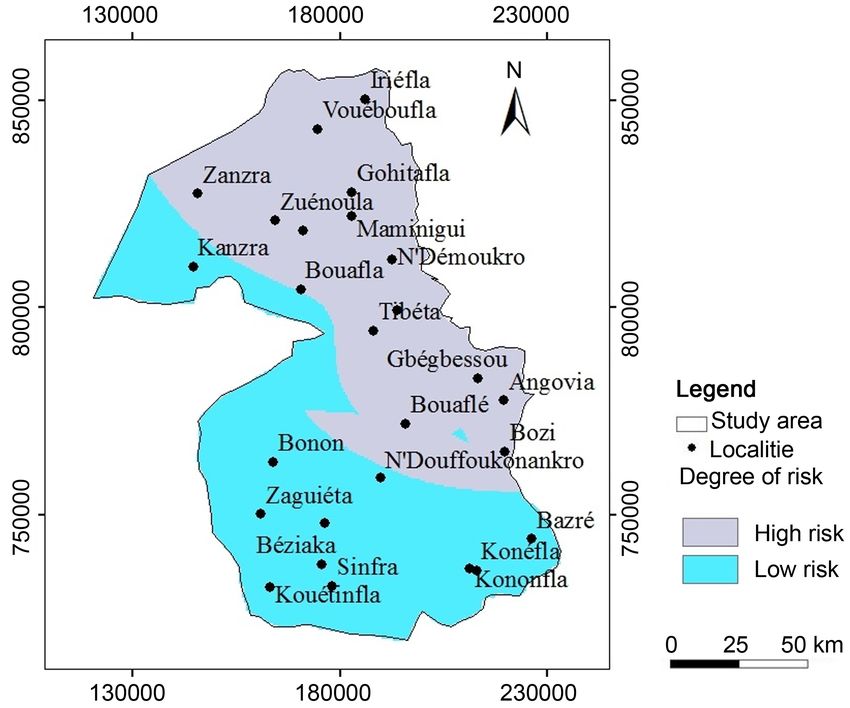
A. P. Gouzile et al.

                               Table 2. Spectral characteristics of Landsat7-ETM+.

                                                 Spatial      Number                       Date of
                                  Sensors                                  Path/Row                       Producer
                                               resolution     of bands                   acquisition
                                 L4-5TM       30 m × 30 m         8         197/55       22/12/2003         USGS
                                   LsoLi      30 m × 30 m         8         197/55       22/12/2003         USGS

                               l’Information de la Planification et de l’Evaluation (DIPE).

                               3.2. Tools
                               The data processing required the use of the following software:
                                 ArcGis 10.2 for mapping risk areas using inverse distance weighted interpola-
                               tion (IDW);
                                 Envi 4.7 from RSI (Research System Incorporation) was used to process the
                               acquired images and land cover.

                               3.3. Methodology
                               The mapping of areas at risk of malaria proliferation was done by the Multicrite-
                               ria Analysis of Saaty (1977). Mapping areas of potential malaria risk requires
                               climatic, environmental, and land use data. These data are the factors that favor
                               malaria transmission and the proliferation of malaria mosquito breeding sites
                               (Guerra et al., 2008; Gething et al., 2011). Studies (Hay et al., 2009; Ferrão et al.,
                               2021) have used mean temperature sometimes with precipitation and/or humid-
                               ity to develop maps representing spatiotemporal variation in malaria transmis-
                               sion risk. The approach consists of classification and standardization of criteria,
                               weighting of criteria and aggregation following the multi-criteria approach (Jour-
                               da et al., 2006; Koudou et al., 2013).

                               3.3.1. Choice of Decision Criteria
                               The criteria used to characterize potential malaria transmission risk areas include
                               climatic factors such as rainfall, maximum and minimum temperatures, and rela-
                               tive humidity; environmental and/or ecological factors such as vegetation cover,
                               soil moisture, altitude, standing water, garbage dumps, irrigated and drained
                               areas, and densely populated areas. The female Anopheles mosquito vector pro-
                               liferates in an insoluble environment characterized by the presence of stagnant
                               water, vegetation cover and garbage dumps. Rainfall is important because it fa-
                               vors the development of the vectors by providing them with suitable habitats to
                               reproduce. After rainfall, the presence of stagnant water provides potential breed-
                               ing sites for the female Anopheles mosquito. Temperature is a key factor for
                               many mosquitoes and for the life of the parasite in the mosquito. Thus, the fac-
                               tors favoring the risk of malaria transmission include three indicators: climatic
                               vulnerability, environmental vulnerability and land use.
                                 1) Climate vulnerability
                                 The climatic vulnerability indicator reflects the set of climatic factors that fa-

DOI: 10.4236/gep.2022.106015                         238              Journal of Geoscience and Environment Protection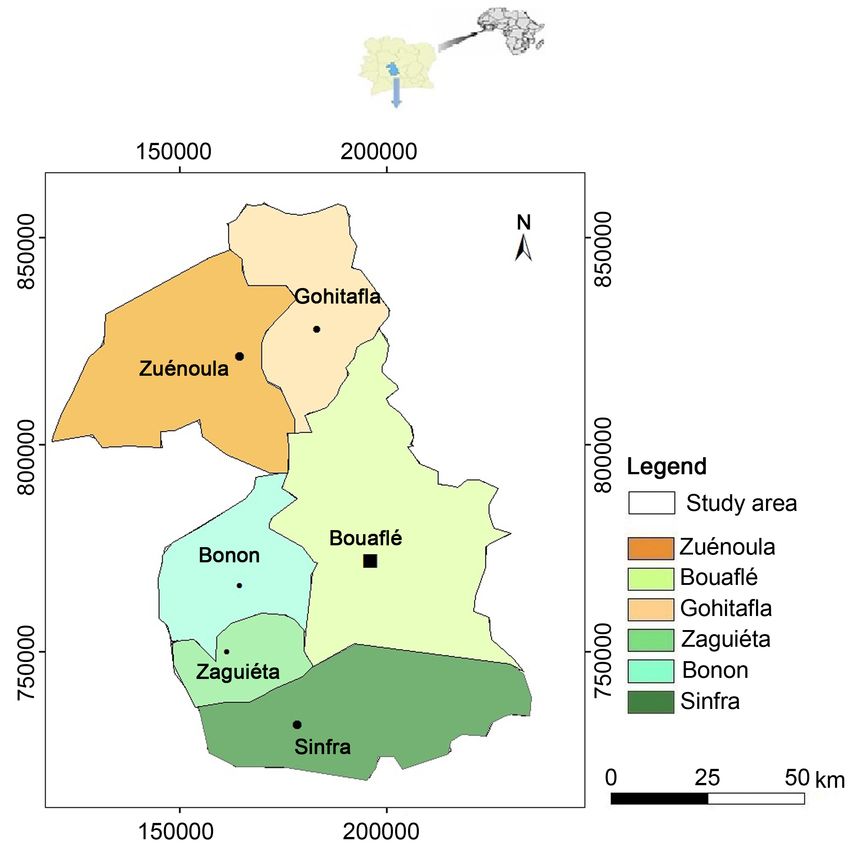
A. P. Gouzile et al.

                               vor the presence of malaria. It results from the linear combination of the maps of
                               precipitation, maximum and minimum temperature and relative humidity ob-
                               tained by the Inverse Distance Weigthing (IDW) interpolation technique of the
                               ArcGIS.10.2 geostatitica analyst extension.
                                 2) Environmental vulnerability
                                 The environmental vulnerability indicator translates environmental and/or eco-
                               logical factors resulting from the linear combination of the vegetation index map
                               (NDVI), soil moisture index (NDWI), altitude, distance to any water point (hy-
                               drography) and the population density map. It thus conditions the environmen-
                               tal factors that favor the development of germs and/or vectors.
                                 Vegetation index or Normalized Difference Vegetation Index (NDVI) and Soil
                               Moisture Index or Normalized Difference Water Index (NDWI) maps are ob-
                               tained from Landsat ETM+ image processing by color composition using ENVI
                               4.7 software. The study area was extracted by binary mask on a Landsat 7 scene.
                               The vegetation index was determined by the “weighted difference” formula. If
                               the vegetation cover is dense and chlorophyll active, the index tends towards 1.
                               However, when the index is low, the less vegetation there is. The formula for
                               calculating this index is:
                                                                         PIR − R
                                                               NDVI =                                              (1)
                                                                         PIR + R
                                 With PIR the near infrared and R the Red. In the case of the Landsat ETM+
                               images that we used, the PIR corresponds to the ETM+3 band and R to the
                               ETM+4 band. In addition, the soil moisture index is obtained by the following
                               formula
                                                                  TM4 − TM5 PIR − MIR
                                                   NDWI
                                                   =              =                                                (2)
                                                                  TM4 + TM5 PIR + MIR
                                 Hydrography and elevation are obtained from the Schuttle Radar Topography
                               Mission (SRTM3) Digital Elevation Model (DEM) and the population density
                               map is obtained by the Inverse Distance Weigthing (IDW) interpolation method,
                               from the ArcGIS.10 geostatitica analyst extension. Population density values re-
                               sult from the ratio of population to area of each locality in the region.
                                 3) Land use
                                 Like vegetation and soil moisture, land cover is obtained from Landsat ETM+
                               image processing by color compositing on ENVI 4.7. The extraction of the study
                               area is performed by binary mask on a Landsat 7 scene. The colored composi-
                               tion consists in displaying simultaneously on the screen three image bands in the
                               basic channels (Red/Green/Blue) and facilitates the extraction of information. In
                               this study, the color composition of Landsat EM and ETM+ bands 7-5-6 was
                               used because it presents the best land cover type discrimination.

                               3.3.2. Classifications and Standardization of Decision Criteria
                               The identified decision criteria were subdivided into different classes representing
                               either a particular environment or a confidence interval. Two classes labeled low

DOI: 10.4236/gep.2022.106015                         239            Journal of Geoscience and Environment Protection
A. P. Gouzile et al.
and high risk were retained for each criterion for better interpretation (Kouamé
et al., 2011). Subsequently, the different classes for each criterion were standar-
dized according to their particular influence on the disease. These classes were
coded (numerical coding). The results of the combinations of the two classes of
the different factors are also grouped into two classes ranging from low to high
risk. The different criteria are then combined into indicators. These are in turn
“divided” into two classes (low risk and high risk) and coded. It is ultimately the
combination of the indicators that gives the overall malaria risk maps. The classes
obtained for each of the criteria, and the codes assigned to them, are shown in
Table 3.
3.3.3. Weighting of Criteria
The decision criteria are weighted according to the linear combination method
based on the pairwise comparison technique according to the Analytic Hierarchy
Process (AHP) of Saaty (1977). It is developed by Meyer-Waarden, L. & Zeitoun,
H. (2005) and used by Koudou et al. (2013) and Yao et al. (2014). This method
generates standardized weights whose sum is equal to 1. It first consists of a bi-
nary comparison of the relative importance of all elements belonging to the
same hierarchical level with respect to the element of the next higher level ac-
cording to the numerical scale proposed by Saaty (Table 4). Then, set up a reci-
procal square matrix formed by the evaluations of the ratios of the weights (K ×
K), K being the number of elements compared. In this way we obtain:
Table 3. Classification and standardization of decision criteria.
Criteria Parameters Values Ribs Classes
Plant cover ndvi 0.41 1 low risk
from −0.02 to 0.41 2 high risk
soil moisture ndwi 0.94 1 low risk
from −0.2 to 0.94 2 high risk
Hydrography distance at any point >1.5 km 1 low risk
137 m 1 low risk
78.06 1 low riskA. P. Gouzile et al.
Table 4. Verbal and numerical expression of the relative importance of criteria (El Morjani,
2003).
Expression of one criterion in relation to another Note
Same importance 1
Moderately important 3
Highly important 5
Very important 7
Extremely important 9
Extremely less important 1/3
Significantly less important 1/5
Less important 1/7
Extremely less important 1/9
1
a ji = (3)
aij
With a = aij and aij = 1 (reciprocal value) where a is the value of each fac-
tor i and j are the rows and columns respectively (Saaty, 1977). Finally, the linear
combination method is used to determine the weights of each criterion by the
approximate method of computing eigenvectors (Vpi). The eigenvectors are ob-
tained by calculating their geometric means per row. The Vpi is determined by
the following formula:
n
V ρi =n ∏ i =1 N i (4)
V ρi
Wi = (5)
∑ i =1V ρi
n
With: V ρi eigenvector of each criterion, Ni value of each criterion. The
weighting coefficient Wi is determined as follows
The binary comparison matrix and criteria weights for each criterion and for
the three indicators are reported in Table 5.
3.3.4. Evaluation of the Decision Criteria
Various methods are applied for the evaluation of decision criteria in multicrite-
ria analysis. In this study, to evaluate the decision criteria, the full aggregation
method by weighting used by Joperin (1995) and Saley (2003) was implemented.
It consists of multiplying each criterion or indicator by its weighting coefficient
and then adding the results to produce a fitness index according to the following
equation:
S = ∑ i =1 wi xi
n
(6)
With: S the final result; Wi: the weight of the criteria i; Xi; standardized value
of the criterion i.
This method was used for the climate vulnerability and environmental indicators.
DOI: 10.4236/gep.2022.106015 241 Journal of Geoscience and Environment ProtectionA. P. Gouzile et al.
Table 5. Weighting of risk factors for malaria.
Coefficient of weighting
Parameters Eigenvector (EV)
(CP)
Rain 2.6 0.51
Maximum temperature 1.3 0.26
Minimum temperature 0.4 0.08
Relative humidity 0.8 0.15
Climatic factors 2.47 0.64
NDWI 2.67 0.43
NDVI 1.55 0.25
Population 0.64 0.10
Altitude 0.37 0.06
Distance to water sources 1 0.16
Environmental factors 1 0.26
Land use 0.41 0.10
The realization of the “malaria risk” map consists in transferring in space the
different values resulting from the addition of the standardized and weighted
values of each indicator added to the land use. A reclassification of the factors
allowed the realization of thematic maps with two classes expressed in risk, namely
low risk and high risk. The number of classes is fixed at two for a better readabil-
ity and a good interpretation of the map.
3.3.5. Map Validation Method
The validation of the maps consists in the analysis of the uncertainty and error
of the maps. The analysis consists of calculating the uncertainties of the average
of the different parameters of the main indicators of power and vulnerability.
The uncertainty is calculated by the following equation:
σ
∆X = (7)
m
With: Δx: the uncertainty of the mean of the data series; σ: the standard devia-
tion of the data series; m: the number of data.
To determine the confidence interval, an expansion factor (K) is then calcu-
lated. The determination of this factor is based on the principle of statistical cal-
culation of the expanded uncertainty. The K factor allows the definition of an
interval of sufficient range to have a high confidence in the results. The expres-
sion of this factor is as follows:
E−X
K= (8)
σ
With: K: expansion factor; E: extreme value of the statistical series. It can be
the maximum or minimum of the series; σ: standard deviation of the series.
DOI: 10.4236/gep.2022.106015 242 Journal of Geoscience and Environment ProtectionA. P. Gouzile et al.
The confidence level of the different parameters was deduced from the differ-
ent values of K. Thus, K = 1 for the 68% confidence level, K = 2 for the 95% con-
fidence level, and K = 3 for the 99% confidence level (Yao et al., 2014).
4. Results
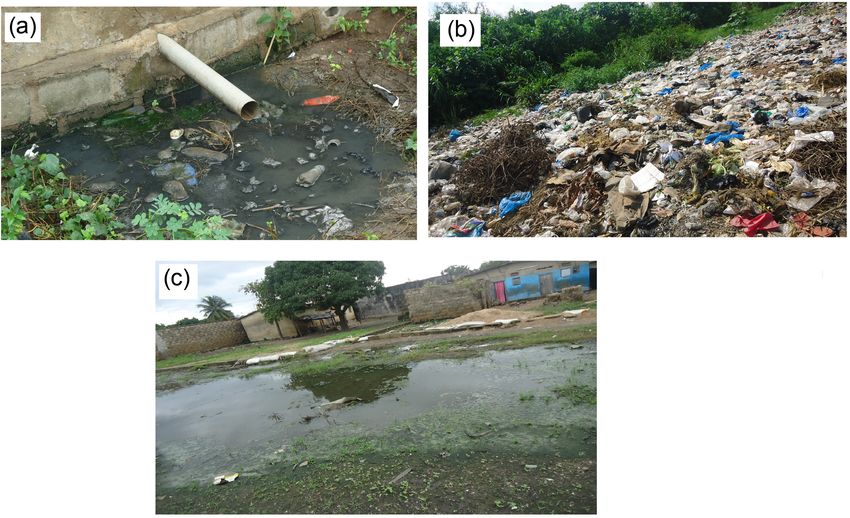
4.1. Land Use
The land use map shows five landscape classes, which are dense forest, degraded
forest, crops (fallow), water, and bare soil and habitats. The main classes are
dense forest, degraded forest and crops/fallow. Dense forest appears as a support
in which the other classes are embedded.
The dense forest is observed practically throughout the study area at various
points. However, it is more present in the west of the study area, precisely at the
level of the park of Marahoué. It occupies 44.8% of the total area. Degraded for-
est, crops and fallow land, bare soil and water occupy 22.7%, 22.90%, 9.1% and
0.5% of the total area, respectively (Figure 2). This dense forest has practically
disappeared due to various human activities. These include deforestation for
agriculture (presence of crops/fallow) and land use planning with the progress of
urbanization through the policy of decentralization. This disappearance of the
forest could also be due to the decrease in rainfall in this region. In the southern
part of the region, the presence of degraded forest is noted.
4.2. Malaria Risk Related to Climatic Factors
The malaria risk according to climatic factors is represented in Figure 3. The
Figure 2. Land use map of the Marahoué region.
DOI: 10.4236/gep.2022.106015 243 Journal of Geoscience and Environment ProtectionA. P. Gouzile et al.
Figure 3. Malaria risk map related to climatic factors.
analysis of the map shows two classes:
- The low risk class is located in the north and central-east of the study area and
is characterized by low rainfall of less than 1152 mm, very high maximum
temperatures (35˚C) and high relative humidity (>60%). This risk represents
51.64% of the total area and occupies almost all of the Zuénoula health dis-
trict and part of the Bouaflé district. These temperatures limit the sporogonic
development of plasmodium falciparum in the mosquito and therefore do
not favor malaria transmission.
- The high risk class covers 48.36% of the total area of the study area. This zone
extends from the extreme northwest through the central west of the region to
the south. It also affects the Marahoué National Park and is characterized by
abundant rainfall, high maximum temperatures (30˚C) and very high relative
humidity (>75%). This risk is limited to the Sinfra health district and certain
localities in Bouaflé and Zuénoula. Rainfall favors the presence of watering
holes and perennial ponds, which constitute mosquito breeding grounds. The
temperature favors the reproduction of the vector. These factors present fa-
vorable conditions for the proliferation of the vector, the maturity of the pa-
rasite and the transmission of the disease.
4.3. Malaria Risk Related to Environmental and/or
Ecological Factors
The risk due to environmental factors reflects the vulnerability of malaria due to
variables such as vegetation cover, soil moisture, distance to water points (hy-
DOI: 10.4236/gep.2022.106015 244 Journal of Geoscience and Environment ProtectionA. P. Gouzile et al.
drology), altitude and population density. Mosquitoes, the vectors of malaria,
and Plasmodium falciparum thrive in these factors. Figure 4 presents the mala-
ria risk map according to environmental and/or ecological parameters. This map
is identified in two classes of degree of risk.
- The low risk class is located in the north of the region and in certain localities
of Bouaflé (Tibiéta, Bouafla.). It covers 44.71% of the region and is characte-
rized by a degradation of the vegetation cover, a low soil moisture level due
to low rainfall, and high altitudes. These factors reflect the low transmission
of the disease. However, some endemic areas (Zuénoula) can be detected be-
cause of environmental conditions characterized by the presence of domestic
wastewater due to the failure of the sanitation network (lack of proper pip-
ing), and household waste deposits (Photo 1).
- High risk covers more than half of the region (55.29%) and is located in the
south of the region, specifically in the departments of Sinfra and Bouaflé, in
the area of the Marahoué National Park and near Lake Kossou. This area is
characterized by the presence of water points, low altitudes and a high popu-
lation density. The vegetation cover is dense, resulting in soil moisture. This
zone is characterized by the presence of large cities in the region and is con-
fronted with a sanitation problem with the presence of garbage dumping at
every turn (Photo 1).
4.4. Global Malaria Risk Mapping
The overall malaria risk map is derived from the linear combination of the climate,
environmental, and land use risk maps according to their respective weights
(Figure 5).
Figure 4. Malaria risk map by environmental factors.
DOI: 10.4236/gep.2022.106015 245 Journal of Geoscience and Environment ProtectionA. P. Gouzile et al.
Photo 1. Proliferation area of the Anopheles vector of malaria in the Marahoué region (a)
Wastewater (b) Household garbage dump and (c) Puddle.
Figure 5. Global malaria risk map.
Observation of the map shows that the southern and northwestern parts of the
region are more vulnerable to malaria transmission with a high risk level of
50.70%. Located in the pre-forest part of the region, these areas are characterized
by abundant rainfall favoring the presence of stagnant water points which con-
stitute the places of proliferation of the mosquito, temperatures between 21 and
30˚C leading to the virulence, aggressiveness and infestivity of the vector (the
mosquito) of malaria and the presence of vegetation and water points leading to
DOI: 10.4236/gep.2022.106015 246 Journal of Geoscience and Environment ProtectionA. P. Gouzile et al.
Table 6. Statistics of risk factor assessment criteria.
Standard
Parameters max min average Total Uncertainty K NC
deviation
Land use 5 1 4.07 1.32 21,760,440 0.0003 1 68
Climate sensitivity 4.35 2.52 3.2 0.48 39,716 0.002 2 95
Ecological sensitivity 4.8 1 3.02 0.79 41,063 0.004 2 95
Malaria risk map 5 1 2.96 1.1 39,519 0.006 2 95
high soil moisture. It is a swampy area with the presence of rice-growing low-
lands due to the dense hydrographic network.
The low risk class covers 49.03% and occupies the north (Zuénoula health dis-
trict), the center (Tibiéta, Bouafla, Angovia, Gbégbéssou, etc.), the rainfall in this
zone is low and the temperatures are high (35˚C).
4.5. Validation of Risk Maps
Validation of the thematic maps was done by statistical analysis of the error or
uncertainty associated with each map (Table 6). The uncertainties calculated on
the malaria risk assessment factors vary from 0.002 to 0.006. Overall, the errors
in the construction of these maps are minimal. The confidence level of the dif-
ferent malaria risk maps is significant (95%).
For the land use map, the uncertainty is 0.0003 or 3E−4 with a confidence in-
terval of 68% which means that the land use map is not a good approximation of
the areas at risk of these diseases.
5. Discussion
The use of Geographic Information Systems (GIS) and multi-criteria analysis in
the Marahoué region resulted in the production of a climatic risk map, an envi-
ronmental risk map and a land use map. The linear combination of these maps
allowed the identification of potential malaria risk sites in this region in order to
predict malaria infection and conduct effective malaria control.
The map of malaria risk due to climatic factors has a high risk of 48.36% to
predict malaria in the Marahoué region. This risk is higher in the south, west,
and northwest of the region. The south and west are characterized by abundant
rainfall, temperatures ranging from 21˚C to 31.5˚C, and very high humidity
(>75%). This result shows that heavy rainfall seems to predict malaria risk. Ac-
cording to Craig et al. (1999) a minimum of 80 mm of rainfall over a consecutive
four-month period with average temperatures is essential for malaria transmis-
sion. Heavy rainfall results in the formation of temporary or permanent pools
and puddles that are breeding grounds for mosquito larvae and abundant vector
populations. According to Zhao et al. (2020), a weekly rainfall of more than 10
mm leads to the development of mosquitoes. The high humidity associated with
it, favors mosquito survival (Gouataine & Ymba, 2018). Rainfall affects mosquito
DOI: 10.4236/gep.2022.106015 247 Journal of Geoscience and Environment ProtectionA. P. Gouzile et al.
dynamics (Ndiaye et al., 2006) and increases the daily entomological inoculation
rate of the vector (Dolo et al., 2003). They account for 60% of malaria anomalies
(Niangaly, 2009). The risk due to environmental or ecological factors is domi-
nated by a high degree of risk. This environmental risk is more marked in the
south of the region and covers 55.29% of the area. This high risk is due to the
high chlorophyll density (NDVI), high soil moisture (NDWI) reflecting the
presence of swampy areas, low altitudes and the presence of water points. This
result shows that NDVI, NDWI, altitude and water points predict malaria risk.
This result confirms the work of Ferrão et al. (2021) carried out in the village of
Sussundenga in Mozambique which states that human modified landscapes are
conducive to malaria vectors. This result is very important because it shows that
the Tasselrd-cap transformation generally used to study phenomena related to
the environment is a technique that can be used in epidemiology. Studies by
Martiny et al. (2012) in Bancoumana (Mali) have shown that NDVI can be used
as an indicator of rainfall when rainfall data are lacking. Malaria transmission is
accelerated, when the NDVI value exceeds the threshold of 0.36. These studies
show that there is a 15-day lag between the increase in NDVI and the increase in
malaria incidence, which is explained by the duration of the development of
Anopheles larvae. With respect to altitude, the results show that this parameter
influences the risk of malaria (Sahondra et al., 2001). Water points and market
gardening areas maintain moisture for vector survival and transmission even in
dry season (Martiny et al., 2012; Ferrão et al., 2021). This risk could be due to
land use types (Ferrão et al., 2021). Indeed, the land use map shows that more
than half of the region is occupied by crops and fallow. The southern part of the
region, identified as a high-risk area, is dominated by food crops such as rice
cultivation in the lowlands. These crops influence the distribution of malaria and
therefore constitute risk factors (Dossou-Yovo et al., 1998). The annual cycle of
vector abundance is linked to the variation in rainfall patterns and rice cultiva-
tion phases (Ravoahangimalala et al., 2003). And the density of vector aggres-
siveness is very high after the pricking of young rice shoots (Dossou-Yovo et al.,
1998). Rainfall, relative humidity, temperatures (min and max), elevation, NDVI,
NDWI, population density, land use, and distance to permanent water points are
significant variables in predicting malaria risk (Dansou & Odoulami, 2015;
Ferrão et al., 2021; Zewga, 2021). This method prioritizes malaria control based
on climate, remote sensing, and mapping data. The distribution of the study area
showed that 50.70% of the total area belongs to the high risk class and 49.03% to
low risk. This indicates that the Marahoué region appears to be endemic for ma-
laria. The calculation of uncertainties and confidence level shows that the pro-
posed model for malaria prediction classifies well the risk areas with a good ac-
curacy. The uncertainties are low and the confidence level of 95% gives a high
reliability of the maps and allows the model to be used validly. These low uncer-
tainties could be due to the fact that these parameters come from sources that
have already been validated and are therefore more reliable. The climatic and
DOI: 10.4236/gep.2022.106015 248 Journal of Geoscience and Environment ProtectionA. P. Gouzile et al.
environmental data (remote sensing data) introduced in the GIS allowed the
prioritization of malaria risk areas.
6. Conclusion
Modelling using the multi-criteria analysis combination method was used to es-
tablish malaria risk maps, identified in two classes: the low risk class and the
high risk class. The approach adopted in this work uses both climatic and envi-
ronmental data. This approach has many advantages as it has contributed to the
identification of malaria vulnerable areas for malaria prediction and rational de-
cision making. However, these methods have limitations because the estimation
of the parameters often lacks precision due to insufficient or completely missing
data in some parts of the study area. Thus, sufficient data (health, climatic and
environmental) should be available for the entire region to better determine all
the risk factors for the spread of malaria in the region. Also, this methodological
approach and the tools could be used at the national level for an effective fight
against this pathology throughout the country. GIS remains an invaluable con-
tribution to human health management.
Acknowledgements
The authors think the National Meterology (SODEXAM) for rainfall data, tem-
perature minimum and maximum data and relative humidity data acquisition.
Author Contribution
Gouzile Assikohon Pulchérie, Bama Martial Zamina Bi Yourou Guillaume and
developed the ideas and wrote the article with the contribution of Tiembre Issa-
ka. Tié Albert Goula Bi and Soro Gneneyougo Emile supervised the paper. Yapi
Ellélé Aimé contributed to the acquisition of data.
Conflicts of Interest
The authors declare no conflict of interest.
References
Beale, L., Abellan, J. J., Hodgson, S., & Jarup, L. (2008). Methodologic Issues and Ap-
proaches to Spatial Epidemiology. Environmental Health Perspectives, 116, 1105-1110.
https://doi.org/10.1289/ehp.10816
Craig, M. H., Snow, R. W., & Le Sueur, D. A. (1999). Climate-Based Distribution Model
of Malaria Transmission in Sub-Saharan Africa. Parasitology Today, 15, 105-111.
https://doi.org/10.1016/S0169-4758(99)01396-4
Dansou, B. S., & Odoulami, L. (2015). Paramètres climatiques et occurrence du paludisme
dans la commune de Pobè, au sud-est du bénin. In XXVIIIe Colloque de l’Association
Internationale de Climatologie (pp. 129-132).
Diomandé, B. I., Coulibaly, K. A., & Soumahoro, S. P. (2017). Variabilité climatique et
recrudescence du paludisme a Niangon dans la commune de Yopougon-Abidjan (Côte
d’ivoire). Revue Ivoirienne de Géographie des Savanes, 3, 89-106.
DOI: 10.4236/gep.2022.106015 249 Journal of Geoscience and Environment ProtectionA. P. Gouzile et al.
https://docplayer.fr/88359004-Variabilite-climatique-et-recrudescence-du-paludisme-a
-niangon-dans-la-commune-de-yopougon-abidjan-cote-d-ivoire.html
Dolo, A., Camara, F., Poudiougo, B., Touré, A., Kouriba, B., Bagayogo, M., Sangaré, D.,
Diallo, M., Bosman, A., Modiano, D., Touré, Y. T., & Doumbo, O. (2003). Épidémiolo-
gie du paludisme dans un village de savane soudanienne du Mali (Bancoumana): Étude
entomo-parasitologique et clinique. Santé Publique, 2319, 308-312.
Dossou-Yovo, J., Ouattara, A., Doannio, J. M. C. et al. (1998). Enquêtes paludométriques
en zone de savane humide de Côte d’Ivoire. Médecine Tropicale, 58, 51-56.
Eholié, S. P., Ehui, E., Adou-Bryn, K., Kouamé, K. E., Tanon, A., Kakou, A., Bissagnené,
E., & Kadio, A. (2004). Paludisme grave de l’adulte autochtone à Abidjan (Côte d’Ivoire).
Santé Publique Bulletin de la Société de Pathologie Exotique, 97, 340-344.
Ferrão, J. L., Earland, D., Novela, A., Mendes, R., Ballat, M. F., Tungaza, A., & Searle, K.
M. (2021). Mapping Risk of Malaria as a Function of Anthropic and Environmental Con-
ditions in Sussundenga Village, Mozambique. International Journal of Environmental
Research and Public Health, 18, 2568.
https://doi.org/10.3390/ijerph18052568
Fosah, S., Mbouna, A. D., Efon, E., Achu, D. F., Andre, L., & Dikande, A. M. (2022). In-
fluences of Rainfall and Temperature on Malaria Endemicity in Cameroon: Emphasis
on Bonaberi District. Journal of Geoscience and Environment Protection, 10, 46-66.
https://doi.org/10.4236/gep.2022.103004
Gething, P. W., Boeckel, T. P. V., Smith, D. L., Guerra, C. A., Patil, A. P., Snow, R. W., &
Hay, S. I. (2011). Modelling the Global Constraints of Temperature on Transmission of
Plasmodium falciparum and P. vivax. Parasites & Vectors, 4, 92.
https://doi.org/10.1186/1756-3305-4-92
Gouataine, S. R., & Ymba, M. (2018). Variabilité climatique et émergence du paludisme a
Bongor (Tchad). Revue Espace, Territoires, Sociétés et Santé, 1, 143-156.
https://retssa-ci.com/index.php?page=detail&k=40
Gramado, S., Ettien-Ablan, A. M., N’Gronma, N. A. B., Yao, K. A., Tanner, M., & Obrist,
B. (2006). La vulnérabilité des citadins à Abidjan en relation avec le paludisme: Les
risques environnementaux et la monnayabilité agissant à travers le palu sur la vulnéra-
bilité urbaine. Vertigo, 1767, 13. https://doi.org/10.4000/vertigo.1767
Guerra, C. A., Gikandi, P. W., Tatem, A. J., Noor, A. M., Smith, D. L., Hay, S. I., & Snow,
R. W. (2008). The Limits and Intensity of Plasmodium falciparum Transmission: Impli-
cations for Malaria Control and Elimination Worldwide. PLOS Medicine, 5, 300-311.
https://doi.org/10.1371/journal.pmed.0050038
Hay, S. I., Guerra, C. A., Gething, P. W., Patil, A. P., Tatem, A. J., Noor, A. M., Kabaria,
C. W., Manh, B. H., Elyazar, I. R. F., Brooker, S., Smith, D. L., Moyeed, R. A., & Snow,
R. W. (2009). A World Malaria Map: Plasmodium falciparum Endemicity in 2007. PLOS
Medicine, 6, 1-18. https://doi.org/10.1371/journal.pmed.1000048
Joperin, F. (1995). Méthode multicritère d’aide à la décision et SIG pour la recherche d’un
site. Revue internationale de géomatique, 5, 37-51.
Jourda, J. P., Saley, M. B., Djagoua, E. V., Kouamé, K. J., Biemi, J., & Razack, M. (2006).
Utilisation des données ETM+ de Landsat et d’un SIG pour l’évaluation du potentiel en
eau souterraine dans le milieu fissuré précambrien de la région de Korhogo (nord de la
Côte d’Ivoire): Approche par analyse multicritère et test de validation. Revue de Télédétec-
tion, 5, 339-357.
Konan, Y. L., Koné, A. B., Doannio, J. M. C., Fofana, D., & Odehouri-Koudou, P. (2009).
Transmission du paludisme à Tiassalékro, village de riziculture irriguée situé en zone
sud forestière de Côte d’Ivoire. Bulletin de la Société de pathologie exotique, 102, 26-30.
DOI: 10.4236/gep.2022.106015 250 Journal of Geoscience and Environment ProtectionA. P. Gouzile et al.
Kotchi, S. O., Bouchard, C., Ludwig, A., Rees, E. E., & Brazeau, S. (2019). Utilisation des
images d’observation de la terre pour améliorer la cartographie des risques de maladies
associées au changement climatiques. Relevé des maladies transmissibles au Canada, 45,
148-158. https://doi.org/10.14745/ccdr.v45i05a04f
Kouame, A. K. D., Fofana, K. E. M., Mobio, A. B. H., Kassi, A. J.-B., Kouame, K. F., &
Djagoua EM’moi, V. (2017). Cartographie De La Sensibilite Aux Maladies Environne-
mentales Respiratoires Dans Le District Sanitaire De Koumassi-Port-Bouët-Vridi (Sud
De La Côte d’Ivoire). European Scientific Journal, 13, 202.
https://doi.org/10.19044/esj.2017.v13n5p202
Kouamé, A. K. D., Mobio, A. B. H., Djagoua, E. M. V., Affian, K., & Pottier, P. (2011).
Cartographie du risque bilharzienne à partir de l’utilisation combinée de la télédétec-
tion et du système d’information géographique (18 p.).
Koudou, A., Adiaffi, B., Assoma, T. V., Sombo, A. P., Amani, E. M. E., & Biemi, J. (2013).
Conception d’un outil d’aide à la décision pour la prospection des eaux souterraines en
zone de socle du sud-est de la Côte d’Ivoire. Geo-Eco-Trop, 37, 211-226.
Martiny, N., Dessay, N., Yaka, P., Toure, O., Sultan, B., Rebaudet, S., Broutin, H., Piar-
roux, R., Chiapello, I., Sagara, I., Fontaine, B., Sissoko, M., Jeanne, I., Doumbo, O., &
Gaudart, J. (2012). Le climat, un facteur de risque pour la santé en Afrique de l’ouest.
La meteorology, No. Spécial AMMA, 73-79. https://doi.org/10.4267/2042/48135
Meyer-Waarden, L., & Zeitoun, H. (2005). Une comparaison empirique de la validité
prédictive de la méthode de composition, de l’analyse conjointe et de l’analyse conjointe
hybride. Recherche et applications en marketing, 20, 39-58.
https://doi.org/10.1177/076737010502000304
Morjani, Z. (2003). Conception d’un système d’information à référence spatiale pour la
gestion environnementale, application à la sélection de sites potentiels de stockage de
déchets ménagers et industriels en région semi-aride (Souss, Maroc) (300 p.). Thèse de
Doctorat, Université de Genève.
Ndiaye, P. I., Bicouta, D. J., Mondetb, B., & Sabatiera, P. (2006). Rainfall Triggered Dy-
namics of Aedes Mosquito Aggressiveness. Journal of Theoretical Biology, 243, 222-229.
https://doi.org/10.1016/j.jtbi.2006.06.005
Niangaly, H. (2009). Epidémiologie du paludisme dans le village de la plaine du pays do-
gon du Mali: Pongonon (129 p.). Thèse de médecine à l’université de Bamako.
Oluwafemi, J., Babalola, S. O., Mukaila, I. O., & Badewa, A. O. (2022). GIS-Based Ap-
proach to Risk Mapping of Lassa Fever Outbreak in Akure South Local Government
Area, Nigeria. The International Archives of the Photogrammetry, Remote Sensing and
Spatial Information Sciences, XLVI-4/W3-2021, 147-153.
https://creativecommons.org/licenses/by/4.0
PNLP (Programme National de lutte contre le paludisme). Plan national de suivi et éval-
uation de la lutte contre le paludisme 2021-2025 (84 p.).
Rapport Annuel sur la Situation Sanitaire (RASS) 2018 édition 2019 (407 p.).
Ravoahangimalala, R. O., Rakotoarivony, H. L., Le Goff, G., & Fontenille, D. (2003).
Écoéthologie des vecteurs et transmission du paludisme dans la région rizicole de basse
altitude de Mandritsara, Madagascar. Entomologie médicale. Le Bulletin de la Société
de Pathologie Exotique, 96, 323-328.
Saaty, T. L. (1977). A Scaling Method for Priorities in Hierarchical Structures. Journal of
Mathematical Psychology, 15, 234-281. https://doi.org/10.1016/0022-2496(77)90033-5
Sahondra Harisoa, L. J., Pietra, V., Tombo, M. L., Albonico, M., Ranaivo, L. H., De Gior-
gi, F., Razanakolona, J., D’Ancona, F. P., Sabatinelli, G., Raveloson, A., Modiano, D., &
Rakotondramarina, D. (2001). Système de surveillance épidémiologique et d’alerte du
DOI: 10.4236/gep.2022.106015 251 Journal of Geoscience and Environment ProtectionA. P. Gouzile et al.
paludisme sur les Hautes Terres Centrales de Madagascar: Résultats 1999-2000. Arc-
hives de l’Institut Pasteur de Madagascar, 67, 21-26.
Saley, M. B. (2003). Système d’information hydrogéologique à référence spatiale, discon-
tinuité pseudo-image et cartographie thématique des ressources en eau de la région
semi-montagneuse de Man (Ouest de la Côte d’Ivoire) (209 p.). Thèse de Doctorat,
Université de Cocody.
Somé, Y. C. S. (2010). Modélisation de la distribution spatiale des formes moleculaires M
et S d’Anophèles ganbiae Sensu Stricto au Burkina Faso avec les SIG et l’analyse spa-
tiale (309 p.). Thèse de doctorat à l’université d’Orléans: Spécialité, Géographie-Amé-
nagement-Environnement.
WHO (2021). World Malaria Report 2021. Key Messages Information Pack, 24 p.
Yao, A. B., Goula, B. T. A., Kane, A., Mangoua, O. M. J., & Kouassi, K. A. (2014). Carto-
graphie du potentiel en eau souterraine du bassin versant de la Lobo (Centre-Ouest,
Côte d’Ivoire): Approche par analyse multicritère. Hydrological Sciences Journal, 61,
856-867.
Zewga, M. (2021). GIS Based Malaria Risk Assessment. Health Science Journal, 15, 7.
Zhao, X., Thanapongtharm, W., Lawawirojwong, S., Wei, C., Tang, Y., Zhou, Y., Sun, X.,
Cui, L., Sattabongkot, J., & Kaewkungwal, J. (2020). Malaria Risk Map Using Spatial
Multi-Criteria Decision Analysis along Yunnan Border during the Pre-Elimination Pe-
riod. American Journal of Tropical Medicine and Hygiene, 103, 793-809.
https://doi.org/10.4269/ajtmh.19-0854
DOI: 10.4236/gep.2022.106015 252 Journal of Geoscience and Environment ProtectionYou can also read