PHYSICAL INFRASTRUCTURE - Waltham Forest Infrastructure Delivery Plan 2020 - Waltham Forest Council
←
→
Page content transcription
If your browser does not render page correctly, please read the page content below
PHYSICAL
     INFRASTRUCTURE

Waltham Forest Infrastructure Delivery Plan 2020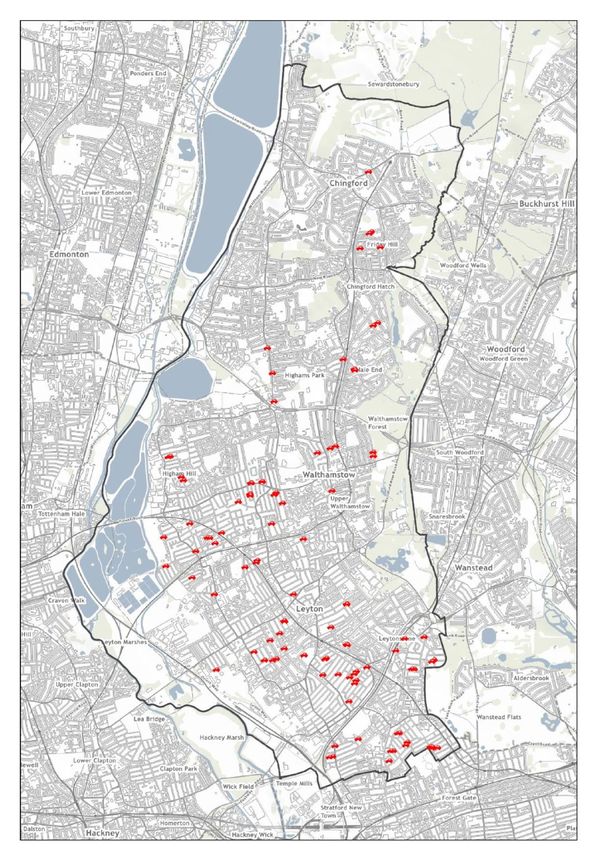
Chapter 3 - Transport Infrastructure
  Introduction
3.1   Sustainable transport infrastructure will play a fundamental role in the economic, social
      and environmental future of the borough to 2035 and beyond. Our transport network is
      the backbone of our daily lives, our local economy and our wider place and role in
      London.

3.2   There are two London Underground lines in Waltham Forest. The Victoria line has two
      stations, Walthamstow Central and Blackhorse Road, connecting towards the West End,
      and a further two stations on the Central line connect the south east of the borough to
      Stratford and the City of London, at Leyton and Leytonstone. In recent years, the
      Victoria line has benefited from a signalling upgrade and rolling stock replacement, now
      operating at up to 36 trains per hour in each direction. The Central line has been
      identified as the next Underground line to receive a significant upgrade although the
      programme for this is not yet known.

3.3   Waltham Forest is served by two rail lines on the London Overground network. The
      Chingford to Liverpool Street line is the main radial commuter route with five stations in
      the borough connecting towards the City of London. The Barking to Gospel Oak line is
      an outer London orbital route with four stations in the borough. Both lines are soon to
      benefit from the introduction of new rolling stock. In the case of the Barking to Gospel
      Oak line, the existing two-car diesel units will be replaced by four-car electric trains
      providing a 130% increase in passenger capacity.

3.4   The strategic highway network in Waltham Forest consists of the A12 and the A406
      North Circular Road. Both roads have full grade separation and consequently have a
      limited number of access points for borough residents. Although they provide strategic
      access, they also contribute to the challenges facing Waltham Forest residents due to
      severance by dividing local neighbourhoods and acting as a barrier for cycle and
      pedestrian movement. Traffic congestion on these routes has increased and severely
      affects borough’s carbon emissions, resulting in adverse impacts on air quality and
      quality of life for residents.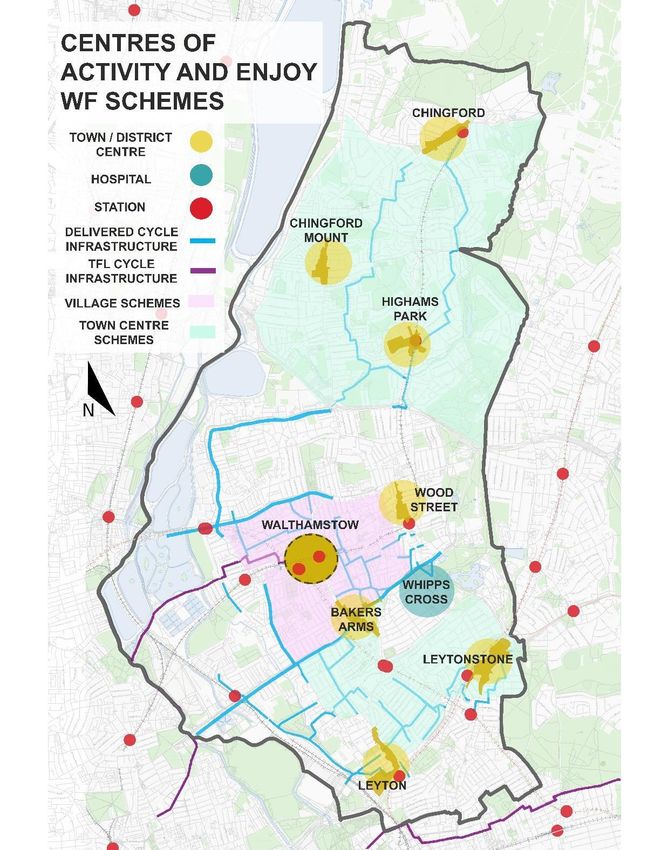
Figure 3.1: Transport in Waltham Forest – key statistics

  Recent Transport Investments
3.5   In 2016, the Council, TfL and London Overground and National Rail successfully
      reopened Lea Bridge station on the national rail Lea Valley line. The new station is a
      core element of plans to regenerate the Leyton and Lea Bridge area, and currently
      supports 572,400 passenger journeys per year (a 29% increase since opening). It is
      expected that this number will rise follwoing the service increases from two to four
trains per hour in 2019. Looking forward, the Council are also investigating the
      feasibility of opening another station at Ruckholt Road at the south of the Leyton and
      Lea Bridge area.

3.6   The Borough is not directly served by stations on the Crossrail 1 (Elizabeth Line) or
      Crossrail 2 alignments; however stations in close proximity to the Borough include
      Maryland and Stratford on Crossrail 11, and Tottenham Hale, Northumberland Park, and
      Angel Road on Crossrail 22. It is a priority of the Borough to improve connections to
      these stations once the service is in operation.

3.7   In 2014, Waltham Forest became one of three Mini Holland3 outer London boroughs,
      securing £30m+ of funding to radically transform local cycling and walking facilities.
      This was supported with further match funding from various sources, resulting in an
      overall investment of £45m. The programme was renamed ‘Enjoy Waltham Forest’ and
      seeks to make the borough safer for cycling and walking, encourage far more people to
      cycle and walk (thereby reducing congestion on the roads) and improve the health and
      fitness of residents through active travel. Over five years the scheme delivered:
             ▪ 22km of segregated cycle lanes
             ▪ 40 modal filters to prevent local streets being used as car thoroughfares
             ▪ 100 junction improvements
             ▪ 700 trees
             ▪ 15 'pocket parks’

3.8   The Waltham Forest Mini-Holland network focusses on the busiest cycle routes, and
      those that are most likely to get busier. The network consists of the following key
      routes:
            ▪ Forest Road
            ▪ Lea Bridge Road
            ▪ Leyton to Blackhorse Road
            ▪ Leyton to Chingford
            ▪ Walthamstow Marsh to Walthamstow Village

3.9   On completion of the scheme in 2021, the Council seeks to continue encouraging active
      travel by implementing Liveable Neighbourhoods schemes.

  1 https://www.crossrail.co.uk/
  2 https://crossrail2.co.uk/
  3 https://enjoywalthamforest.co.uk/about-mini-holland/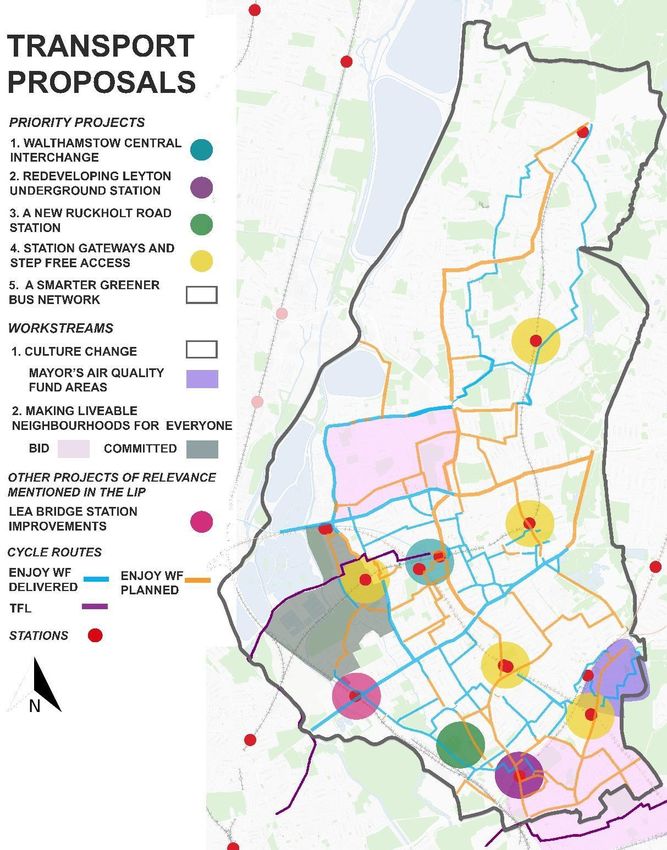
Figure 3.2: Transport geography in Waltham Forest
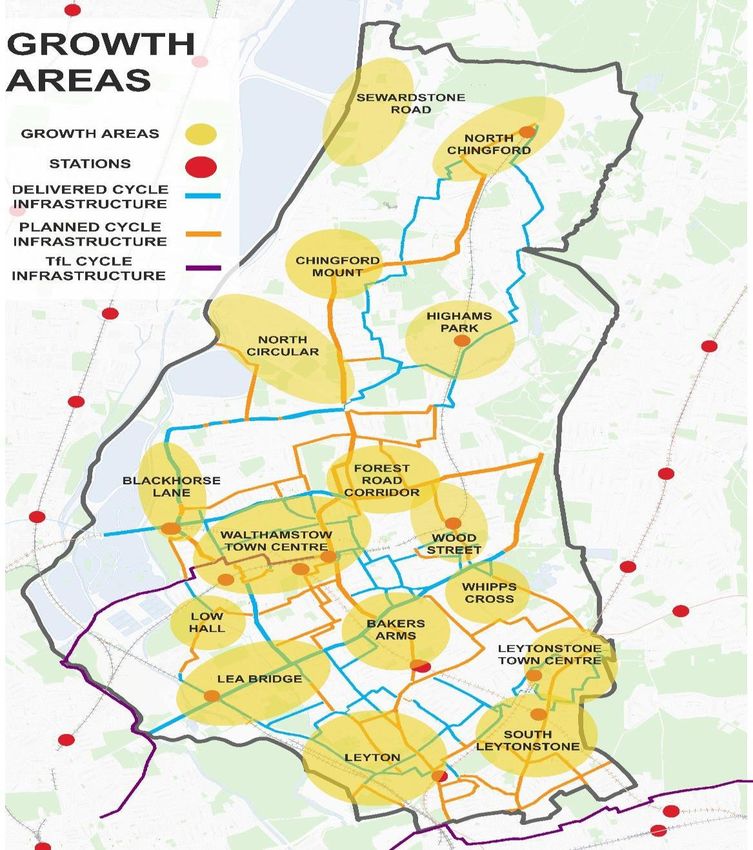
Figure 3.3: Waltham Forest Cycle Network

       North – South Connectivity in the Borough
3.10       There are number of differences in local character, demographics, and public transport
           accessibility across wards within the borough, with each presenting different challenges
           to meeting the Council’s transport objectives and wider Mayors Transport Strategy
           (MTS) outcomes.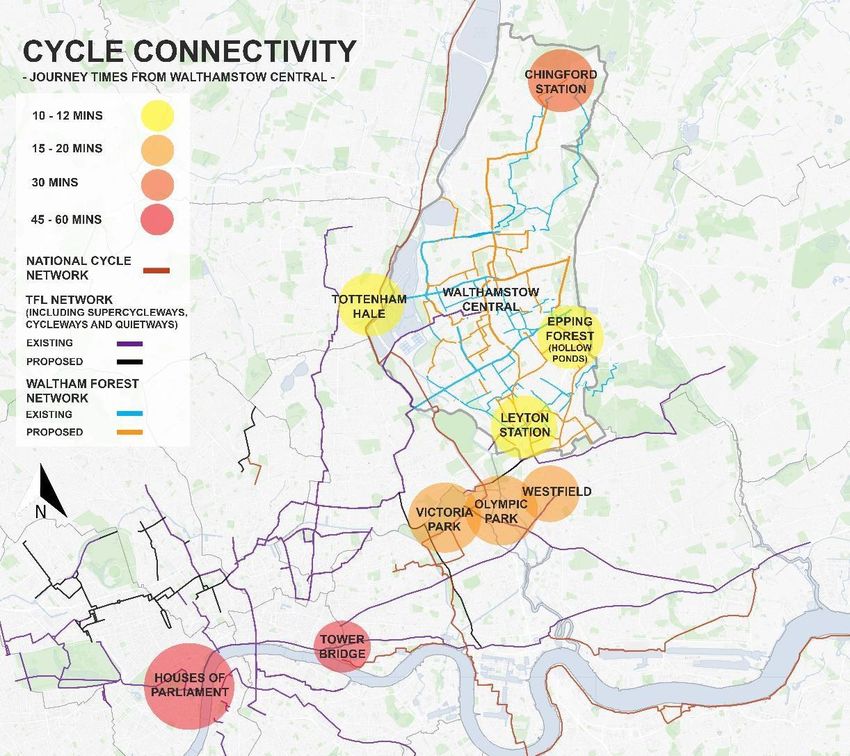
3.11            In the north of the borough, public transport options are less prevalent with only two
                stations located north of the A406 North Circular Road and less frequent and connected
                bus services than wards in the south and central parts of the Borough. Wards in the
                north of the Borough are also typically more affluent, with a higher than average
                population of residents aged over 65, as well as having a much lower density of
                housing.

3.12            In the south and central parts of the Borough, while public transport accessibility levels
                are generally greater, wards in this area have higher density of housing, and in many
                locations are experiencing significant levels of development and population growth.
                This contributes to increased pressure on the public transport network, and
                overcrowding on bus, rail and Underground routes.

3.13            Demographics in the south of the Borough also lead to a higher potential for car-free
                lifestyles, with lower levels of car ownership and a younger population, but also higher
                levels of deprivation. While this demographic make-up in the south of the borough may
                result in less private car travel, where there are gaps in the public transport network
                this can lead to low levels of access to opportunities and services. For example, the
                wards of Cathall and Cann Hall have the lowest levels of car ownership in the borough,
                but also low Public Transport Accessibility Levels (PTAL) in many residential areas.
                Improvements to the public transport and active travel networks are key to improving
                accessibility in these areas of the borough.
       Transport Roles and Responsibilities in the Borough
3.14            Transport for London (TfL)4 are the integrated transport authority responsible for
                meeting the Mayor’s strategy and commitments on transport in London. TfL are
                responsible for:
               • London Underground5 – covering 11 lines, 402km of track and 270 stations.
               • London Overground6 – a group of six routes serving inner and outer London. Of
                   note, the Gospel Oak to Barking line directly serves the borough.
               • Buses7 – TfL manage a fleet of around 9,300 vehicles operating across 675 routes, 50
                   bus stations and more than 19,000 bus stops.
               • Docklands Light Rail (DLR)8 – stretching from Bank and Tower Gateway to Stratford,
                   Beckton, Greenwich, Lewisham London City Airport and Woolwich Arsenal.
               • London Tram Network9 – also operate by TfL.

       4 https://tfl.gov.uk/
       5
           https://tfl.gov.uk/modes/tube/
       6
           https://tfl.gov.uk/modes/london-overground/
       7
           https://tfl.gov.uk/modes/buses/
       8
           https://tfl.gov.uk/modes/dlr/
       9
           https://tfl.gov.uk/modes/trams/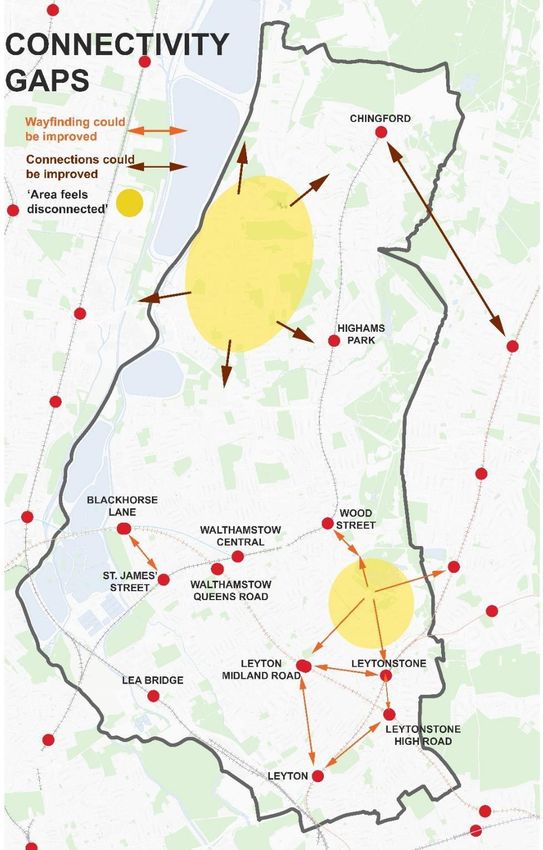
•    Road Network – Responsibility for managing London's road network is shared
               between TfL, Highways England10, and the 32 London boroughs, plus the City of
               London.
                – TfL manage the Transport for London Road Network (the TLRN or London's 'red
                   routes') and are responsible for the maintenance, management and operation of
                   the Capital's 6,000+ sets of traffic lights.
                – Highways England manages the national motorway network, including the M25,
                   M1, M4 and M11.
                – The borough council, as Local Highway Authority (LHA), is responsible for all the
                   remaining roads within their boundaries.

3.15       TfL also work with freight operators and other commercial drivers to encourage more
           efficient deliveries in London.
  Red routes
3.16       London's red routes are a network of key routes such as the A40 or A406 (North Circular
           Road). TfL’s responsibilities include responding quickly to incidents such as floods and
           road traffic collisions; repairing defects such as potholes, damaged signs or street
           lighting; and gritting the roads during the winter. TfL also operate London’s Network
           Management Control Centre (NMCC) and monitor the road network 24 hours a day,
           seven days a week. Thousands of CCTV cameras continually monitor how traffic is
           flowing around the Capital.
  Delivering Sustainable Transport for the Future
3.17       The Council is committed to working with TfL and other stakeholders towards achieving
           the London Mayor’s Transport Investment Strategy (MTS) goals of ‘healthy streets and
           healthy people’, ‘a good public transport experience’ and ‘new homes and jobs’.
           Waltham Forest Council supports the overarching aim of the MTS to ensure that at least
           80% of all trips in London are made on foot, by cycle or using public transport by 2041,
           compared to the figure of 63% today (recognising that there are different targets set for
           central, inner and outer London).

3.18       Further information on Enjoy Waltham Forest can be found at:
           https://enjoywalthamforest.co.uk/about-mini-holland/

3.19       Further information on transport plans and investments in the borough can be found on
           TfL’s website at: https://tfl.gov.uk/info-for/boroughs-and-communities/waltham-forest#on-
           this-page-3

  Transport Strategy and Implementation
3.20       Strategic and local transport investment in the borough is set out in a range of strategy
           and planning related studies. These are summarised below:

  10
       https://www.gov.uk/government/organisations/highways-england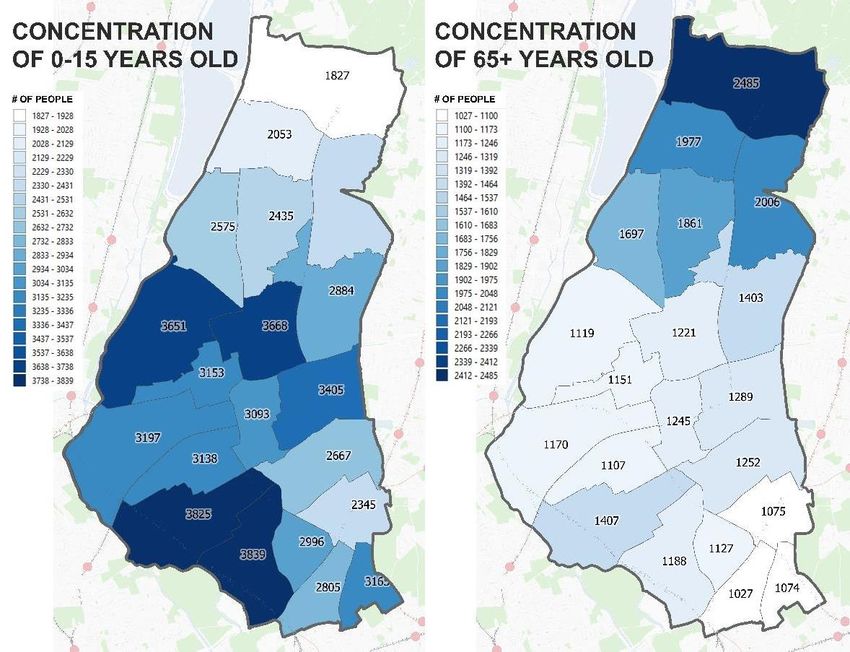
Local Implementation Plan 3 (2019)
3.21   The Local Implementation Plan (LIP) (2019)11 sets out how the Borough proposes to
       deliver the MTS in Waltham Forest. The LIP takes into account relevant planning
       documents including, the Draft London Plan, the Council’s Draft Local Plan, Transport
       Infrastructure Growth and Investment Strategy. The LIP also sets out how Waltham
       Forest will deliver transport investments in the Borough. The LIP (2019) sets out five key
       transport objectives which are included below:
                    1. Shift to a culture of sustainable travel;
                    2. Liveable neighbourhoods for everyone;
                    3. Place-making and access for all at stations;
                    4. Planning a smarter, greener bus network; and
                    5. Delivering a public transport network to meet future demand.
3.22   The LIP also provides a Delivery Plan outlining possible funding sources and timeframes
       for delivery of 31 transport projects and three Major/Liveable Neighbourhoods
       schemes in addition to how these align with the MTS. These interventions are included
       in the Infrastructure Delivery Schedule in Appendix 1.
  Waltham Forest Economic Recovery Action Plan 2020

3.23   The Economic Recovery Action Plan12 sets out how this Council will invest in the
       recovery and future prosperity of Waltham Forest. This Plan focuses on three key
       themes:
          • Business and Economic Recovery – Supporting our High Streets and Businesses
              to re-open, recover and thrive.
          • Home Building – Restarting our housebuilding, increasing the pace of delivery
              and ensuring our new homes have access to open space and local amenities.
          • Living Well – Supporting climate change and investing in sustainable transport.

3.24   The strategy reinforces the Council’s commitment to investing in infrastructure – see
       Figure 3.4 below.

  11 https://www.walthamforest.gov.uk/content/waltham-forest-local-implementation-plan-3
  12 https://www.walthamforest.gov.uk/sites/default/files/Economic%20Recovery%20Action%20Plan%20fPRESS.pdf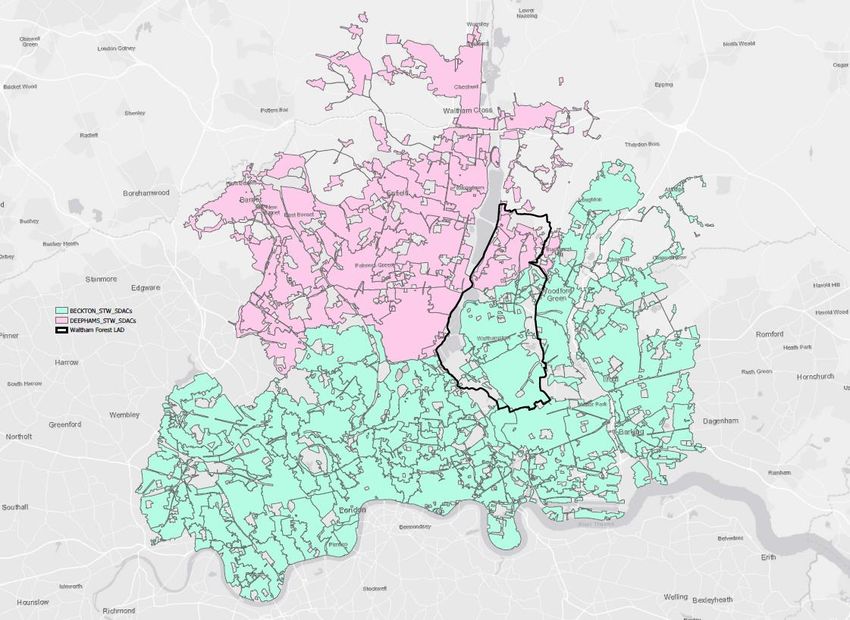
Figure 3.4: extract Waltham Forest Economic Recovery Action Plan 2020
  London Borough of Waltham Forest Strategic Transport Strategy 2018
3.25   The Waltham Forest Strategic Transport Strategy 2018 13identifies five priority projects
       and two complementary workstreams that support the proposed regeneration and
       growth in the Borough, the five priority projects are outlined below:
             1) Walthamstow Central: Transport Interchange for a Major Centre in London
             2) Redeveloping Leyton Underground Station: Meeting Growing Demand
             3) A new Ruckholt Road Station: Unlocking the Leyton Growth Area
             4) Station Gateways: Investment in Place-Making and Access for All
             5) Planning a Smarter, Greener Bus Network

3.26   The two work streams are included below:
             • Making Liveable Neighbourhoods for Everyone
             • Culture Change: Shift to Sustainable Travel and Green Vehicles

3.27   Further details are included in below.
  Vision 2020, Cycling in the London Borough of Waltham Forest (2015 – 2020)
3.28   The Waltham Forest 2020 Cycling Vision 14reviews the work done so far in improving
       Waltham Forest’s cycling conditions as well as the plans for the forthcoming years. With
       2020 in mind, it sets the main target of achieving a 10% cycling mode share across all
       trips by all residents. Following on from the Mini-Hollands programme, the borough
       aims to maintain the same objectives around:

             •    Cycling: To substantially increase cycling in the borough and to make it an
                  attractive and mainstream mode of transport;

  13 https://democracy.walthamforest.gov.uk/documents/s60599/appendix%20A%20-

  %20transport%20strategy%20050318.pdf
  14 https://www.enjoywalthamforest.co.uk/wp-content/uploads/2015/01/018978-Mini-Holland-Cycling-Strategy-v2-FINAL.pdf
• Modal shift: To shift a significant proportion of short local car trips to the bike;
• Better public spaces: To improve the look and feel of public spaces;
• Economic regeneration: To support the growth of our local economy by
encouraging people to walk and cycle to their local town centres;
• Safety: Improve actual and perceived safety for cyclists on our streets;
• Health: To reduce the burden of preventable disease in the borough by
increasing the number of adults and children incorporating physical activity
into their daily routines; and
• Developments: Encourage developers to build upon this infrastructure by
developing sustainably and putting cycling first in their transport proposals.
3.28 The 2020 Vision focuses primarily on cycling. An expanded version is currently being
developed and due for publication in 2020, which will focus on not just cycling but also
walking up to 2025.
Chingford to Stratford Appraisal – Re-Introducing a Train Service (2010)
3.29 This document15 examines the operational and economic feasibility of reintroducing a
train service between Chingford and Stratford, and also of reopening Lea Bridge Station,
which would be served by this re-instated service. The report concludes that a regular
15-minute interval service between Chingford and Stratford is operationally feasibly
and would be primarily used by passengers accessing Stratford and the Docklands area.
Regarding development of a station at Lea Bridge Road it was concluded this would be
pursued separately as part of broader regeneration plans in this area.
Figure 3.5: Proposed Hall Farm Curve
15 Chingford to Stratford Rail Line - RailfutureRegional Transport Policy
London Electric Vehicle Infrastructure Delivery Plan (2019)
3.30 The Mayor of London developed the Electric Vehicle Infrastructure Delivery Plan16 to
support Transport and Environment Strategies commitment to delivering zero emission
road transport, and a zero-carbon city by 2050. The delivery plan acknowledges the
primary existing barrier to uptake is availability – or perceived availability - of charging
infrastructure, increasing capacity of EV charging is key to facilitating planned growth.
The primary aims and recommendations are that public charge points should be open
to all allowing increased public confidence in charging infrastructure, a mix of rapid and
slower chargers are needed to support different user groups, the streetscape impact of
these should be reduced where possible.
The London Plan – Intend to Publish (2019)
3.31 The Intend to Publish London Plan (2019)17 sets out the overall spatial development
strategy for London, including a vision of an integrated economic, environmental,
transport and social framework for the development of London over the next 20– 25
years. The London Plan focuses on good growth, defined as ‘growth that is socially and
economically inclusive and environmentally sustainable’. The plan emphasises the role
of good growth in improving the health and quality of life of all Londoners and reducing
inequalities. As such, transport plays a key role in ensuring that communities are well
connected to goods, services and opportunities to fulfil their full potential. Six ‘Good
Growth’ objectives are identified, which are outlined below:
• GG1 Building strong and inclusive communities;
• GG2 Making the best use of land;
• GG3 Creating a healthy city;
• GG4 Delivering the homes Londoners need;
• GG5 Growing a good economy; and
• GG6 Increasing efficiency and resilience.
3.32 The need for ‘good growth’ is reflected in Policy 4 ‘Ensuring Good Growth’ of the Draft
Local Plan for Waltham Forest and also enforces the key thread of supporting
sustainable infrastructure. The Intend to Publish London Plans set the target for
developing 1,800 homes each year in Waltham Forest, which is reflected in the Draft
Local Plan growth proposals. The new London Plan designates Walthamstow and Wood
Street as Strategic Areas for Regeneration. Chapter four of the Intend to Publish Plan
sets out more detailed transport policies for the city. These largely relate to
encouraging modal shift, ensuring transport infrastructure taking a strategic approach
16 http://lruc.content.tfl.gov.uk/london-electric-vehicle-infrastructure-taskforce-delivery-plan.pdf
17 https://www.london.gov.uk/sites/default/files/intend_to_publish_-_clean.pdfand gives due consideration to the Mayor’s Transport Strategy and Healthy Streets
approach.
Mayor’s Transport Strategy (2018)
3.33 The Mayor’s Transport Strategy 201818 recognises the ‘cornerstone’ role transport plays
in delivering London’s broader objectives. To do so, the main target it sets is for: ‘80 per
cent of all trips in London to be made on foot, by cycle or using public transport by
2041’. Another key focus is on improving health through active travel, improving road
safety, reducing traffic congestion and overall emissions whilst shifting towards zero-
emission vehicles. Alongside improvements to public transport including projects
focussing on accessibility improvements such as providing step-free access.
3.34 The Mayor’s Transport Strategy enforces the Draft London Plan approach to new
developments, focussing on good growth whilst setting transport-specific principles.
Given the expected high rate of growth in Waltham Forest it is key that any new
developments in the borough comply with the following, as set out in the Strategy: 19
• Good access to public transport;
• High-density, mixed-use developments;
• People choose to walk and cycle;
• Car-free and car-lite places;
• Inclusive, accessible design;
• Carbon-free travel; and
• Efficient freight.
3.35 The Mayor’s Transport Strategy also outlines a spatial approach for transforming the
transport system. In terms of Outer London, the Strategy highlights the ‘huge untapped
potential’ of cycling to replace shorter car trips. As such, the Strategy encourages
improvements to the walking and cycling environment, implementation of measures to
reduce car dependency and improvements to public transport services.
3.36 The Strategy acknowledges the significance of rail for longer distance journeys and need
to improve bus services to replace existing car journeys. Additionally, it encourages the
implementation of demand-responsive bus services where traditional routes are not
appropriate.
3.37 Four supporting action plans were also developed to detail how the MTS proposals will
be achieved. The action plans include:
– Walking action plan, which aims to make London the most walkable city in
the world, by enabling people to walk part or all of their journey by improving
walking experiences.
18 https://www.london.gov.uk/sites/default/files/mayors-transport-strategy-2018.pdf– Vision Zero action plan, aims to eliminate all deaths and serious injuries on
London’s transport system, with a primary focus on London’s streets.
– Freight and servicing action plan, to support safe, clean and efficient freight
movement.
– Cycling action plan, focussing on enabling Londoners to make cycling part of
their everyday travel.
Healthy Streets for London (2017)
3.38 The Healthy Streets20 approach is defined as ‘the system of policies and strategies to
help Londoners use cars less and walk, cycle and use public transport more’. In order to
tackle levels of inactivity, congestion and noise and air pollution in the city and enable
Londoners to love healthy lives which incorporate active travel. Healthy Streets focuses
on ten indicators to make streets more pleasant, safe and attractive which are shown in
Figure 3.6.
Figure 3.6: 10 Healthy Streets indicators
20 http://content.tfl.gov.uk/healthy-streets-for-london.pdf3.39 The Healthy Streets document emphasis the need to deliver the Healthy Streets
Approach at three main levels: street level through character and use of city streets;
network level with planning and management of the transport network; and strategic
level through policy and planning for growth.
3.40 The Healthy Streets document emphasis the need to deliver the Healthy Streets
Approach at three levels to have an impact: street level through character and use of
city streets; network level with planning and management of the transport network;
and strategic level through policy and planning for growth.
The Role of Transport in Public Health in Waltham Forest
3.41 The Borough population is roughly evenly split between males and females with
approximately 50.3% of the population being male compared with 49.7% female based
on GLA (2017) estimates for 2020.
3.42 The Greater London Authority (GLA) Population Projections (2017) outline that
Waltham Forest currently (2020) has a younger average population than other London
Boroughs, with 22% of residents between ages 0-15 years old. Having a younger than
average population provides an opportunity to develop active travel habits at a young
age through interventions targeting schools, which are then more likely to be
maintained into adulthood. The GLA (2017) also outlines anticipated growth in the
Borough’s population aged 65+, growing to 13.1% of the population in 2033, compared
to 10.6% in 2020.
3.43 The existing spatial distribution of 0-15 year olds and 65+ is shown in Figure 3.7 below.
This shows that that there is a significant difference in age profile between the north
and south of the Borough, with a greater proportion of young people living in the south
of Waltham Forest and the converse true in the north.Figure 3.7: Age Distribution (Office of National Statistics, 2015)
3.44 A disparity also exists in the levels of physical activity between social groups within the
Borough. With lower levels of physical activity recorded among those in
unemployment, with disabilities, people within the six most deprived areas within the
Borough, aged over 55 and from Asian and Black ethnic groups (Public Health England).
Projects looking to increase uptake of sustainable travel will therefore consider
differences in travel patterns, needs and preference to provide inclusive interventions
which are also able to target specific socio-demographic groups.
North London Sub-Regional Transport Plan, 2016 Update (2016)
3.45 The North London Sub-Regional Transport Plan21 was first developed by TfL in 2010 to
translate the MTS goals, challenges and outcomes to a sub-regional level, enabling TfL
to work with Boroughs to address strategic issues, progress medium and longer term
priorities and also respond to changing circumstances. The 2016 update responds to the
2016 Mayors Transport Strategy. The major challenges identified are the need for
significant housing growth and access to sustainable transport which can support this
and unlock growth opportunities, in addition to increasing employment at transport
nodes. Alongside this, the increase in populations 65+, with Blackhorse Road seeing one
of the greatest increases in North London and a need for an accessible transport
network to cater for this ageing section of the community. Public transport mode share
has potential to increase, but only if this is supported by an increase in capacity, this is
required to prevent worsening traffic congestion.
21 http://content.tfl.gov.uk/north-story-of-growth-2016.pdfActive Travel Network
3.46 The Mayor’s Transport Strategy (MTS, 2018) highlights the potential for walking and
cycling to replace short car-trips in Outer London. Considering Figure 3.8, which shows
key destinations and the existing active travel network, and Figure 3.9 which shows
population density, it is clear the concentration of centres of activity correlates with
population density, particularly in the south of the Borough.
3.47 Higher population densities around centres of activity enable short trips to key services
to be made by sustainable modes.
3.48 Walkable distances to key services are identified as approximately 800 metres or 10
minutes’ walk by the Department for Transport, maximum cycling distances however
vary more significantly dependent on user and local conditions. In London,
developments that create a significant transport impact must include an Active Travel
Zones assessment, considering the quality and accessibility of active travel routes
towards key locations within walking or cycling distance of the development.Health, Physical Activity and Active Travel The Mayor’s Healthy Streets for London report (2017) outlines the importance of increasing levels of physical activity of Londoners to tackle major health challenges. This is particularly relevant to Waltham Forest as a greater proportion of adults in the Borough (26.6%) are physically inactive compared to the London average (22%). Clear links have been drawn between physical activity and health and wellbeing outcomes and subsequent treatment costs. For example, the Department of Health (2011) estimated that if every Londoner walked or cycled for 20 minutes each day, it would save the NHS £1.7 bn in treatment costs over 25 years. The Harvard Medical School (2019) found that participating in daily physical activity can reduce the risk of depression and dementia by 20-30%. The current health and well-being challenges Waltham Forest faces which could be addressed by increasing physical activity are summarised below: • Mental health: high prevalence of mental health disorders, affecting 22.5% of the population aged 16+, compared to a 16.9% average for England (data accounting to 2017). 6.8% of people over 18 have recorded prevalence of depression in the Borough (2017/2018)16; • Cardiovascular disease: most common cause of death in Waltham Forest (24% of premature deaths); • Hypertension: 11% of the patients in the NHS Waltham Forest Clinical Commissioning Group has recorded hypertension, similar to the London average (data accounting to 2018/2019)17; • Obesity: 10.5% of children in Reception and 23.4% of children in Year 6 are overweight, higher than the 10.2% and 23.2% London averages (data from 2018/2019)18. For adults, the Borough performs better than London, still, 52.9% of residents 18+ are classified as overweight/obese (2018/2019)19; and • Diabetes: high prevalence of diabetes (diagnosed and undiagnosed) accounting for 10.1% of the population, compared to an 8.5% average for England (2017)20. Sources: Public Health England - Mental Health and Wellbeing JSNA, available here. Public Health England - Cardiovascular disease, available here.
Figure 3.8: Key destinations and existing active travel network in Waltham Forest
Figure 3.9: Population density in Waltham Forest
3.49   Residential densities in the north of the Borough are generally lower than those in the
       south reflecting the suburban character north of the A406. In line with this, there are
       fewer centres of activity, which are generally located adjacent to stations. Only two
       cycle routes are provided through the north of the Borough and only one of these
       provides a continuous connection south of the A406 towards larger Town and District
       centres. The existing cycle routes in the north do not provide good links to residential
       areas and the distances to most of these exceed a reasonable walking distance, which
       contributes to higher car dependence in the north of the Borough compared to the
       south. This demonstrates the importance of ensuring a joined-up cycle network linking
       to local centres and the strategic transport network.

3.50   Residents in the north of the Borough could be better connected to the centres of
       activity and stations in the south of the Borough. However, there are significant north-
       south permeability issues around the A406, which can only be crossed at six points. This
       can create bottlenecks during busy periods. Additionally, as these connections are
       made via underpasses or pedestrian footbridges, both of which are not well overlooked,
       this leads to intimidation and discourages further walking and cycling. In addition, cycle
       hire services are available in the south of the Borough, which enables casual cycling.
However, in the north of the Borough, casual cycling is much less attractive as there are
no cycle hire services and fewer formal cycle routes.
3.51 Connections north from the Borough towards Epping Forest also require significant
consideration as concerns have been raised regarding the impacts of increasing leisure
cycling on the Special Area of Conservation (SAC).
3.52 Demographic and topographic differences also contribute to differing travel patterns in
the north and south of the Borough. The north concentrates most of the 65+ population
in Waltham Forest as well as many families with young children. There is also a steep
topography which makes walking and cycling more challenging to these groups.
3.53 In some occasions cycling can also replace longer-distance trips, relieving pressure from
overcapacity parts of the transport system. It is expected that when complete, the
existing network in conjunction with the extension of Cycleway 2 (expected to run
between Stratford and Aldgate via Bow, Mile End, Stepney Green and Whitechapel) and
the East to West Cycleway (from Paddington to Acton) will connect several key
destinations by fully segregated lanes, improving journey times and safety for cyclists.
3.54 Figure 3.10 shows destinations which will be accessible from Walthamstow Central via
routes with over 90% segregated cycle lanes.Figure 3.10: Cycle connectivity from Walthamstow Central22
3.55 Figure 3.10 shows that cycling from Walthamstow to Westfield will take between 15-20
minutes through a network of segregated cycle lanes, once the expected works are
completed. Future cycling proposals within the Borough should look to complement or
feed into this network from other parts of the Borough.
Enjoy Waltham Forest
3.56 The ‘Enjoy Waltham Forest’ programme23 combines a series of transport and public
realm improvements, as well as complementary culture change initiatives, to promote
active travel and increase liveability within the Borough. These improvements also
supported delivery of events as part of the London Borough of culture in 2019.24
3.57 As part of this, walking and cycling infrastructure has received major investment over
the past five years. As shown in Figure 3.10, the cycle network is denser in the south of
the Borough where the majority of the Enjoy Waltham Forest projects have been
concentrated. Segregated cycle routes have been delivered along some of the
Borough’s main roads towards town centres to provide safety, convenience and high-
22 Some the proposed network has since been completed e.g cycle lane across Walthamstow Wetlands is now complete
23 https://enjoywalthamforest.co.uk/
24 https://wfculture19.co.uk/mobility to cyclists. However, as outlined, cycling infrastructure north of the A406 is
much more sparse contributing to increased car dependency.
3.58 Within residential areas, the Enjoy Waltham Forest programme has focussed on
liveability - improving the overall environmental conditions to make cycling and
walking, safer and more enjoyable. This included introducing modal filters, one-way
systems, timed road closures, improved pedestrian infrastructure, SUDS and other
public realm improvements slowing down motorised traffic by reinforcing
pedestrian/cyclist priority. So far, these have been implemented in the residential areas
between Forest Road and Lea Bridge Road, where some of the Borough’s housing
growth is planned. These holistic schemes have a multitude of benefits beyond
transport including reducing flood risk, enhancing local community and improving
overall wellbeing. The potential for further expansion of the Enjoy Waltham Forest
programme to support sustainable housing growth will need to be considered.
3.59 The ‘Town Centres’ schemes shown in Figure 3.10 cover large areas with specific
schemes around the Borough’s main shopping districts, introducing measures to reduce
motorised traffic, improving key crossings and pedestrian routes, and delivering public
realm improvements. Connectivity towards these centres was also sought through
segregated cycle routes. These Town Centre schemes have been implemented around
Leyton, Leytonstone, Chingford and Highams Park.
3.60 Major investment in walking and cycling infrastructure in addition to complementary
programmes during the past few years have already shown success. For example, in one
year, the number of residents that said they cycle increased from 12% to 17% by 2016 –
that translates into approximately 13,600 more people cycling in one year. Frequency
also improved with 73% of those who cycle reporting they do it at least once a week
compared to 62% the year before.
3.61 Figure 3.11 below shows the roads within the Borough which have experiences the
greatest increase in cycling usage over the surveyed period 2017-2019. Along these
routes these is some variation in vehicular traffic and increases in cycling by over 200%
on Church Road, Forest Road, Blackhorse Road and Boundary Road all of which were
part of the Enjoy Waltham Forest programme.
3.62 More information and continuous updates on the Enjoy Waltham Forest programme
can be found at: https://www.enjoywalthamforest.co.uk/Figure 3.11: Roads showing greatest increase in cycle usage
Schools and Active Travel
3.63 Active travel to school represents a significant opportunity to encourage the
development of sustainable and healthy travel habits from an early age and across all
groups. Increasing travel to school by active modes presents an opportunity to reduce
congestion and air pollution on the Boroughs road network and around stations at peak
times.
3.64 Figure 3.12 shows the results of a survey of 57 schools in Waltham Forest which are
taking part in the 2018/2019 TFL STARS programme (Sustainable Travel: Active,
Responsible, Safe) measuring how pupils and staff travel to schools. This shows, walkingis the predominant form of travel to primary/secondary schools and academies, used by
more than half of the surveyed population. However, one in five trips to these are still
made by car/motorbike, representing an opportunity for modal-shift.
Figure 3.12: Mode share to STARS Schools 2018/2019
3.65 Active travel to schools can also be encouraged by implementing ‘School Streets’25,
which involves the temporary closure of streets around schools during drop-off and
pick-up times to motorised vehicles. This aims to make other modes of travel more
convenient as well to provide a more pleasant, safe and less polluted environment
outside school gates.
3.66 Phase 1 of a School Streets programme has been implemented in Waltham Forest
through 2 schemes covering four schools in September 2019 with plans to be extended
to April 2020 (timetables still to be revised due to Covid-19 restrictions). With a 12%
reduction in in pupils arriving to school by car in one of the trial schools. Consultation is
ongoing for further implementation within the Borough.
25 http://schoolstreets.org.uk/Buses
3.67 Bus services play an important role in communities where there isn’t access to
Underground/Overground stations, and where journey lengths mean active travel is not
feasible to reach local services or transport hubs. Currently there are 34 bus routes and
five night routes operating in Waltham Forest.
3.68 The Borough has an extensive bus network with a total of 33 routes which
predominantly serve the main town and local centres, transport hubs and connect to
locations outside the borough, such as Stratford and central London.
3.69 The majority of the southern wards of the borough are well served by buses, with
frequent services connecting to major destinations and transport interchanges in
Hackney, Central London, Stratford, Tottenham Hale, and East London.
3.70 In contrast, the bus networks in the north of the borough, and Cann Hall, in the south
are characterised by poor east-west connectivity, requirements to change buses to
reach major destinations, and less frequent services. Combined with limited rail
connections, this contributes to low PTAL in these areas of the borough, presenting a
less attractive option to private car use.
3.71 Figure 3.13 shows that the number of kilometres operated by bus in Waltham Forest
was increasing until 2018, after which there was a slight drop for the period 2018/2019.
Correlating with the reduction in km operated, there was a reduction in trips during the
same period. This suggests that greater services and km operated may attract a
subsequent increase in bus trips, which could be drawn from more constrained or
polluting modes of transport.
128 27
Overall variation in recorded bus trips and
126
km operated
124 26.5
122
26
Million trips
Million km
118
25.5
114
25
110
24.5
2013/14 2014/15 2015/16 2016/17 2017/18
2018/19
Usage Km operatedFigure 3.13: Variation in recorded bus usage and km operated
3.72 Table 3.14 shows services with the highest increase and the three with the highest
decrease in trips for the period 2013-2019. In all cases, the increase or decrease in trips
was accompanied by a similar increase or decrease in kilometres recorded by the
service. As shown, the rate of usage increase over the five-year period is greater than
the rates of decrease. Overall, there is a rising demand for most of the bus services in
the Borough.
Route Change in Change in km recorded
308 Wanstead - Lower Clapton trips
28% 24%
339 Leytonstone – Shadwell 28% 23%
W19 Walthamstow – Ilford 27% 29%
W12 Wanstead – Walthamstow -12% -7%
W15 Higham Hill – Hackney -13% -7%
48 London Bridge – Walthamstow -15% -4%
Figure 3.14: Bus services with the greatest increase/decrease in trips between 2013-2019
3.73 Alongside managing an increasing demand for bus services, managing the efficiency of
the system must be a priority to ensure that bus services are competitive compared to
private car travel. Figure 3.15 shows that average bus speeds in Waltham Forest have
decreased between 2013-2019. This is likely to be caused by a number of factors
including:
• Increased boarding times associated with increase in usage;
• Newly introduced speed limits on some roads; and
• Improved pedestrian/cycle priority.
3.74 But also, it may indicate rising levels of congestion. Given these challenges it is key to
ensure that, where possible, buses are prioritised over other forms of motorised traffic
in order to avoid an increase in journey times for users.Average Bus Speeds
9.8
9.6
9.4
9.2
9
8.8
8.6
8.4
2013-2014 2014-2015 2015-2016 2016-2017 2017-2018 2018-2019 2019-2020
Figure 3.15: Average bus speeds in Waltham Forest (2013/2014 – 2019/2020) 26
3.75 Figure 3.16 shows bus speeds across the Borough in 2016/2017 based on the LIP (2019).
Lower speeds are concentrated through the centre and south of the Borough and at
junctions. The generally low speeds indicate that bus priority measures at junctions could
have a significant impact in improving bus speeds and therefore journey times to make
bus a more appealing option for travel within and outside of the Borough.
26
TfL (2019) Buses performance data. Borough All (to P12 2019-2020) [Excel Spreadsheet]. Available from:
https://tfl.gov.uk/corporate/publications-and-reports/buses-performance-dataFigure 3.16: Monday - Friday am bus speeds (2016/2017) 27
Underground and Overground
3.76 The majority of the Underground and Overground stations in Waltham Forest are
concentrated in the south of the Borough. The busiest stations being Walthamstow
Central (generating 27,000 trips per regular weekday), Leyton (20,730), Leytonstone
(17,320), and Blackhorse Road (16,040).
27 TfL (2019) Buses performance data. Borough All (to P12 2019-2020) [Excel Spreadsheet]. Available from:
https://tfl.gov.uk/corporate/publications-and-reports/buses-performance-data3.77 All of which have had an increase in entries and exits between 2013-2016, with
Walthamstow Central and Blackhorse Road, which provide access to the Victoria Line,
experiencing an average 39% increase in entries and exits between 2013 and 2016. The
increase for Central Line stations (Leyton and Leytonstone) has been 11% over the same
period.
3.78 It is expected that demand will continue to increase due to the population growth
planned for the areas around these stations. Overcrowding at stations and along the
Victoria and Central Lines is already a significant issue during weekdays at peak hours.
On weekdays, approximately 40% of all trips departing from Waltham Forest are to
Central London during the morning peak, with the same proportion returning during
the evening peak, showing a clear commuting pattern.
3.79 The main stations to which people travel on weekdays are Liverpool Street, Oxford
Circus and Kings Cross St Pancras. At weekends, travel patterns are more distributed
and other locations such as Stratford and Seven Sisters gain more popularity. The
primary destinations from Underground/Overground stations in Waltham Forest for a
combination of weekdays and weekends are shown in Figure 3.17.Figure 3.17: Main Underground and Overground rail destinations28
3.80 There are planned improvements to the Central Line, which expect to deliver a 25%
increase in capacity. Additionally, the delivery of the Elizabeth Line will also help
mitigate some of the demand towards Central London, by providing a new link between
Stratford, Liverpool Street and other Central London stations. There is still some
uncertainty around the exact delivery dates for these improvements. The stations
within Waltham Forest will need to be able to cope with the expected capacity
increases associated with these improvements as well as the expected increase in
transport demand associated with population growth and the development of
economic activity hubs around town centres. Plans for station improvements identified
by Waltham Forest are set out in the Infrastructure Delivery Schedule in Appendix 1.
3.81 Efficiency of travel can also be improved by adding step-free access. TfL estimates that
on average, journeys take 15-minutes longer if using the step-free public network in
Waltham Forest. Currently only four of the stations in Waltham Forest have step free
access. Given the high proportion of younger people and increasing proportion of over
65s living in the Borough, making stations accessible should be a priority for the
Borough.
Highways
3.82 Waltham Forest contains a number of strategic roads which provide vehicular access
across the Borough. The two key strategic routes are the A406 (North Circular), which
runs through Waltham Forest in an east-west direction and acts as an inner ring road,
and the A12, which bisects the south east corner of the Borough providing a link to
Stratford and Canary Wharf in the south and towards outer London heading east.
3.83 Both roads are designated red routes in the Transport for London Road Network (TLRN)
and as such carry the greatest volumes of traffic, as shown in Figure 3.18. Both routes
create severance due to a lack of permeability (grade separated roads). Of particular
concern is the North Circular which contributes to a north-south divide in the Borough.
3.84 Another key route through the Borough is the A104 (Lea Bridge Road), providing north-
south connectivity from Whipps Cross south towards Central London, or north through
Epping Forest towards the M25 and M11.
28 (Made using TfL Crowding Data) using TfL (2018) Crowding Data. 2018FRI_Link_Load [Excel spreadsheet] Available at:
http://crowding.data.tfl.gov.uk/Average counts per hour (motorised vehicles)
only)
A406 (North
3977
Circular)
2852
A12
A104 (Lea Bridge
1043
Road)
714
A114 (Whipp Cross
Road) 688
A1037 (Waltham
Road)
624
A11 (High Road
476
A110 462
A112 451
A1006 403
A1069 348
B160 327
A106 316
Figure 3.18: Average traffic flows per hour 2015-201829
3.85 Commuting patterns by mode vary significantly between the north and south of the
Borough, with up to 40% of commuting journeys from locations in the north of the
Borough being made by car and the same figure being less than 10% in parts of the
south (Census, 2011).
3.86 Figure 3.18 shows that commuting from the north to the south of the Borough
represent a large proportion of driven trips into Walthamstow for work, which have
potential to be converted to more sustainable modes of transport.
Electric Vehicle Charing Infrastructure
3.87 Electric vehicles (EVs) have the potential to offer great benefits to London’s residents,
businesses and visitors in terms of health, the environment and reduced running costs
over the lifetime of the vehicle. Electric vehicles are part of the tool kit for
decarbonising transport emissions and are an important component of improving local
air quality and reducing premature deaths and health risks associated with exposure to
toxic air.
29 (DfT Raw Counts 2015-2018) based on Department for Transport (2018) Raw Count Data – Major and Minor Roads.
Available from: https://roadtraffic.dft.gov.uk/downloadsWaltham Forest Electric Vehicle (EV) Charging Strategy, 2018-2022
3.88 London Borough of Waltham Forest recognise their role in supporting the uptake of
electric vehicles and the EV Strategy30 provides guidance on identifying and delivering
the appropriate charging infrastructure, located in the right places, to support electric
vehicle uptake by the growing population and meet future demand for charging
facilities across the borough.
3.89 Six key objectives of the EV Charging Strategy are to:
1) Deliver an electric vehicle charging network that meets the demands of
residents, businesses and visitors;
2) Designing sites that take into consideration other road users, particularly
pedestrians;
3) Ensure full coverage of the borough by 2022;
4) Ensure the charging network has capacity for further expansion;
5) Encourage the uptake of electric vehicles through initiatives and public
engagement;
6) Identify income opportunities that will lead to the provision and maintenance of
charging points becoming cost neutral to the borough
3.90 The borough has to date installed 101 Electric Vehicle Charging points on the adopted
highway – this does not include sites on private land, such as at retail parks or
supermarkets.
30
https://www.walthamforest.gov.uk/sites/default/files/LBWF%20%20Electric%20Vehicle%20Charging%20Point%20Strategy%
20.pdfFigure 3.19: Council installed EV Charging infrastructure, as of summer 2020
Collisions, Deaths and Serious Injuries
3.91   The road collisions reported within Waltham Forest between 2017-2018 are included in
       Figure 3.20. The collisions are generally concentrated along the key routes through the
       Borough which were identified as having heavy traffic flows and at junctions where
       these routes converge. Specifically, there is a concentration of collisions along the A104
       (Lea Bridge Road), which has recently undergone significant works to install a
       segregated cycleway. Further monitoring will be required to establish whether these
       works have had an impact on the rate of collisions.

3.92   Further locations with a significant concentration of collisions are along the A112, which
       provides an important north-south link for both motorists and cyclists.

3.93   Specifically, improvements should be investigated at the junctions with the North
       Circular, Forest Road and Lea Bridge Road.

3.94   The high rate of collisions along key routes for vehicles and cyclists is a key challenge in
       encouraging mode shift. Measures to address this have already been taken through the
       designation of 20mph speed limits across some streets in the Borough and the delivery
       of infrastructure that prioritises cyclists and pedestrians. Further hard and soft
       measures will be key to increase cycling uptake especially within groups such as
       children, the elderly and less experienced cyclists, who cite safety concerns related to
       cycling and to make walking safer and more enjoyable, improving the experience
       people have when accessing public transport.
Figure 3.20: All registered road accidents between 2017-201831
Freight and Servicing
Servicing
3.95 Light Goods Vehicles (LGVs) and Heavy Goods Vehicles (HGVs) are key to moving goods
around the city, and they also account for a significant amount of road traffic. The LIP
(2019) identifies that between 2013 and 2016 there was an increase of 23% in LGVs and
HGVs on the Borough’s road network based on DfT counts at 47 locations. Overall these
vehicles make up 20% of traffic on these roads. This can be associated with a rise in
online shopping and construction works, which are likely to put additional strain on an
the already congested road network as well as having an impact on air and noise
pollution.
3.96 Currently the primary industrial sites, which are likely to be associated with high LGV
and HGV movements, are concentrated south of the A406 at the Argall Industrial
Estate, the Forest Trading Estate and north of the A406 adjacent to the Borough’s
western boundary. Commercial activity in these areas are likely to be further intensified
as they are identified as Strategic Industrial Locations (SILs) in the Draft Local Plan.
3.97 The area south of the A406 is due to become part of the expanded ULEZ area in 2021 in
order to improve air quality. Industries and businesses operating in this area will need
to be supported in preparations for the ULEZ regulations ahead of implementation to
maximise the benefits without effecting operation. Similarly, attention must be given to
the housing and employment growth areas concentrated south of the A406, as these
will also be part of the expanded ULEZ and will likely generate a significant number of
construction related vehicle trips including delivery of supplies, servicing and
construction staff.
3.98 Waltham Forest has already started tackling the increasing demand for deliveries in a
sustainable way, by implementing a Zero Emission Delivery (ZED) programme. In March
2016, Waltham Forest secured £400,000 from the Mayor’s Air Quality Fund for the
launch and operation of the ZED scheme, which is a last mile cargo bike delivery service
between local businesses and their customers. To date 53 businesses have participated
in the scheme, achieving a total of 52,241 deliveries and saving over 5,000kg CO2e
emissions as shown in Figure 3.21.
31 Source: Waltham Forest (2018) Road Safety – Accidents (Excel spreadsheet)ZED Monthly Report Data
4000 16000
3500 14000
3000 12000
2500 10000
2000 8000
1500 6000
1000 4000
500 2000
0 0
Miles travelled Number of deliveries
Equivalent CO2 emissions saved (kg) Income received (£)
Figure 3.21: ZED monthly report data
Growth and Wider Drivers of Change to 2035
Crossrail1 - The Elizabeth Line (2021)32
3.99 As mentioned in Section 2.72, the planned improvements to the Central Line and the
expected delivery of the Crossrail Elizabeth Line will help mitigate some of the demand
towards Central London. The latest update on the project indicates that the central
section of the Line is expected to come into operation between Paddington and Abbey
Wood by summer 2021. This would help relieve pressure from the tube network by
providing an alternative route linking Stratford, Liverpool Street and other Central
London stations.
3.100 To maximise these benefits, it will be key to ensure that there are good connections
towards the stations that are on the Elizabeth Line outside of the Borough. Connections
towards these stations including by active travel, by bus, and by means of
Underground/Overground services. Attention should be given to ensuring smooth and
accessible interchanges, the provision of good public realm and retail services along key
routes for pass-by trips. This could not only make trips more attractive but also reduce
the need to do further trips by placing activity centres along commuting routes.
32 https://tfl.gov.uk/travel-information/improvements-and-projects/elizabeth-lineUltra-Low Emission Zone (ULEZ) expansion (2021)
3.101 The Mayor of London launched the ULEZ33 in central London in 2019 to reduce air
pollution in order to improve the health of Londoners. The ULEZ imposes emissions
standards on all vehicles entering the zone and requires payment to enter for those
that don’t. The ULEZ is expected to be extended by October 2021, to include the area
south of the North Circular34.
3.102 There are likely to be numerous positive impacts from the ULEZ in Waltham Forest
including improved air quality, potential reduction in congestion and road traffic
collisions. However, to maximise the benefit and minimise possible disruption.
Concerns relate to commuters aiming to park outside the ULEZ in the north of the
Borough and then taking public transport to their final destinations, if this does occur
there could be significant pressure on parking in the north and a further strain on the
public transport system. This would exacerbate the existing differences in travel
patterns between the north and the south of the Borough.
Meridian Water (2019)
3.103 Meridian Water35 is a regeneration project taking place in Enfield, expected to provide a
significant number of houses, employment opportunities, retail and cultural spaces,
community facilities, health facilities, schools, and public spaces. As such, it is expected
to become an important destination in close proximity to Waltham Forest.
3.104 A new Meridian Water Railway Station has been delivered already, which provides an
opportunity to relieve congestion in some Waltham Forest stations, as it provides
services to Stratford every half an hour (calling at Northumberland Park, Tottenham
Hale and Lea Bridge), a once a day service in each direction to Liverpool Street Station
and trains to Hertford East and Bishop’s Stortford during peak hours. The Station also
provides step-free access.
3.105 From the latter, users can connect to other destinations such as Cambridge and
Stanstead Airport. Upgrades to the station are on their way including a new track to
enable two more trains per hour to run between Stratford and Meridian Water from
September 2020.
3.106 Improving connectivity to Enfield will be key to catalyse the benefits from these
developments. Currently, there are constraints in terms of active travel connections
which are partly due to natural physical barriers (eg the River Lea, Metropolitan Open
33 https://tfl.gov.uk/modes/driving/ultra-low-emission-zone
34 https://tfl.gov.uk/modes/driving/ultra-low-emission-zone/ulez-where-and-when
35 https://www.meridianwater.co.uk/Land in the Lee Valley, Walthamstow Wetlands and reservoirs, alongside a lack of
wayfinding and safe and convenient cycle routes.
Crossrail 2
3.107 Crossrail 236 is still in the early planning stages, however, if delivered, the project is
expected to improve connectivity between out-of-London areas, Meridian Water and
Central London locations. The specifics of the route are still under discussion, but it in
general terms, it will connect Surrey with Hertfordshire, delivering a number of step-
free access stations along the route - see section 2.72.
Addressing Connectivity Gaps and Growth to 2035
3.108 The Waltham Forest Strategic Transport Review, ARUP, 2020, identifies a number of
connectivity gaps in the borough.
36 https://crossrail2.co.uk/You can also read