Physicochemical, functional properties and antioxidant activity of protein extract from spent coffee grounds using ultrasonic-assisted extraction
←
→
Page content transcription
If your browser does not render page correctly, please read the page content below

AIMS Agriculture and Food, 6(3): 864–878.
                                                            DOI: 10.3934/agrfood.2021052
                                                            Received: 18 May 2021
                                                            Accepted: 13 August 2021
                                                            Published: 23 August 2021
http://www.aimspress.com/journal/agriculture

Research article

Physicochemical, functional properties and antioxidant activity of
protein extract from spent coffee grounds using ultrasonic-assisted
extraction

Namfon Samsalee1 and Rungsinee Sothornvit2,*

1
    Department of Applied Biology, Faculty of Sciences and Liberal Arts, Rajamangala University of
    Technology Isan, Nakhon Ratchasima, 30000 Thailand
2
    Department of Food Engineering, Faculty of Engineering at Kamphaengsaen, Kasetsart University,
    Kamphaengsaen Campus, Nakhon Pathom, 73140 Thailand

* Correspondence: Email: fengrns@ku.ac.th; Tel: +6634281098; Fax: +6634351404.

Abstract: Spent coffee grounds, the residue from coffee brewing, are still underutilized even though
they contain several useful organic compounds including proteins. To valorize the spent coffee
grounds, the spent coffee ground protein was investigated using ultrasonic-assisted extraction as
a pretreatment to conventional extraction. The pretreatments involved different ultrasound
amplitudes (40%, 60% and 80%) and extraction times (10, 20 and 30 min) and their effects on the
physicochemical and functional properties including antioxidant activity of protein extract. It was
found that the protein content extracted was increased approximately 2 times, compared to the initial
spent coffee grounds. Furthermore, the ultrasonic-assisted extraction affected the physicochemical
properties, functional properties and antioxidant activity of the protein extract. The 80% amplitude
for 10 min extraction time improved the foaming capacity, foaming stability, emulsifying activity
index and the emulsifying stability index of protein extract. The pretreatment at 20 min extraction
time provided the highest antioxidant activity (933.92–976.03 mM Trolox eq/g protein extract) and
the highest total phenolic content (267.66–304.81 mg GAE/g protein extract). Nonetheless, protein
extract using ultrasonic-assisted extraction resulted in higher total phenolic content and antioxidant
activity without changes in the protein structure as confirmed by changes in FT-IR spectra and
SDS-PAGE profiles. Thus, the spent coffee ground protein can be an interesting and alternative plant
protein with functional properties for food application. Moreover, this work showed the feasibility to
reduce waste and the food waste valorization.
865

Keywords: spent coffee grounds; protein extract; ultrasonic-assisted extraction; antioxidant activity;
functional properties

1.   Introduction

     Coffee is a popular beverage worldwide. Spent coffee grounds (SCG) are the residual material
obtained from coffee brewing. SCG have been studied as a source of polysaccharides [1] and
bioactive compounds [2]. However, SCG are still underutilized even though they contain several
useful compounds for the food industry. One of these interesting compounds is protein. It has been
reported that SCG have 13–17% protein content [2,3]. Thus, there is a need to transform coffee
by-products into a value-added compound for reuse in the food system. Generally, alkali treatment is
the conventional method used to extract protein from rice bran [4], coconut by-products [5], walnut [6]
and legumes [7]. Tao et al. [8] reported that an extreme alkaline treatment could reduce cell wall
rigidity and improve the functional properties of okara protein.
     At present, ultrasonic techniques, especially high intensity ultrasound, are widely used in the
food industry for extraction, emulsification, crystallization, depolymerization, fermentation and
microbial deactivation [6]. The sound waves produce high shear forces to disrupt the cell walls and
allow solvent penetration into the material cells resulting in the release of compounds [9].
Application of ultrasonic-assisted extraction (UAE) is simple and effective technique compared to
conventional extractions (CE). Moreover, several studies showed that UAE enhanced protein
extraction combined with conventional solvent extraction [10]. For example, a high extraction yield
of protein was obtained from defatted soy flakes at 46% ultrasound amplitude, compared to the
control sample without ultrasound [11]. Preece et al. [12] reported that the protein extraction yield
from okara using pilot-scale UAE increased by 4.2%. Furthermore, UAE improved the water and oil
absorption and protein yield of rice bran protein concentrate compared with CE [4] and ultrasonic
treatment increased the water solubility and improved the emulsifying properties of walnut proteins [6].
In addition, UAE was used as a pretreatment to enhance the aggregates of okara protein which
improved the foaming stability index and emulsion stability [8]. Wen et al. [13] found that protein
extraction yield from coffee silverskin using alkaline extraction by UAE was increased by 2.8 times,
compared to CE. Nonetheless, Connolly et al. [14] reported that the alkaline extracted brewers’ spent
grain had a protein content ranging from 38.96 to 46.16%. Most works have been done on the
extraction of polysaccharides, caffeine and polyphenols from SCG. However, there is scarce on the
study of the extraction and characterization of protein from SCG. Due to the remarkable amount of
SCG disposal, UAE might be a technique to extract a relatively valuable protein from SCG with the
improvement of functional properties and antioxidant activity to further use for pharmaceutical and
food application. Therefore, the objective of this study was to determine the effect of UAE as a
pretreatment to CE on the properties of SCG protein (SCGP).

2.   Materials and methods

2.1. Materials

     Spent coffee grounds (SCG) as a coffee by-product were collected from a coffee shop in

AIMS Agriculture and Food                                                       Volume 6, Issue 3, 864–878.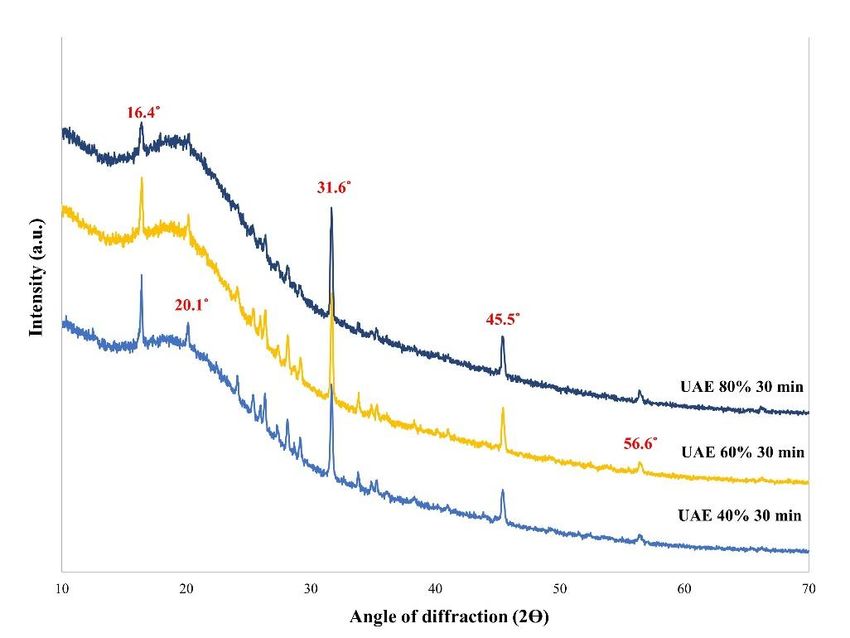
866

Nakhon Pathom province, Thailand, being derived from a mixture of the Robusta (90%) and Arabica
(10%) coffee varieties. Folin-Ciocalteu reagent was purchased from Merck KGaA (Darmstadt,
Germany). Gallic acid monohydrate, 2,2-diphenyl-1-picrylhydrazyl (DPPH), Trolox
((±)-6-hydroxy-2, 5, 7, 8-tetramethylchromane-2-carboxylic acid) and bovine serum albumin (BSA)
were purchased from Sigma-Aldrich (St. Louis, MO, USA). Sodium carbonate (Na2CO3) was
purchased from Ajax Fine-chem Pty Ltd (Taren Point, New South Wales, Australia). All chemicals
and reagents used in this study were analytical grade.

2.2. Methods

2.2.1.   Preparation of spent coffee grounds

     The SCG were collected and dried at 60 ℃ for 24 h in a hot-air dryer (RedLINE RF 115,
Tuttlingen, Germany) until the moisture content was less than 5% (wet basis). The SCG were
defatted using petroleum ether as solvent using a solid:liquid ratio of 50:500 g/mL per bottle (1000 mL)
in a shaking water bath (Memmert WNB 7–45, Schwabach, Germany) at 28 ℃ for 24 h. Then, the
defatted SCG were dried overnight under a hood at room temperature (28 ± 2 ℃) until constant
weight was reached. The samples were kept in a polyethylene zip-lock bag and stored at room
temperature for further analyses.

2.2.2.   Protein extraction of spent coffee grounds

2.2.2.1. Conventional extraction

     Protein extraction of SCG was done according to the modified method of Rodsamran and
Sothornvit [5]. The SCG (60 g) were mixed with distilled water (720 mL) as solvent and the mixture
was adjusted to pH 11 using 0.7 M tri-sodium orthophosphate (Na 3PO4). The mixture was
continually stirred at 50 ℃ for 1 h in a water bath. After that, the mixture was centrifuged at
10,000 × g and 0 ℃ for 10 min using a refrigerated centrifuge (Eppendorf centrifuge 5804R,
Hamburg, Germany) to obtain the supernatant. To increase the protein content, the supernatant was
precipitated by adjusting to pH 4 using 3M HCl. Precipitated proteins were washed with distilled
water, centrifuged and then stored at −50 ℃ for 48 h in a freezer (Elcold DK-9500, Hobro, Denmark)
and lyophilized using a freeze dryer (Scanvac Coolsafe 100-4 Pro, Lynge, Denmark) for 24 h. The
dried SCGP samples were kept in polyethylene zip-lock bags at room temperature (28 ℃) prior to
further analyses.

2.2.2.2. Ultrasonic-assisted extraction as a pretreatment compared to conventional extraction

     UAE of SCG was used as a pretreatment prior to continuing with CE. Briefly, the SCG-solvent
sample (pH 11) was extracted using different ultrasound amplitudes (40, 60 and 80%) and extraction
times (10, 20 and 30 min) with the pulse duration mode (20 s on and 20 s off) of an ultrasound
processor (VCX 750, Sonics & Materials, Inc., Newtown, CT, USA) and a 25 mm diameter stainless
probe. After the pretreatment with UAE, the sample was extracted by heating in a water bath (CE) as
described in section 2.2.2.1.

AIMS Agriculture and Food                                                       Volume 6, Issue 3, 864–878.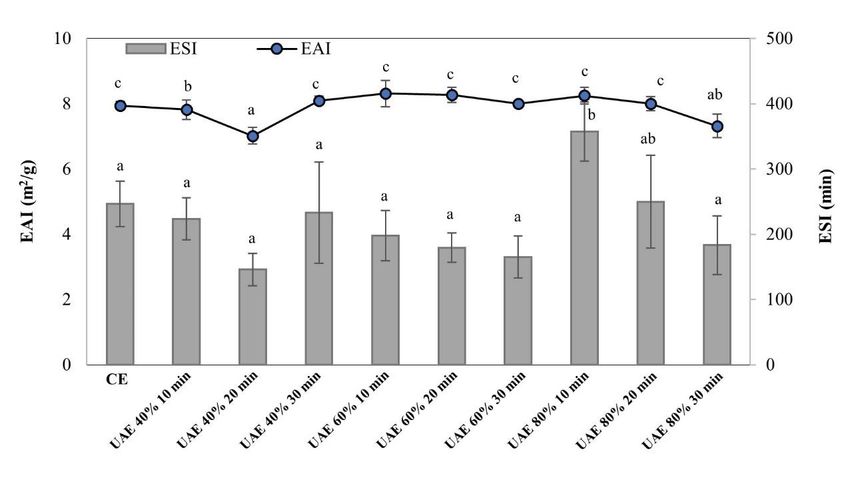
867
2.2.3. Physicochemical properties
Protein content
The total protein contents of samples were evaluated using the Kjeldahl method with a
conversion factor of 6.25 based on the Association of Official Analytical Chemists (AOAC)
methods [15]. A protein sample (1.0 g) was digested in a presence of a Kjeldahl catalyst (5 g) and 20
mL of concentrated H2SO4 in a digestion flask by boiling until the solution was clear. Then, the
solution was cooled at room temperature and then cautiously added 60 mL of distilled water and
connected for distillation. The 50 mL of 40% NaOH solution was added to the solution to form the
ammonia gas. The ammonia was trapped in a 50 mL of 4% H3BO3 solution. Then approximately
150 mL of distillate was collected and titrated with 0.2 N HCl and 67 drops of methyl red as an
indicator until the solution changes from green to pinkish. The blank was also done the same way
without sample. Protein content was calculated using Eq. (1):
(A - B) ×N ×1.4007 ×6.25
Protein content (%) = (1)
W
where: A = volume (mL) of 0.2 N HCl used for sample; B = volume (mL) of 0.2 N HCl used in
blank; N = Normality of HCl; W = weight (g) of sample.
2.2.4. Functional properties
2.2.4.1. Water and oil absorption capacity
The water absorption capacity (WAC) and oil absorption capacity (OAC) were evaluated
according to the method of Rodsamran and Sothornvit [5]. A protein sample (20 mg) and 1.5 mL of
distilled water or soybean oil were mixed in a vortex for 20 s in a 2 mL centrifuge tube and then
allowed to stand at 30 ℃ for 30 min. The tubes were centrifuged at 10,000 × g for 20 min at room
temperature. The free water or oil was removed using a pipette and the water or oil-absorbed sample
was weighed. The WAC and OAC were expressed as grams of water or oil absorbed per gram of
protein sample.
2.2.4.2. Foaming capacity and stability
The foaming capacity (FC) and foaming stability (FS) method were determined using the
method of Rodsamran and Sothornvit [5]. A protein sample (200 mg) was prepared in 20 mL
distilled water (V), adjusted to pH 11 with 0.7 M Na3PO4 solutions and stirred at 30 ℃ for 30 min.
Then, the protein solution was homogenized at 919 × g for 1 min in a high speed homogenizer
(Polytron® PT-MR 3100D, Kinematica AG, Luzern, Switzerland). The whipped protein sample was
transferred into a 50 mL graduated cylinder and the volume was recorded at 0 min (V0) and 60 min
(V1). The FC and FS were calculated using Eqs. (2) and (3), respectively.
V0 -V
FC 100
V (2)
AIMS Agriculture and Food Volume 6, Issue 3, 864–878.868
V1 -V
FS = 100
V (3)
2.2.4.3. Emulsifying properties
The emulsifying activity index (EAI) and the emulsifying stability index (ESI) were calculated
according to the modified method of Pearce and Kinsella [16]. A sample of protein solution (10 mg/mL,
WE) was adjusted to pH 11 with 0.7 M Na3PO4 solutions and stirred at 30 ℃ for 30 min. A sample
of 18 mL of protein solution was mixed with soybean oil (2 mL) and then homogenized at 13,500
rpm for 1 min. A sample of 50 μL of the emulsion was pipetted at 0 and 10 min from the bottom of
the tube and diluted with 5 mL of 0.1% sodium dodecyl sulfate (SDS) solution. After homogenization,
the absorbance of the emulsion at 0 min (A0) and 10 min (A10) was measured at 500 nm using a
spectrophotometer (Shimadzu UV–Visible 1800, Tokyo, Japan). The EAI and ESI were calculated
using Eqs. (4) and (5), respectively.
2 2.303 A 0
EAI (m 2 /g)=
0.1 WE (4)
A 0 10
EAI (min)=
A 0 A10 (5)
2.2.4.4. Sodium dodecyl sulphate-polyacrylamide gel electrophoresis (SDS-PAGE)
SDS-PAGE was run according to the method of Samsalee and Sothornvit [17] in a Mini Protein
II electrophoresis unit (Bio-Rad Laboratories Inc., Richmond, CA, USA). The dried precipitate
proteins were dissolved in distilled water (5 mg/mL), adjusted to pH 11, mixed for 1 min using a
vortex and centrifuged at 12,000 × g for 10 min. The supernatant protein solutions (20 μL) were
mixed with 20 μL of sample buffer (containing 950 μL Laemmli buffer and 50 μL
β-mercaptoethanol) and then heated at 90 ℃ for 10 min. Ten μL of each sample and marker
(Precision Plus Protein All Blue standard, Bio-Rad Laboratories Inc., Richmond, CA, USA) were
loaded onto 4–20% precast polyacrylamide gel (Mini-Protein® TGXTM Precast Gels).
Electrophoresis was performed in an electrode buffer (containing 25 mM Tris-HCl, pH 8.3, 0.19 M
glycine and 0.1% SDS) at 120 V for approximately 40 min. Protein was stained with 0.125%
Coomassie brilliant blue G 250 and destained with 30% methanol and 10% acetic acid.
2.2.4.5. Total phenolic content
The total phenolic content (TPC) was determined using the Folin-Ciocalteu assay. The protein
solution (1 mg/mL) was prepared in distilled water and stirred at 30 ℃ for 30 min. The solution was
centrifuged at 126 × g for 10 min. The 0.8 mL supernatant samples were mixed with 4 mL of 10%
Folin-Ciocalteu reagent and then 3.2 mL of 10% sodium carbonate were added to each mixture and
vortexed for 20 s. The mixtures were incubated at room temperature for 2 h. The absorbance of each
AIMS Agriculture and Food Volume 6, Issue 3, 864–878.869
sample was measured at 750 nm against a blank using a spectrophotometer. Gallic acid was used as a
standard and the TPC was expressed as milligrams of gallic acid equivalent (GAE) per gram of
sample.
2.2.4.6. Antioxidant activity based on DPPH assay
The antioxidant activity was determined according to the modified method of Geremu et al. [18].
The protein solution (1 mg/mL) was prepared in distilled water and stirred at 30 ℃ for 30 min. The
solution was centrifuged at 126 × g for 10 min. Extracts (2 mL) were mixed with 4 mL of 0.4 mM
methanolic solution of DPPH. The mixtures were stored at room temperature in the dark for 30 min
and the absorbance was measured at 517 nm against a blank using a spectrophotometer. The
percentage of radical-scavenging ability was calculated based on Eq. (6) and the results were
expressed as millimolar of Trolox equivalent per gram of sample.
A
Scavenging ability (%) = 1 sample 100
A control (6)
2.2.4.7. Fourier transform infrared (FT-IR) spectra
The FT-IR spectra of protein samples were determined using a Perkin Elmer Spectrum 100
instrument (PerkinElmer Inc., Waltham, MA, USA) for the wavenumber range 4000–650 cm−1, with
the attenuated total reflectance technique. Spectra were recorded in absorbance mode based on 16
scans per spectrum at a resolution of 4 cm−1. The interference of water and CO2 from air was
deducted during scanning.
2.2.4.8. X-Ray Diffraction Analysis
X-ray diffraction (XRD) patterns of SCGP samples were performed using a X-ray diffraction
(Aeris 600W, PANalytical, Netherlands) operating at a CuKα wavelength of 0.154 nm. The samples
were exposed to the X-ray beam with the X-ray generator running at 40 kV and 15 mA. Distribution
patterns were obtained at 2ϴ angles, 10 to 70 ℃ at room temperature (25 ℃) and step size of 0.02°.
2.3. Statistical analyses
A completely randomized design was used in this experiment. Three replications were used to
determine each property. Data were subjected to analysis of variance and Duncan’s multiple range
test was used to determine significant differences at the 95% confidence interval. Analysis was
performed using the SPSS package (SPSS 11.0 for Windows; SPSS Inc.; Chicago, IL, USA).
3. Results and discussion
3.1. Physicochemical properties
The total protein content of SCG was 15.97% (Table 1) similar to the values reported by
AIMS Agriculture and Food Volume 6, Issue 3, 864–878.870
Mussatto et al. [2] and Ballesteros et al. [3] in the same material (13.6 and 17.44%, respectively).
Variations in the protein content corresponded to the variety of the coffee beans and the brewing
conditions used [3]. There was no effect of UAE on the total protein content of SCGP, compared
with that using CE alone. The total protein content of all SCGP varied from 29.48 to 33.95% (Table 1).
According to previous studies, the extraction of protein from other related by-products were reported
such as brewers' spent grain (38.96–46.16%) [14] and defatted rice bran (76.09%) [4]. The higher
protein content compared to our results might be due to the effects of different extraction conditions
(such as extraction method, extraction temperature and extraction time) including types of raw
materials. Although the protein content of SCGP might not be as high, the large amount of SCG
disposal is significant and the waste valorization opens an opportunity and challenge for the future
researches. Nevertheless, different UAE extraction times (10, 20 and 30 min) did not result in any
significant differences in the protein contents at the same amplitude (Table 1). We hypothesized that
the protein content from SCG was extracted and completely released within the first 10 min of UAE
extraction.
Table 1. Physicochemical properties, antioxidant activity and total phenolic content of
spent coffee grounds and spent coffee ground protein using conventional extraction and
ultrasonic-assisted extraction.
Extraction Ultrasonic Protein content (%) Total phenolic content DPPH
condition extraction time (mg GAE/g SCGP) (mM Trolox eq/g SCGP)
(min)
SCG - 15.97 ± 1.10a - -
CE - 32.11 ± 0.52cd 159.83 ± 13.80 a
576.17 ± 0.48a
UAE 40% 10 32.42 ± 2.08cd 157.26 ± 4.63a 591.63 ± 75.03ab
UAE 40% 20 33.95 ± 1.62d 304.81 ± 3.94bc 933.92 ± 49.90e
UAE 40% 30 31.55 ± 1.36bcd 297.73 ± 31.23bc 784.85 ± 16.90cd
UAE 60% 10 31.20 ± 1.05bc 317.73 ± 50.38bc 937.11 ± 27.13e
UAE 60% 20 32.23 ± 2.39cd 288.65 ± 6.94b 976.07 ± 22.53e
UAE 60% 30 32.52 ± 1.24cd 344.82 ± 1.39c 859.28 ± 82.38de
UAE 80% 10 29.90 ± 2.07bc 164.76 ± 1.19a 694.59 ± 60.05bc
UAE 80% 20 29.48 ± 1.85b 267.66 ± 35.33b 961.17 ± 24.37e
UAE 80% 30 31.78 ± 1.89bcd 139.29 ± 9.31a 712.41 ± 27.61c
Data are mean±standard deviation.
Different superscripts (a, b, c, d, e) in each column indicate significant (p< 0.05) differences due to protein extraction
method.
3.2. Functional properties
3.2.1. Water and oil absorption capacity
The WAC of SCGP using CE alone was 2.98 g/g protein sample (Figure 1). The extraction time
of UAE did not affect the WAC but different amplitude levels resulted in a significant difference in
the WAC of SCGP. The SCGP using UAE at 40% amplitude for 10 and 30 min had the highest
WAC value compared to the other SCGP samples. This might have been due to the effect of
AIMS Agriculture and Food Volume 6, Issue 3, 864–878.871
cavitation in UAE breaking the covalent bonds of biopolymeric chains and increasing the mobility of
molecules to absorb water compared to that using CE alone [19]. Similarly, Chittapalo and
Noomhorm [4] reported that rice bran protein concentrates using UAE had higher WAC values
compared to the CE method.
Figure 1. Water absorption capacity (WAC) and oil absorption capacity (OAC) of spent
coffee ground protein using conventional extraction and ultrasonic- assisted extraction at
different amplitudes and times of extraction. Different letters (a, b, c) indicate significant
(p < 0.05) differences in each property. Error bars show standard deviation.
The UAE at 40% and 60% amplitudes had higher OAC values of SCGP than from using 80%
amplitude (Figure 1). Changing the extraction time of UAE had no significant effect on the OAC
values. Again, the cavitation effect of UAE was possibly a reason for the increase in the OAC of
SCGP. The OAC of SCGP using CE alone was 2.92 g/g protein sample, being similar to the results
for all SCGP samples using UAE at 80% amplitude. The higher values of WAC and OAC of the
protein made it a suitable ingredient for food products such as breads, cakes and muffins where both
hydration and shortening are desirable parameters [7].
3.2.2. Foaming capacity and stability
The foaming capacity and stability of SCGP using CE alone were 72.50% and 51.25%,
respectively (Figure 2). Using UAE did not help to improve the foaming capacity and stability of
SCGP compared to using CE alone. In contrast, the foaming properties significantly increased in the
SCGP using UAE at 80% amplitude for 10 min. This might have been due to the higher amplitude of
UAE given the uniform dispersion of the protein and fat particles that finally improved the foaming
property [20]. Similarly, a significantly large increase was reported in the foam capacity of
AIMS Agriculture and Food Volume 6, Issue 3, 864–878.872
ultrasound-treated wheat gluten with increasing ultrasound power levels (60%, 80% and 100%
amplitudes for 10 min), which might have resulted from denaturation of the wheat protein due to the
exposure of more hydrophobic regions [21]. The hydrophobic regions are taken into account in
adsorption on the air-water interface molecules [20,21]. Therefore, UAE might be considered to
improve the protein properties.
Figure 2. Foaming capacity and foaming stability of spent coffee ground protein using
conventional extraction alone and ultrasonic-assisted extraction at different amplitudes
and times of extraction. Different letters (a, b, c, d) indicate significant (p < 0.05)
differences in each property. Error bars show standard deviation.
3.2.3. Emulsifying properties
The EAI evaluates the area of interface stabilized per unit weight of protein, whereas ESI
evaluates the ability of the emulsion to resist changes to its structure over a certain period of time [22].
UAE at the different amplitude levels and extraction times did not improve the ESI compared to the
CE treatment except at 80% amplitude for 10 min of UAE treatment (Figure 3). The emulsion
activity of protein is altered by the interfacial interaction of water-oil interfaces which are controlled
by several factors such as the ability of protein molecules to absorb at the water-oil interface, the
strength of the membrane around the oil droplets and the ability of protein molecules to organize the
hydrophobic and hydrophilic groups at the water-oil interface [23].
AIMS Agriculture and Food Volume 6, Issue 3, 864–878.873
Figure 3. Emulsifying activity index (EAI) and emulsion stability index (ESI) of spent
coffee ground protein using conventional extraction alone and ultrasonic-assisted
extraction at different amplitudes and times of extraction. Different letters (a, b, c)
indicate significant (p < 0.05) differences in each property. Error bars show standard
deviation.
Figure 4. SDS-PAGE profiles of spent coffee ground protein using conventional
extraction (CE) alone and ultrasonic-assisted extraction at different amplitudes and times
of extraction.
AIMS Agriculture and Food Volume 6, Issue 3, 864–878.874
3.2.4. Sodium dodecyl sulphate-polyacrylamide gel electrophoresis (SDS-PAGE)
The ultrasound amplitude and time of extraction did not affect the protein pattern of SCGP
(Figure 4). All SCGP samples following the CE and UAE had the highest protein band intensity (at
around 15–20 kDa) compared to SCG. There was a clear, lower protein band intensity in the initial
SCG, while the protein band intensity increased in SCGP after the extraction process of SCG using
CE or UAE corresponding to the total protein content of samples. Bau et al. [24] reported that seeds
of Coffea arabica contain the main reserved protein, consisting of two main bands at approximately
35 and 20 kDa. Moreover, SCGP using UAE did not modify the protein patterns in SDS-PAGE
corresponding to the results in wheat gluten [21] and walnut protein isolate [6]. This indicated that
the ultrasonic treatment did not alter the primary structure of the proteins [25]. Furthermore, this
result confirmed that the molecular weight of the SCGP was not changed when using ultrasound
treatment.
3.2.5. Total phenolic content
The UAE at 60% amplitude for 30 min produced a significantly higher (by 2 times) TPC
compared with CE alone (Table 1). Nevertheless, it did not differ with SCGP extraction at either 60%
amplitude for 10 min or at 40% amplitude for 20 and 30 min. The ultrasonic waves accelerate heat
and mass transfer during extraction processes; thus, they eventually disrupt the plant cell walls via
cavitation effects and release the bioactive compounds [26]. However, the TPC decreased with 80%
amplitude and a longer extraction time over 20 min. This was probably due to the longer extraction
time resulting in the degradation of bioactive compounds [27]. It is implied that not only the
conditions of UAE but also the different structures of samples are important factors affecting the
TPC of extract obtained. Nonetheless, the TPC values of SCGP in this study (139.29–344.82 mg
GAE/g protein extract) were in a range of TPC reported in the enzymatically hydrolyzed SCG
(291.86 mg GAE/g sample) [28]. The difference might be due to the different raw materials. We
hypothesize that the higher TPC values of SCGP were come from the other compositions left in the
protein extract such as polysaccharide which also provided TPC as well.
3.2.6. Antioxidant activity based on DPPH assay
The antioxidant activity of SCGP tended to increase following UAE (Table 1). The extraction
time caused no significant difference in antioxidant activity at 60% amplitude. The highest
antioxidant activity was obtained at 40% amplitude for 20 min, 60% amplitude for 10, 20, 30 min
and 80% amplitude for 20 min (p > 0.05). This might have been due to UAE helping to accelerate
solvent penetration and to release more active compounds than from using CE alone, resulting in
higher antioxidant activity. As seen, the antioxidant activity of SCGP increased with extraction using
UAE compared to using CE alone. This suggested the possibility of reusing SCG as an antioxidant
compound. Antioxidant compounds have numerous applications in food, cosmetic, and
pharmaceutical areas because they can protect against chronic and degenerative diseases and
decrease the risk factors of cardiovascular diseases [3].
AIMS Agriculture and Food Volume 6, Issue 3, 864–878.875
3.2.7. Fourier transform infrared spectra
The FT-IR spectra of all SCGP using the CE and UAE resulted in similar peaks (Figure 5). This
is implied that there were no changes in the structure of the protein extract using UAE compared to
using CE alone. The different amplitude levels and extraction times did not produce any differences
in protein structure. Amide-I was found in the range between 1600 and 1700 cm−1, which
corresponded to four conformation types of secondary structure of proteins: α-helix (1650–1660
cm−1), β-sheet (1610–1640 cm−1, 1670–1690 cm−1), β-turn (1660–1670 cm−1) and random coil
(1640–1650 cm−1) [8]. These regions were associated with chlorogenic acid and caffeine found in
SCG [3]. The major bands of the SCGP were prominent at approximately 3279, 2925, 1645, 1515
and 1232 cm−1, which were assigned to amide A (NH- stretching coupled with hydrogen bonding),
amide B (CH stretching and –NH3+), amide I (C=O stretching/ hydrogen bonding coupled with COO)
and amide II (bending vibration of the N-H groups and stretching vibration of the C-N groups),
amide-III (vibration in plan of C-N and N-H groups of bound amide), respectively [17] .
Figure 5. FT-IR spectra of spent coffee ground protein using conventional extraction
alone and ultrasonic-assisted extraction at different amplitudes and times of extraction.
3.2.8. X-Ray Diffraction
Figure 6 shows the X-ray diffractograms of SCGP using UAE at 40%, 60% and 80% amplitude
AIMS Agriculture and Food Volume 6, Issue 3, 864–878.876
for 30 min. Diffractograms of other samples have not been presented due to the similar effects of
different times on the structural properties of the samples. All SCGP samples had similar crystalline
sharp peaks at 16.4°, 20.1°, 31.6°, 45.5° and 56.6° (2ϴ). The presence of a peak (2ϴ) at
approximately 20° in all SCGP samples indicated the presence of β-sheet structure of the proteins [29],
which were in agreements with the results on FT-IR. As shown, the peak intensity at 16.4°decreased
with increasing ultrasound amplitude levels. This result could be related to the crystalline structure of
SCGP was partially destroyed by ultrasonic treatment at high amplitude levels. Likewise, the
crystallinity values of soluble dietary fiber from coffee peel by ultrasound-assisted enzymatic
extraction were slightly lower than those of soluble dietary fiber from coffee peel by enzymatic
extraction alone [30]. Moreover, the peak intensity at 31.6°of SCGP was related to diffraction of
sample as a semi-crystalline polymer [30].
Figure 6. XRD diffractograms of spent coffee ground protein using ultrasonic-assisted
extraction at: (A) 40 %, (B) 60% and (C) 80% amplitude for 30 min.
4. Conclusions
The UAE at different amplitude levels had little effect on the WAC and OAC values of SCGP.
However, UAE at 80% amplitude for 10 min improved the foaming capacity, foaming stability, EAI
and ESI of SCGP. Nevertheless, UAE produced high TPC and antioxidant activity of SCGP.
Furthermore, UAE did not impact the structure of protein. Thus, the protein extract from SCG can be
used as an alternative as food supplement or as functional food in a food system. This work
shows the alternative way of waste valorization of SCG due to the large amount of SCG disposal
at present.
AIMS Agriculture and Food Volume 6, Issue 3, 864–878.877
Acknowledgments
The authors acknowledge the Kasetsart University Research and Development Institute
(KURDI), Bangkok, Thailand for financial support throughout this research.
Conflict of interest
We have no conflicts of interest to declare.
References
1. Passos CP, Rudnitskaya A, Neves JM, et al. (2019) Structural features of spent coffee grounds
water-soluble polysaccharides: towards tailor-made microwave assisted extractions. Carbohydr
Polym 214: 53–61.
2. Mussatto SI, Ballesteros LF, Martins S, et al. (2011) Extraction of antioxidant phenolic
compounds from spent coffee grounds. Sep Purif Technol 83: 173–179.
3. Ballesteros LF, Teixeira JA, Mussatto SI (2014) Chemical, functional, and structural properties
of spent coffee grounds and coffee silverskin. Food Bioproc Tech 7: 3493–3503.
4. Chittapalo T, Noomhorm A (2009) Ultrasonic assisted alkali extraction of protein from defatted
rice bran and properties of the protein concentrates. Int J Food Sci Technol 44: 1843–1849.
5. Rodsamran P, Sothornvit R (2018) Physicochemical and functional properties of protein
concentrate from by-product of coconut processing. Food Chem 241: 364–371.
6. Zhu Z, Zhu W, Yi J, et al. (2018) Effects of sonication on the physicochemical and functional
properties of walnut protein isolate. Food Res Int 106: 853–861.
7. Shevkani K, Singh N (2015) Relationship between protein characteristics and film-forming
properties of kidney bean, field pea and amaranth protein isolates. Int J Food Sci Tech 50:
1033–1043.
8. Tao X, Cai Y, Liu T, et al. (2019) Effects of pretreatments on the structure and functional
properties of okara protein. Food Hydrocolloid 90: 394–402.
9. Rodsamran P, Sothornvit R (2019) Extraction of phenolic compounds from lime peel waste
using ultrasonic-assisted and microwave-assisted extractions. Food Biosci 28: 66–73.
10. Kamal H, Le CF, Salter AM, et al. (2021) Extraction of protein from food waste: An overview
of current status and opportunities. Compr Rev Food Sci Food Saf 20: 2455–2475.
11. Karki B, Lamsal BP, Jung S, et al. (2010) Enhancing protein and sugar release from defatted soy
flakes using ultrasound technology. J Food Eng 96: 270–278.
12. Preece KE, Hooshyar N, Krijgsman AJ, et al. (2017) Intensification of protein extraction from
soybean processing materials using hydrodynamic cavitation. Innov Food Sci Emerg Tec 41:
47–55.
13. Wen L, Álvarez C, Zhang Z, et al. (2020) Optimisation and characterisation of protein
extraction from coffee silverskin assisted by ultrasound or microwave techniques. Biomass
Convers Biorefin s13399-020-00712-2.
14. Connolly A, Cermeño M, Crowley D, et al. (2019) Characterisation of the in vitro bioactive
properties of alkaline and enzyme extracted brewers’ spent grain protein hydrolysates. Int Food
Res J 121: 524–532.
AIMS Agriculture and Food Volume 6, Issue 3, 864–878.878
15. Association of Official Analytical Chemists (2000) Official Methods of Analysis of AOAC
International. 17 Eds., Association of Official Analytical Chemists, Gaithersburg, WD, USA.
16. Pearce KN, Kinsella JE (1978) Emulsifying properties of proteins: Evaluation of a turbidimetric
technique. J Agric Food Chem 26: 716–723.
17. Samsalee N, Sothornvit R (2017) Modification and characterisation of porcine plasma protein
with natural agents as potential cross-linkers. Int J Food Sci Tech 52: 964–971.
18. Geremu M, Tola YB, Sualeh A (2016) Extraction and determination of total polyphenols and
antioxidant capacity of red coffee(Coffee arabica L.) pulp of wet processing plants .Chem Biol
Technol 3: 2–6.
19. Xue F, Wu Z, Tong J, et al. (2017) Effect of combination of high-intensity ultrasound treatment
and dextran glycosylation on structural and interfacial properties of buckwheat protein isolates.
Biosci Biotechnol Biochem 81: 1891–1898.
20. Jambrak AR, Mason TJ, Lelas V, et al. (2008) Effect of ultrasound treatment on solubility and
foaming properties of whey protein suspensions. J Food Eng 86: 281–287.
21. Zhang H, Claver IP, Zhu KX, et al. (2011) The effect of ultrasound on the functional properties
of wheat gluten. Molecules 16: 4231–4240.
22. Boye J, Zare F, Pletch A (2010) Pulse protein: Processing, characterization, functional
properties and applications in food and feed. Food Res Int 43: 414–431.
23. Charoensuk D, Brannan RG, Chanasattru W, et al. (2018) Physicochemical and emulsifying
properties of mung bean protein isolate as influenced by succinylation. Int J Food Prop 21:
1633–1645.
24. Bau MTS, Mazzafera P, Santoro LG (2001) Seed storage proteins in coffee. R Bras Fisiol Veg
13: 33–40.
25. Zhang QT, Tu ZC, Xiao H, et al. (2014) Influence of ultrasonic treatment on the structure and
emulsifying properties of peanut protein isolate. Food Bioprod Process 92: 30–37.
26. Roselló-Soto E, Barba FJ, Parniakov O, et al. (2015) High voltage electrical discharges, pulsed
electric field, and ultrasound assisted extraction of protein and phenolic compounds from olive
kernel. Food Bioproc Tech 8: 885–894.
27. Chen S, Zeng Z, Hu N, et al. (2018) Simultaneous optimization of the ultrasound-assisted
extraction for phenolic compounds content and antioxidant activity of Lycium ruthenicum Murr.
fruit using response surface methodology. Food Chem 242: 1–8.
28. Batista MJ, Ávila AF, Franca AS, et al. (2020) Polysaccharide-rich fraction of spent coffee
grounds as promising biomaterial for films fabrication. Carbohydr Polym 233: 115851.
29. Zhao X, Zhu H, Zhang B, et al. (2015) XRD, SEM, and XPS analysis of soybean protein
powders obtained through extraction involving reverse micelles. J Am Oil Chem Soc 92:
975–983.
30. Dong W, Wang D, Hu R, et al. (2020) Chemical composition, structural and functional
properties of soluble dietary fiber obtained from coffee peel using different extraction methods.
Food Res Int 136: 109497.
©2021 the Author(s), licensee AIMS Press. This is an open access
article distributed under the terms of the Creative Commons
Attribution License (http://creativecommons.org/licenses/by/4.0)
AIMS Agriculture and Food Volume 6, Issue 3, 864–878.You can also read