Places and Regions in Human Geography - Map Library Session - March 5th 2020 - ddd-UAB
←
→
Page content transcription
If your browser does not render page correctly, please read the page content below
(imatge de capçalera opcional)

Places and Regions in Human
Geography
Map Library Session – March 5th 2020

                                                                    1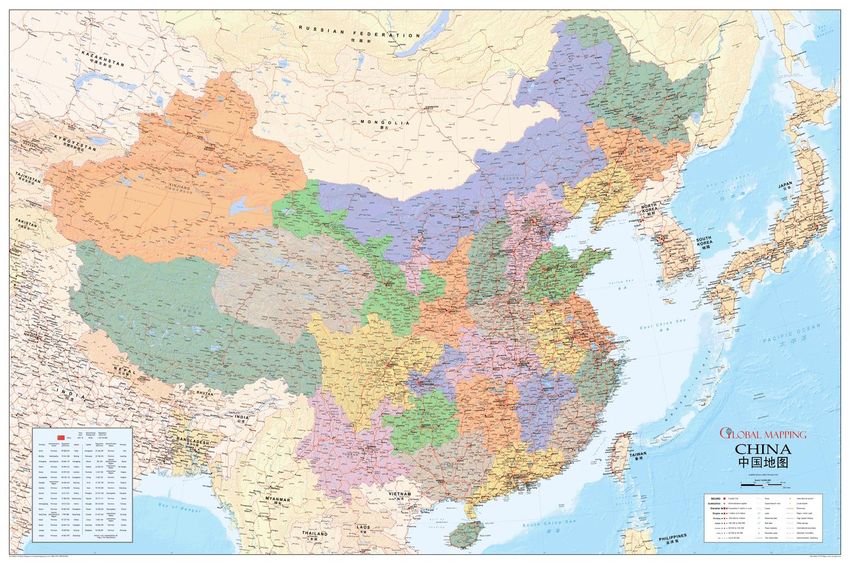
Contents
• What’s a map?

• Technical features (scale, projection, orientation and
  centrality, coordinates)

• Relief representation (contours, hypsometric tints,
  bathymetry)

• Map types (topographic maps, thematic maps,
  cartographic images)

• Cartographic expression and symbols

• Critical reading of a map

                                                           2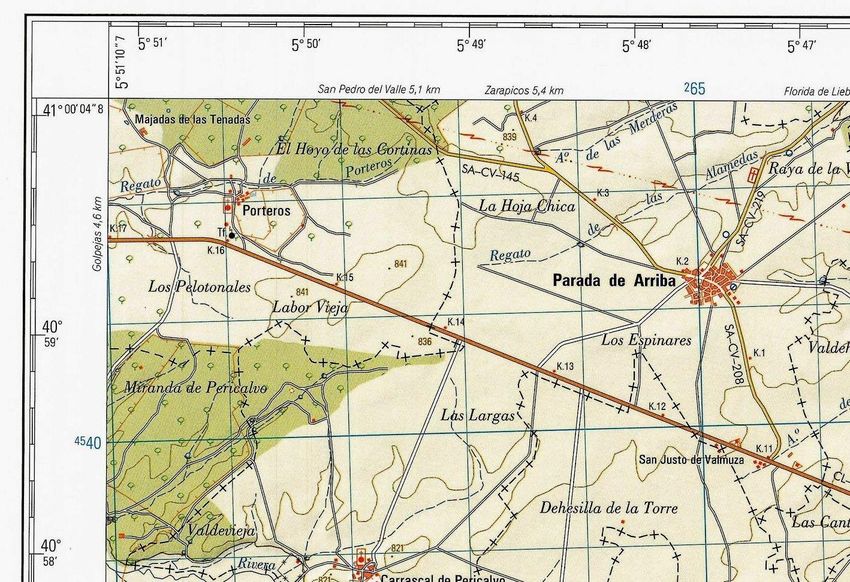
What’s a map?
- A map is a drawing of the earth's surface, or part of that surface, showing
  the shape and position of different countries, political borders, natural
  features such as rivers and mountains, and artificial features such as roads
  and buildings [Cambridge dictionary]

- A map is a symbolic depiction emphasizing relationships between
  elements of some space, such as objects, regions, or themes. [Wikipedia]

- A map is a drawing of a particular area such as a city, a country, or a
  continent, showing its main features as they would appear if you looked
  at them from above. [Collins dictionary]

A map is a selective, abstract and symbolic interpretation of the landscape
and its geographical distributions. [Pau Alegre, geography professor at UAB]

                                                                            3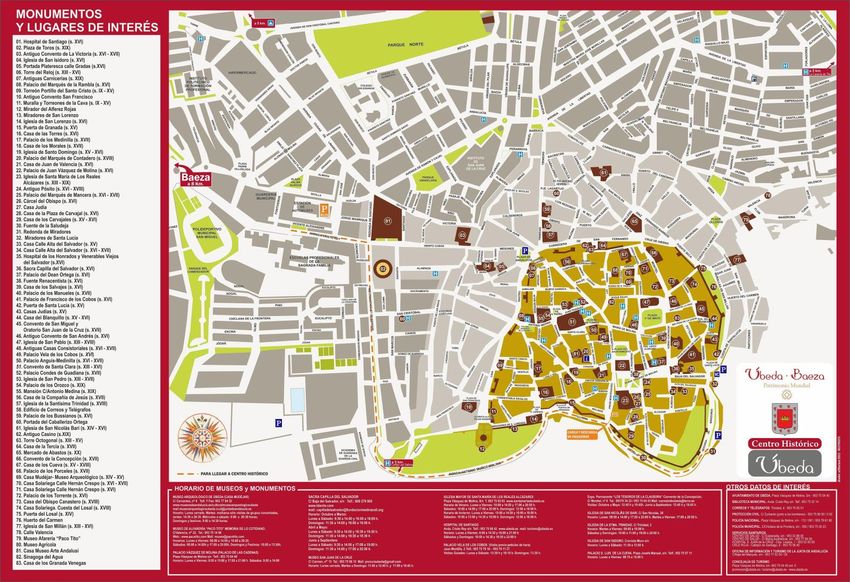
Technical features: Scale
The scale of a map is the ratio of a distance on the map to the
corresponding distance on the ground.

There are two main forms of representing scales:

Bar scales:

Fraction:     1:10 000 (1 cm on the map =10 000 cm on the ground)

Classification of maps according to scale:

- Large scale maps (smaller area, more detail): larger than 1:25 000

- Medium scale maps: 1:50 000 – 1:100 000

- Small scale maps (larger area, less detail): less than 1:200 000

                                                                       4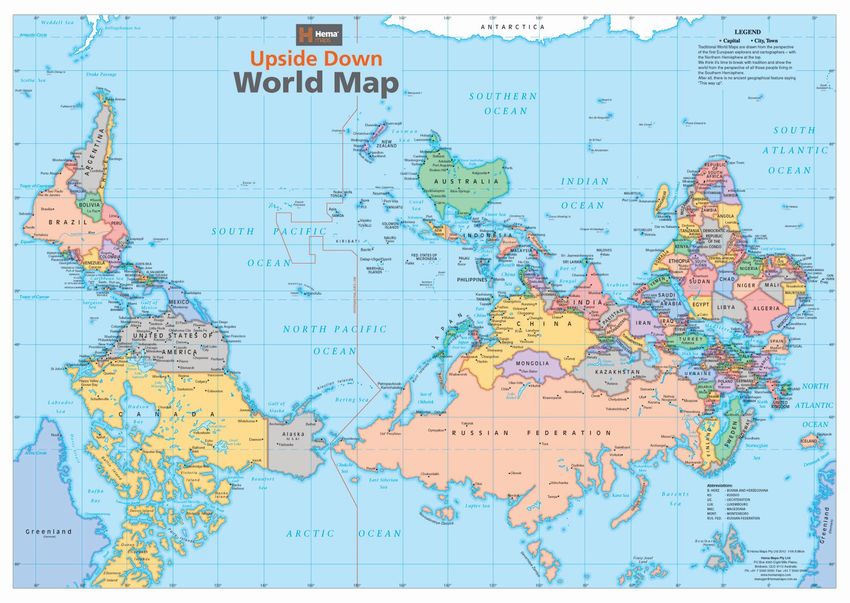
Technical features: Projection
A map projection is a way to flatten a globe's surface into a plane in order
to make a map. This requires a systematic transformation of the latitudes
and longitudes of locations from the surface of the globe into locations on
a plane. All projections of a sphere on a plane necessarily distort the
surface in some way and to some extent.

Projections by preservation of a metric property:

- Conformal: Conformal map projections preserve angles locally.

- Equivalent or Equal-area: Equivalent map projections preserve area
  measure, generally distorting shapes in order to do that.

- Equidistant: Equidistant map projections preserve distances.

                                                                          5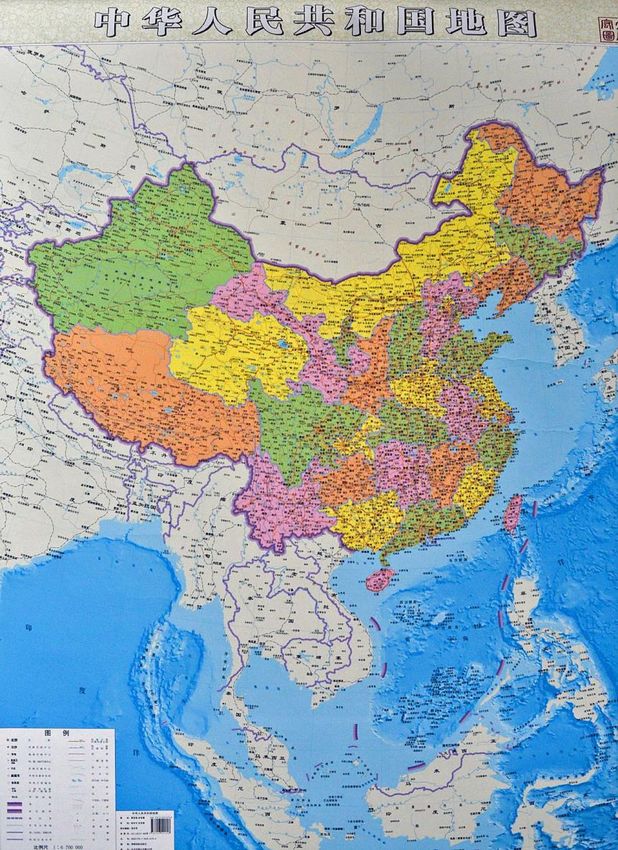
Technical features: Projection

                                 6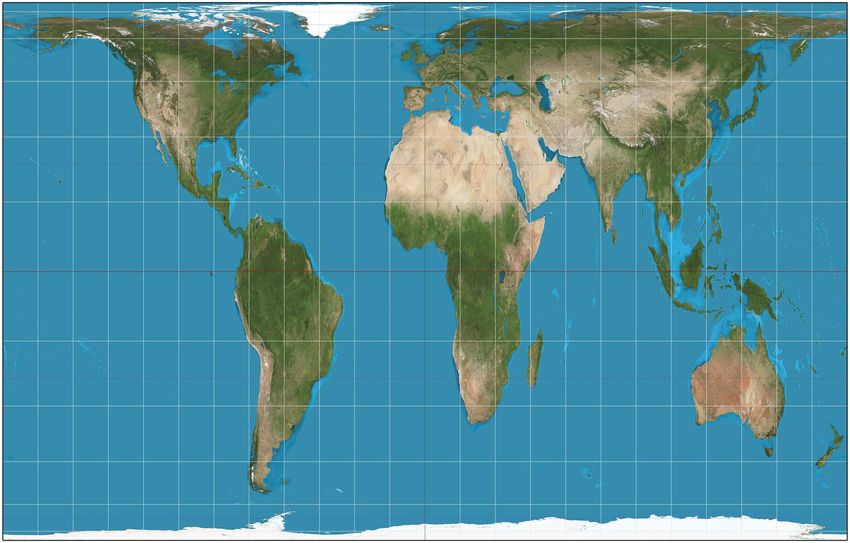
Technical features: Projection
Mercator projection (Conformal)

                                  7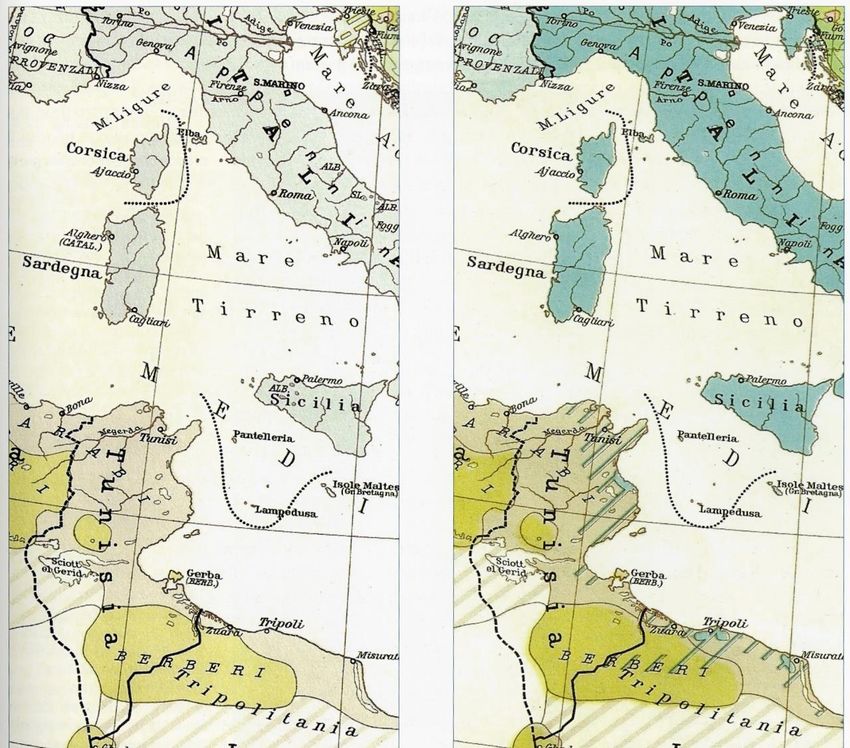
Technical features: Projection
Gall–Peters projection (Equivalent)

                                      8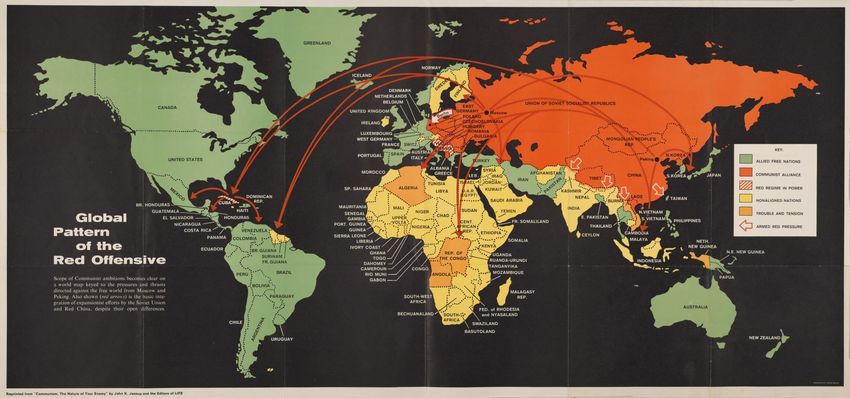
Technical features: Orientation and centrality
 The orientation of a map is the relationship between the directions on
 the map and the corresponding compass directions in reality. The most
 common cartographic convention, is that north is at the top of a map.

                                                                          9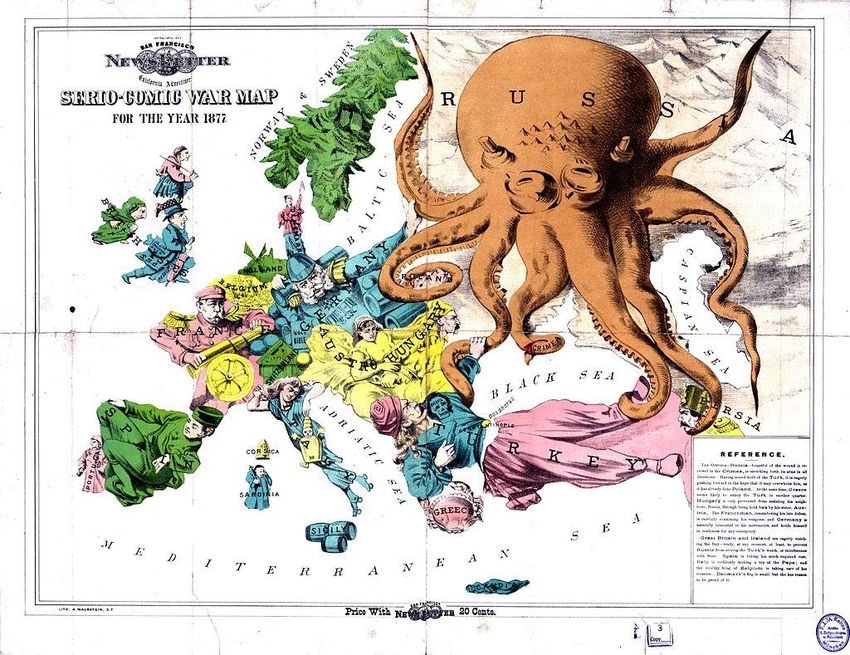
Technical features: Orientation and centrality

                                            10
Technical features: Orientation and centrality
11Technical features: Orientation and centrality
12Technical features: Coordinates
A geographic coordinate system enables every location on Earth to be
specified by a set of numbers, letters or symbols. The coordinates are often
chosen such that one of the numbers represents a vertical position and
two or three of the numbers represent a horizontal position.
A common choice of coordinates is latitude and longitude (expressed in
degrees)
13Technical features: Coordinates
Another common choice is UTM coordinate system. It divides Earth into 60
zones. Specifying a location means specifying the zone and the x, y
coordinate inside the zone (expressed in kilometers).
14Technical features: Coordinates
Latitude / longitude coordinates and UTM coordinates
15Relief representation: Contour lines
The height and shape of the land is shown on a map using ‘contour
lines’. These lines appear as thin orange or brown lines with numbers
on them. The number tells you the height above sea level of that line.
16Relief representation: Hypsometric tints
Hypsometric tints are colors placed between contour lines to indicate
elevation. These tints are shown as bands of color in a graduated
scheme or as a color ramp applied to contour lines themselves.
17Relief representation: Bathymetry
Bathymetric maps show underwater depth of lake or ocean floors. In
other words, bathymetry is the underwater equivalent to hypsometry
or contours.
18Map types: Topographic maps
A topographic is a type of map characterized by large-scale detail and a
representation of relief, usually using contour lines. Traditional definitions
require a topographic map to show both natural and man-made features.
19Map types: Thematic maps
A thematic map is a type of map specifically designed to show a
particular theme connected with a specific geographic area.
20Map types: Thematic maps
Thematic maps usually categorize information using three types of
representation: points, lines and areas.
Points:
21Map types: Thematic maps
Lines:
22Map types: Thematic maps
Areas:
23Map types: Cartographic images
Aerial photography: image taken from an aircraft or other flying object.
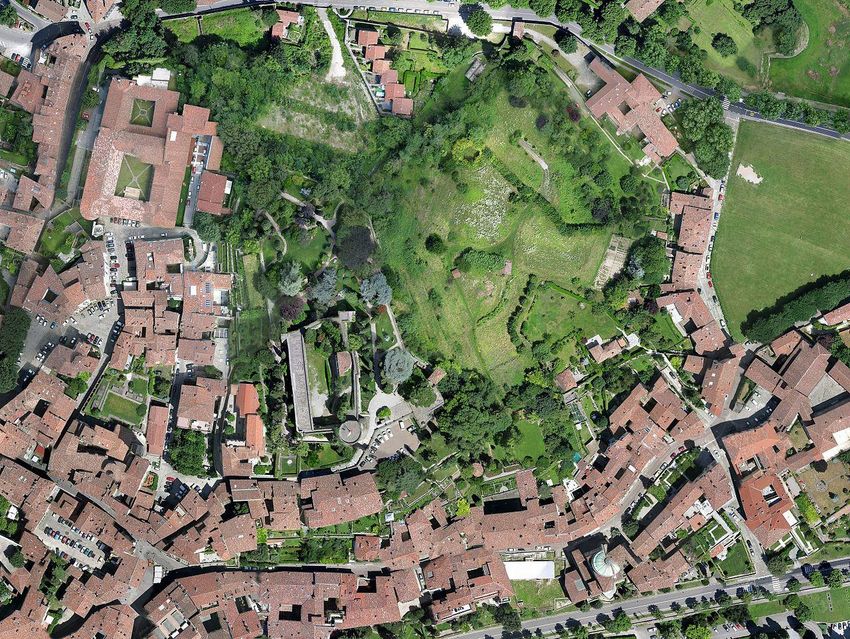
24Map types: Cartographic images
Orthophoto: An orthophoto is an aerial photograph or satellite imagery
geometrically corrected ("orthorectified") such that the scale is uniform: the
photo or image follows a given map projection.
25Map types: Cartographic images
Satellite images
26Cartographic expression and symbols
A map has different symbols and text. The symbols are used for
describing some part of the reality, while the text is used for a more
detailed description of the object that are depicted in the map.
27Cartographic expression and symbols
Color is a very useful attribute to depict different features on a map.
Displaying the data in different hues can greatly affect the understanding or
feel of the map. In many cultures, certain colors have connotations.
28Cartographic expression and symbols
A choropleth map is a thematic map in which areas are colored differently
to show the measurement of a statistical variable being displayed on the
map.
29Critical reading of a map
Use of centrality
30Critical reading of a map
Use of centrality
31Critical reading of a map
Use of symbols and colors
32Critical reading of a map
Use of symbols and colors
33Critical reading of a map
Use of symbols and colors
34Critical reading of a map
Use of information
35Critical reading of a map
Use of information
36Credits
• Slide 6: Projections image retrieved from: Wikipedia. “Proyección de cartográfica”.
https://es.wikipedia.org/wiki/Proyecci%C3%B3n_cartogr%C3%A1fica
• Slide 7: World map Mercator projection retrieved from: Wikipedia. “Proyección de Mercator”.
https://es.wikipedia.org/wiki/Proyecci%C3%B3n_de_Mercator
• Slide 8: Mapamundi projecció Gall-Peters extret de: Wikipedia. “Proyección de Peters”.
https://es.wikipedia.org/wiki/Proyecci%C3%B3n_de_Peters
• Slides 10, 11 i 12: World maps published in U.S.A., Japan and Australia retrieved from:
Geografía infinita. “El mapa del mundo es distinto para cada país”.
https://www.geografiainfinita.com/2014/08/visiones-del-mundo-el-mapamundi-segun-cada-
cultura/
• Slides 13 and 14: Images of geographical coordinates and UTM coordinates retrieved from
Wkipedia https://commons.wikimedia.org/wiki/Category:Geographic_coordinate_system
and https://en.wikipedia.org/wiki/Universal_Transverse_Mercator_coordinate_system
• Slide 16 and 27: Images of countours and symbols retrieved from Map Reading brochure by
Ordnance Survey. https://www.ordnancesurvey.co.uk/documents/resources/map-
reading.pdf
• Slide 24: Aerial photography retrieved from Fototeca IGN. https://fototeca.cnig.es/
37Credits
• Slide 31: Verticalmap of China retrieved from China.org.cn
http://www.china.org.cn/china/2013-01/12/content_27665192.htm
• Slide 32: Touristic map of Úbeda retrieved from: http://ubedaybaezaturismo.com/lugares-de-
interes/descargar-planos-centro-historico-de-ubeda-y-baeza/
• Slide 33: Global pattern of the red offensive retrieved from “Persuasive Cartography: The PJ
Mode Collection”. Cornell University Library. https://persuasivemaps.library.cornell.edu/
• Slide 34: “El mapa de las 4.000 viviendas okupadas en Madrid” retrieved from ABC Madrid,
21/09/2018. https://www.abc.es/espana/madrid/abci-mapa-4000-viviendas-okupadas-
madrid-201710290205_noticia.html [Consultat el 2-11-2018]
• Slide 35: Satirical map of Europe(1877). Frederick Rose. Retrieved from “Rusia, la (más) mala
de la película en los mapas satíricos”. Blog Geografia Infinita
https://www.geografiainfinita.com/2016/07/rusia-la-mas-mala-de-la-pelicula-en-los-mapas-
satiricos/
• Slide 36: Etnographic maps of Italy from Touring Club Italiano retrieved from Cartografia,
ideologia i poder (catalog record) https://cataleg.uab.cat/iii/encore/record/C__Rb1944907)
38Thanks!
UAB Map Library contact:
Phone number: 93 581 20 45
E-mail: Cartoteca@uab.cat
39You can also read