PLANTMWPIDB: A DATABASE FOR THE MOLECULAR WEIGHT AND ISOELECTRIC POINTS OF THE PLANT PROTEOMES
←
→
Page content transcription
If your browser does not render page correctly, please read the page content below
www.nature.com/scientificreports
OPEN PlantMWpIDB: a database
for the molecular weight
and isoelectric points of the plant
proteomes
Tapan Kumar Mohanta1,5*, Muhammad Shahzad Kamran2,5, Muhammad Omar3,4,
Waheed Anwar2 & Gyu Sang Choi4*
The molecular weight and isoelectric point of the proteins are very important parameters that control
their subcellular localization and subsequent function. Although the genome sequence data of the
plant kingdom improved enormously, the proteomic details have been poorly elaborated. Therefore,
we have calculated the molecular weight and isoelectric point of the plant proteins and reported
them in this database. A database, PlantMWpIDB, containing protein data from 342 plant proteomes
was created to provide information on plant proteomes for hypothesis formulation in basic research
and for biotechnological applications. The Molecular weight and isoelectric point (pI) are important
molecular parameters of proteins that are useful when conducting protein studies involving 2D gel
electrophoresis, liquid chromatography-mass spectrometry, and X-ray protein crystallography.
PlantMWpIDB provides an easy-to-use and efficient interface for search options and generates a
summary of basic protein parameters. The database represents a virtual 2D proteome map of plants,
and the molecular weight and pI of a protein can be obtained by searching on the name of a protein,
a keyword, or by a list of accession numbers. The PlantMWpIDB database also allows one to query
protein sequences. The database can be found in the following link https://plantmwpidb.com/. The
individual 2D virtual proteome map of the plant kingdom will enable us to understand the proteome
diversity between different species. Further, the molecular weight and isoelectric point of individual
proteins can enable us to understand their functional significance in different species.
Each and every molecule in a cell has its own special characteristics, including the individual proteins that com-
prise the proteome of an o rganism1,2. Proteomes comprise all of the translated products of nucleotide sequences
contained in messenger RNA (mRNA)3–5. The total mRNA of an organism encodes a wide array of proteins
that vary in cellular function and homeostasis6–8. These proteins have diverse molecular weights and isoelectric
points (pIs)1,2. Post-translational modifications that occur can alter the function of a protein and contribute to
the ability to target the location of a protein to a specific subcellular compartment9–11. The shape, size, solubility,
and pI of a protein determine its ability to move across different cellular compartments and also determine their
function12–17. Plant cells contain a vast array of proteins with different molecular weight and pI1. The pI indicates
the pH at which the net charge of a protein is z ero1. The dissociation constant (pKa) of a polypeptide is determined
by the presence of seven different charged amino acids; arginine, aspartate, cysteine, glutamate, histidine, tyros-
ine, and l ysine18–20. The N-terminal N H2- and C-terminal COOH-group of a protein also influences the charge
of a polypeptide21–25. Post-translational modifications, protein–protein interactions, dipole interactions, and
other biochemical factors also influence the pI of a p rotein26–30. Molecular weight and pI are used to determine
the position of a protein sequence in a proteome map and provide useful information to bioinformatics and
genome scientists seeking to understand the molecular basis of subcellular localization and function31,32. Several
attempts have been made to create a database of experimentally validated proteins33–38. It is difficult, however, to
1
Natural and Medical Sciences Research Center, University of Nizwa, Nizwa 616, Oman. 2Department of Computer
Science and IT, The Islamia University of Bahawalpur, Bahawalpur, Pakistan. 3Department of Data Science,
Faculty of Computing, The Islamia University of Bahawalpur, Bahawalpur, Pakistan. 4Department of Information
and Communication Engineering, Yeungnam University, 214‑1, Gyeongsan‑si 712‑749, South Korea. 5These
authors contributed equally: Tapan Kumar Mohanta and Muhammad Shahzad Kamran. *email: nostoc.tapan@
gmail.com; castchoi@ynu.ac.kr
Scientific Reports | (2022) 12:7421 | https://doi.org/10.1038/s41598-022-11077-z 1
Vol.:(0123456789)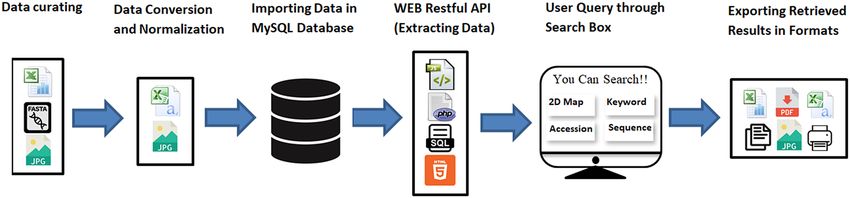
www.nature.com/scientificreports/
Figure 1. Flowchart depicting the design of PlantMWpIDB of plant proteomes.
experimentally validate the pI and molecular weight of each and every individual protein in a proteome. Previ-
ous databases have contained experimentally validated pI data on a maximum of five thousand proteins, which
is a relatively low number compared to the number of proteins present in the whole proteome of a species39,40.
Therefore, we constructed a database containing the pI and molecular weight representative of the entire plant
kingdom by including protein sequences from the whole proteome of 342 plant species. The PlantMWpIDB
database comprises 6.115 million proteins sequences present in the plant kingdom. PlantMWpIDB has a search
engine that allows one to explore a virtual 2D map of the global, plant proteome, and search by protein name,
keyword, accession number, and protein sequence.
Construction and content
PlantMWpIDB is a novel database containing proteomic information on 342 plant species. The study contains
a total of 13.82 million protein sequences. The molecular weight and isoelectric point of plant proteins were
calculated using the Linux-based isoelectric point calculator41 and the result obtained from the analysis was
used to construct the database. PlantMWpIDB provides a user-friendly interface and display of information. It
provides a user the ability to search for information about a specific protein of a species and provides a summary
of information and statistics on plant proteomes.
Annotated protein sequences of plant species were downloaded from the National Center for Biotechnology
Information (NCBI), Phytozome, and Uniprot in fasta/fna format. The downloaded protein files were used to
calculate the predicted molecular weight and isoelectric (pI) point of all the proteins. The latter was determined
rg/) (IPC Python) within a Linux-based platform41.
using a protein isoelectric point calculator (http://i soele ctric.o
The IPC program provided the molecular weight and isoelectric point of the individual protein sequences. The
results were subsequently processed using Microsoft Excel 2016.
The database provides three types of searching and browsing information:
• Scatter plot image of the proteome of an individual species, which is referred to as a virtual 2-D map of the
proteome of a species.
• Text information about each species, including the accession number of each of the proteins, protein names,
molecular weight (kDa), and isoelectric point (pI).
• Protein sequences.
There are three types of entities in the database:
• “species”, for storing plant species protein information.
• “species map”, for storing a virtual 2D proteome map of each species.
• “protein sequence”, for storing proteins sequences of each species.
The detailed pipeline used for the construction of PlantMWpIDB is presented in Fig. 1. Users can access the
sequence, molecular mass, and pI of a specific protein by providing the accession number of the protein. Users
can also use keywords or protein names to find the molecular weight and pI of a protein of the respective spe-
cies (Fig. 2). Users can also extract a virtual 2D proteome map of an individual species by browsing the name of
a species in the module panel (Fig. 2). The virtual 2D map of a plant proteome represents an image of a virtual
two-dimensional polyacrylamide gel electrophoresis (2D-PAGE) gel.
Languages and tools
User interfaces were developed to provide easy-to-use and efficient access to data. The static interfaces were
developed using Hypertext markup language (HTML) and CSS. Restful web API (JSON) and JQuery were used
to provide efficient access to web pages. Java Script was used to avoid repeated reloading of pages when a user
makes a query using text boxes, thus, improving the efficiency of the interface. Server-side programming lan-
guage (Php) and query processing language (SQL) was used for developing access to the data within the database.
Tables are used to display the data, and each table provides options to copy and save the retrieved information,
with the ability to export the information in a variety of file types, including Excel, csv, pdf. Print options using
JQuery are also available. The design structure of the PlantMWpIDB, web-based database is presented in Fig. 1.
Scientific Reports | (2022) 12:7421 | https://doi.org/10.1038/s41598-022-11077-z 2
Vol:.(1234567890)www.nature.com/scientificreports/
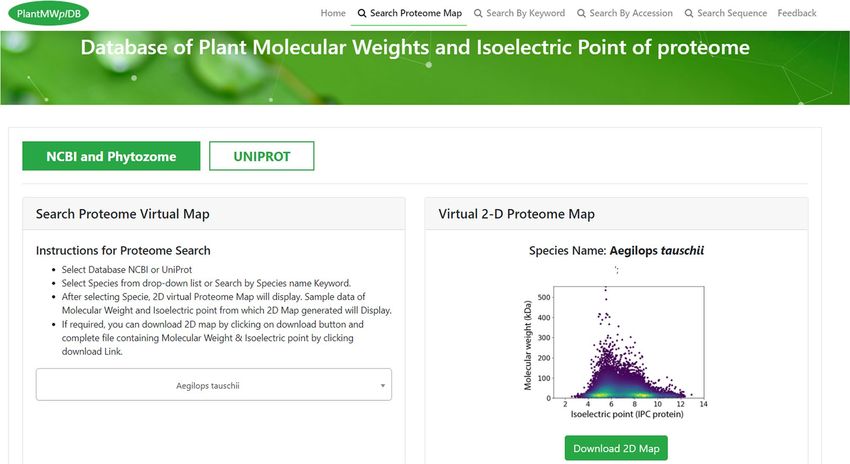
Figure 2. Pictorial presentation of PlantMWpIDB interface. The database shows the search box for the
individual species to find the molecular weight and isoelectric point of the plant protein. The user can use the
search box using keyword/protein name in any specific species to search the molecular weight and isoelectric
point of the protein associated with the key words.
Construction of modules
PlantMWpIDB has five main modules:
• search virtual 2D map of the plant proteome.
• search by protein name keyword(s).
• search by accession number(s).
• search by protein sequence.
• Summary statistics.
Using the module, “search virtual 2D map of the plant proteome”, allows one to find the virtual 2D map which
is constructed using a scatter plot program and is based on Molecular mass (KDa) and Isoelectric point (pI)
protein data of each species. The summary statistics contain the proteomic details of proteomes downloaded
from NCBI, Phytozome, and Uniprot.
The construction of the two modules—“Search Proteins by Protein Name Keyword”, and by “Accession Num-
ber”, were completed in two steps:
• Preprocessing of the data: The following protein data were collected from each species and placed in a
Microsoft excel file which was generated through IPC software41; accession number, protein name, molecular
mass, and isoelectric point of each species. The excel files were then converted to comma-separated files (csv)
to import the data into MySQL.
• Database Design: The database was designed in MySQL Server. The structure of the database tables is pre-
sented in Supplementary Table 1. After creating database tables, for all of the 342 database tables, they were
imported into the MySQL Server.
The construction of the “search protein sequence” was completed in two steps:
• Preprocessing of the data: For the development of this module, Fasta files were converted to a comma-
separated format (csv) using a python language script and then imported into the MySQL Server. The csv
files were then compressed for efficient memory use.
• Database Design: Tables were created for the database for the protein sequences of each of the plant species.
After creating the database tables for all species, they were imported using a command prompt. The database
contains protein sequence tables for each of the 342 plant species.
Scientific Reports | (2022) 12:7421 | https://doi.org/10.1038/s41598-022-11077-z 3
Vol.:(0123456789)www.nature.com/scientificreports/
Proteomic parameters Proteomes from NCBI and phytozome Proteomes from uniprot
Total number of proteome 147 195
Total number of protein sequences 6,115,918 7,713,142
Average molecular weight of plant proteome 1,965,567 kDa 1,701,111 kDa
Average molecular weight of plant protein 47 kDa 44 kDa
Average pI 6.84 6.88
Number of acidic pI proteins 3,427,218 4,212,269
Percentage of acidic pI proteins 56 54
Number of basic pI proteins 2,674,959 3,484,682
Percentage of basic pI proteins 43 45
Total number of neutral pI proteins 13,741 16,191
Percentage of neutral pI proteins 0.21 0.2
Table 1. Statistics of plant proteomes downloaded from different sources.
• Proteome statistics are efficiently calculated using SQL queries. The summary statistics table of all the pro-
teomes has a sorting option for each column that further facilitates data analysis.
Results
The module provides users an overview of the overall statistics of the database. The general statistics provided
for the proteome of each species include:
• Sequence count.
• Average molecular weight.
• Average pI.
• Number of acidic pI proteins.
• Percentage of acidic pI proteins.
• Number of basic pI proteins.
• Percentage of basic pI proteins.
The overall statistics of the PlantMWpIDB database (https://plantmwpidb.com/) are provided in Table 1.
The main purpose of PlantMWpIDB (https://p lantm
wpidb.c om/) is to facilitate the ability to obtain informa-
tion on a specific protein in a specific species or groups of species. Different methods can be used to extract the
proteomic data on a protein within an individual species.
• Searching a Virtual 2D Map of Plant Proteomes
• This module provides the facility to search or browse a virtual 2D map of the proteome of a given plant spe-
cies. The interface is shown in Fig. 2. The interface has two options (1) pI and molecular weight of proteins
downloaded from NCBI and phytozome and (2) pI and molecular weight proteins downloaded from Uniprot.
• This interface has a list box with species names, along with a keyword search option, instructions for using
the module, and a map window for displaying the virtual 2D map of the proteome of a selected species. By
default, it will display the virtual 2D map of the proteome of the first species on the list.
• Users can download the raw data of pI and molecular weight of individual species. Also, users can download
the 2D proteome map of a selected species.
Search proteins by protein name or keyword. This module provides the user with the ability to search
for information on a protein using an accession number, protein name, molecular weight, or isoelectric point
(pI) within a species or by a keyword related to the protein name (Fig. 2). The user also has the ability to save or
print the information once it has been retrieved from the database. The interface has a list box of species names
and a keyword search option. A text box is provided for entering a protein name or keyword. Instructions for
using the module are also provided. The interface also includes a window for displaying search results for a given
species. By default, it will display two results within the first species on the list for entered keywords. The inter-
face has options for copying or printing the retrieved results. Alternatively, the retrieved results can be saved in
several file formats, including an Excel file, pdf, or csv file. This interface is presented in Fig. 2.
Sub‑search option on retrieved search results. The sub-search option queries the table that is formed
from retrieved data. It queries all the columns of data within the retrieved table. For example, in searching for a
protein by name, a user can search a keyword of a protein name from the interface. The retrieved results of the
search will be presented in a table. Users can then use the sub-search option to locate a specific entry or entries
in the retrieved results.
Scientific Reports | (2022) 12:7421 | https://doi.org/10.1038/s41598-022-11077-z 4
Vol:.(1234567890)www.nature.com/scientificreports/
Sorting options on each column. Users also have the option of sorting any column within the retrieved
results table (see point 2).
Search proteins by accession number. This provides the ability to search the database using the acces-
sion number, protein name, molecular mass, or isoelectric point (pI) within a specific species by using a single
accession number or a list of accession numbers. The user can also save the retrieved information for subsequent
use. The interface has a list box of species names, along with a keyword search option. A text box for entering a
single or list of an accession number(s), and instructions for using this module are also provided and there is a
window that displays the search results within a selected species. By default, it will display two results within the
first two accession numbers of the first species in the list. The module has options that allow the user to copy,
print, or export the retrieved results as an Excel file, pdf, or csv file.
Search by protein sequence. This module provides the ability to search the database using a protein
sequence within a species using a list of accession numbers provided by the user. The interface has a list box of
species names with a protein name or keyword search option. A text box is provided for entering a list of acces-
sion numbers, and instructions for using this module are also provided. The interface also includes a window
for displaying sequences within a selected species name. By default, it will display two results within the first two
accession numbers of the first species in the list. As with other modules, the interface provides option to option
copy, print, or save the retrieved data as an Excel file, pdf, or csv file.
Error messages within the different modules
All of the modules will provide an alert (error message) if incomplete or incorrect data are entered into the
search options as follows:
• If the user clicks on a button with an empty search box field and list box, the system will display the message,
“Please select options and enter search data in the search box”, via an alert box.
• If the user clicks on a button with an empty search box field and selects the list box, the system will display
this message, “Please enter search data in the search box”, via an alert box.
• If the user enters a keyword in the search box field with length of less than four characters, the system will
display the message, “Please enter valid Accession number of at least four characters or comma separated
list of accession numbers in the search box”, via an alert box.
• If no results are found in the database, the system will display the message, “Sorry! Matching records are not
found in the database”, via an alert box.
Discussion
Several databases are available on the web for use by genomic researchers that provide different types of infor-
mation on either a small or large scale. Proteome-pI and Proteome-pI 2.0 is a database having data of isoelectric
point of several proteomes40,42. Recently, Kozlowski (2022) reported the Proteome pI-2.0: proteome isoelectric
point database where the author reported the molecular weight, isoelectric point, and enzymatic digestion details
of 61.329 million protein sequences from 20,115 p roteomes42. They were from eukaryote, bacteria, archaea,
42
and viruses . From the mentioned eukaryotic species, Kozlowski (2022) reported the molecular weight and
isoelectric point of more than 250 plant species. However, a lack of proper classification makes it difficult to find
out the plants or animal species from a large number of species42. Therefore, we constructed PlantMWpIDB and
reported here. Our study provided the proteomic data of 342 plant species from the proteomic sequences of
NCBI, Phytozome, and Uniprot. The plant proteomic database (PPDB) provides proteomic data on Arabidopsis
and maize4. A database on moonlighting plant proteins (PlantMP) contains protein functions searchable by
UniProt IDs and names, canonical and moonlighting functions, or gene ontology n umbers43. The Arabidopsis
Nucleolar Protein Database (AtNoPdb) provides information on 217 proteins found in Arabidopsis44. In general,
these databases provide information on a limited number of plant species and/or a limited number of proteins
in a sporadic manner.
Although, Proteome-pI 2.0 provided the proteomic data of more than 250 plant species, a lack of specific
classification making it difficult to identify which of the data is plant, animal, or fungi species. Therefore, we
have constructed PlantMWpIDB based on the 342 species of the plant kingdom to provide information on the
molecular weight and isoelectric point of 13.82 million protein sequences. In addition, the Proteome-pI 2.0 do
not have any option to search for the molecular weight and isoelectric point of any particular protein using the
“keyword”, “accession number”, or protein sequence42. For this, a user need to download whole data file to find
the molecular weight and isoelectric point of a single protein. Also, Proteome-pI 2.0 has provided the isoelectric
point of protein sequences using 21 different parameters including Bjellqvist, DTASelect, Dawson,EMBOSS,
Grimsley, IPC2_peptide, IPC2_protein, IPC_peptide, IPC_protein, Lehninger, Nozaki, Patrickios, ProMoST,
Rodwell, Sillero, Solomon, Thurlkill, Toseland, Wikipedia, IPC2.protein.svr19, and IPC2.peptide.svr1942. It will
be difficult for the user to decide which isoelectric point is correct for a particular protein sequence. However,
our study revealed isoelectric point obtained using IPC_protein best suit with the native isoelectric point of the
protein. Therefore, we have constructed our database using the feature of IPC_protein.
The isoelectric point of a protein represents the pH at which the net charge of the protein is zero, and rep-
resents an important analytical and molecular p arameter1. The pI of a protein is often used in biochemistry to
determine differential expression of a protein based on 2D-PAGE gel electrophoresis, x-ray protein crystallogra-
phy, and capillary isoelectric f ocusing45–47. The global virtual 2D map of the plant kingdom exhibited a trimodal
Scientific Reports | (2022) 12:7421 | https://doi.org/10.1038/s41598-022-11077-z 5
Vol.:(0123456789)www.nature.com/scientificreports/
distribution within the global proteome, with acidic pI proteins dominating over the basic pI proteins1. This
suggests that the pI of the majority of plant proteins are close to the physiological pH of a cell. In our previous
study1, we reported that the molecular weight in the global plant proteome ranged from 0.54 to 2236.8 kDa and
the isoelectric point ranged from 1.99 to 13.961. The acidic pI proteins of monocot plants were closely correlated
with the acidic pI proteins of bryophytes, while they were distantly related to algae and eudicot plants1. The amino
acid composition of the global plant proteome was observed to be lineage specific1. The amino acid composition
of algae, monocot, and eudicot proteome form independent clusters. Leu, Ser, Ile, Lys, and Gln are amino acids
that are highly abundant in the plant proteome, while Tyr, Trp, Cys, His, and Met are low abundant amino a cids1.
Future perspectives. The PlantMWpIDB database contains the molecular weight and isoelectric point of
the plant proteomes of 342 species, including algae, bryophytes, pteridophytes, gymnosperms, monocots, and
eudicots. Future versions of the PlantMWpIDB database will include protein molecular modeling module to
decipher the 3-D structure of each protein. Future versions will also include target site prediction for metacas-
pases, palmitoylation, myristiylation, and methylation for each protein. Collectively, this additional information
will provide important information to researchers investigating protein modification, function, structure, and
evolution.
Conclusion
PlantMWpIDB provides researchers with the ability to retrieve information on the molecular mass and pI of
proteins within the proteome of 342 plant species, ranging from algae to eudicots. PlantMWpIDB is the most
comprehensive database available on plant proteomes and contains several modules for searching, retrieving,
and saving data. Future versions of PlantMWpIDB will make the database even more powerful for obtaining
information on the proteome of the entire plant kingdom.
Received: 22 June 2021; Accepted: 11 April 2022
References
1. Mohanta, T. K., Khan, A. L., Hashem, A., Abd Allah, E. F. & Al-Harrasi, A. The molecular mass and isoelectric point of plant
proteomes. BMC Genom. 20, 631 (2019).
2. Mohanta, T. K. et al. Virtual 2-D map of the fungal proteome. Sci. Rep. 11, 6676 (2021).
3. Uversky, V. N. In Posttranslational modification (eds Maloy, S. & Hughes, K. B. T.) 425–430 (Academic Press, 2013). https://doi.
org/10.1016/B978-0-12-374984-0.01203-1.
4. Sun, Q. et al. PPDB, the plant proteomics database at cornell. Nucleic Acids Res. 37, D969–D974 (2009).
5. Mohanta, T., Syed, A., Ameen, F. & Bae, H. Novel genomic and evolutionary perspective of cyanobacterial tRNAs. Front. Genet.
8, 200 (2017).
6. Ochsenreiter, T., Cipriano, M. & Hajduk, S. L. Alternative mRNA editing in trypanosomes is extensive and may contribute to
mitochondrial protein diversity. PLoS ONE 3, e1566 (2008).
7. Reid, D. W. & Nicchitta, C. V. Diversity and selectivity in mRNA translation on the endoplasmic reticulum. Nat. Rev. Mol. Cell
Biol. 16, 221–231 (2015).
8. Livingstone, M., Atas, E., Meller, A. & Sonenberg, N. Mechanisms governing the control of mRNA translation. Phys. Biol. 7, 21001
(2010).
9. Li, X. et al. Quantitative chemical proteomics approach to identify post-translational modification-mediated protein–protein
interactions. J. Am. Chem. Soc. 134, 1982–1985 (2012).
10. Eisenhaber, B. E. Posttranslational modifications and subcellular localization signals: Indicators of sequence regions without
inherent 3D structure?. Curr. Protein Peptide Sci. 8, 197–203 (2007).
11. Finkemeier, I., Laxa, M., Miguet, L., Howden, A. J. M. & Sweetlove, L. J. Proteins of diverse function and subcellular location are
lysine acetylated in Arabidopsis. Plant Physiol. 155, 1779–1790 (2011).
12. Wolf, S., Lucas, W. J., Deom, C. M. & Beachy, R. N. Movement protein of tobacco mosaic virus modifies plasmodesmatal size
exclusion limit. Science 246, 377–379 (1989).
13. Ivankov, D. N. et al. Contact order revisited: Influence of protein size on the folding rate. Protein Sci. 12, 2057–2062 (2003).
14. Hishigaki, H., Nakai, K., Ono, T., Tanigami, A. & Takagi, T. Assessment of prediction accuracy of protein function from protein–
protein interaction data. Yeast 18, 523–531 (2001).
15. Kudlow, J. E. Post-translational modification by O-GlcNAc: Another way to change protein function. J. Cell. Biochem. 98, 1062–1075
(2006).
16. Belizaire, R. & Unanue, E. R. Targeting proteins to distinct subcellular compartments reveals unique requirements for MHC class
I and II presentation. Proc. Natl. Acad. Sci. 106, 17463–17468 (2009).
17. Park, D., Choi, S. S. & Ha, K.-S. Transglutaminase 2: A multi-functional protein in multiple subcellular compartments. Amino
Acids 39, 619–631 (2010).
18. Ugo, P., Marafini, P. & Meneghello, M. Symbol List 21–22 (De Gruyter, 2021). https://doi.org/10.1515/9783110589160-206.
19. Erickson, H. P. Kinetics of protein–protein association and dissociation. Principles of Protein–Protein Association 5–8 (2019)
doi:https://doi.org/10.1088/2053-2563/ab19bach8.
20. Wu, Y. C., Koch, W. F., Berezansky, P. A. & Holland, L. A. The dissociation constant of amino acids by the conductimetric method:
I. pK1 of MOPSO-HCl at 25 °C. J. Solution Chem. 21, 597–605 (1992).
21. Das, R. K., Crick, S. L. & Pappu, R. V. N-terminal segments modulate the α-helical propensities of the intrinsically disordered
basic regions of bZIP proteins. J. Mol. Biol. 416, 287–299 (2012).
22. Vamvaca, K., Volles, M. J. & Lansbury, P. T. The first N-terminal amino acids of α-synuclein are essential for α-helical structure
formation in vitro and membrane binding in yeast. J. Mol. Biol. 389, 413–424 (2009).
23. Requião, R. D. et al. Protein charge distribution in proteomes and its impact on translation. PLOS Comput. Biol. 13, e1005549
(2017).
24. von Heijne, G. Net N-C charge imbalance may be important for signal sequence function in bacteria. J. Mol. Biol. 192, 287–290
(1986).
25. von Heijne, G. Analysis of the distribution of charged residues in the N-terminal region of signal sequences: implications for
protein export in prokaryotic and eukaryotic cells. EMBO J. 3, 2315–2318 (1984).
Scientific Reports | (2022) 12:7421 | https://doi.org/10.1038/s41598-022-11077-z 6
Vol:.(1234567890)www.nature.com/scientificreports/
26. Dinçbas-Renqvist, V. et al. A post-translational modification in the GGQ motif of RF2 from Escherichia coli stimulates termina-
tion of translation. EMBO J. 19, 6900–6907 (2000).
27. Phelps, D. S., Floros, J. & Taeusch, H. W. Jr. Post-translational modification of the major human surfactant-associated proteins.
Biochem. J. 237, 373–377 (1986).
28. Aitken, A. Post-translational modification of 14-3-3 isoforms and regulation of cellular function. Semin. Cell Dev. Biol. 22, 673–680
(2011).
29. Nussinov, R., Tsai, C.-J., Xin, F. & Radivojac, P. Allosteric post-translational modification codes. Trends Biochem. Sci. 37, 447–455
(2012).
30. Zhang, L. et al. Towards posttranslational modification proteome of royal jelly. J. Proteom. 75, 5327–5341 (2012).
31. Li, F.-M.L. Predicting protein subcellular location using chous pseudo amino acid composition and improved hybrid approach.
Protein Peptide Lett. 15, 612–616 (2008).
32. Park, K.-J. & Kanehisa, M. Prediction of protein subcellular locations by support vector machines using compositions of amino
acids and amino acid pairs. Bioinformatics 19, 1656–1663 (2003).
33. Pierleoni, A., Martelli, P. L., Fariselli, P. & Casadio, R. eSLDB: Eukaryotic subcellular localization database. Nucleic Acids Res. 35,
D208–D212 (2007).
34. Rastogi, S. & Rost, B. LocDB: experimental annotations of localization for Homo sapiens and Arabidopsis thaliana. Nucleic Acids
Res. 39, D230–D234 (2011).
35. Negi, S., Pandey, S., Srinivasan, S. M., Mohammed, A. & Guda, C. LocSigDB: a database of protein localization signals. Database
2015, 2 (2015).
36. Guo, X., Liu, F., Ju, Y., Wang, Z. & Wang, C. Human protein subcellular localization with integrated source and multi-label ensemble
classifier. Sci. Rep. 6, 28087 (2016).
37. Orre, L. M. et al. SubCellBarCode: Proteome-wide mapping of protein localization and relocalization. Mol. Cell 73, 166-182.e7
(2019).
38. Wan, S., Mak, M.-W. & Kung, S.-Y. mGOASVM: Multi-label protein subcellular localization based on gene ontology and support
vector machines. BMC Bioinform. 13, 290 (2012).
39. Bunkute, E. et al. PIP-DB: The protein isoelectric point database. Bioinformatics 31, 295–296 (2015).
40. Kozlowski, L. P. Proteome-pI: Proteome isoelectric point database. Nucleic Acids Res. 45, D1112–D1116 (2017).
41. Kozlowski, L. P. IPC—isoelectric point calculator. Biol. Direct 11, 55 (2016).
42. Kozlowski, L. P. Proteome-pI 2.0: proteome isoelectric point database update. Nucleic Acids Res. 50, D1535–D1540 (2022).
43. Su, B., Qian, Z., Li, T., Zhou, Y. & Wong, A. PlantMP: A database for moonlighting plant proteins. Database 2019, 2 (2019).
44. Brown, J. W. S., Shaw, P. J., Shaw, P. & Marshall, D. F. Arabidopsis nucleolar protein database (AtNoPDB). Nucleic Acids Res. 33,
D633–D636 (2005).
45. Na Ayutthaya, P. P., Lundberg, D., Weigel, D. & Li, L. Blue native polyacrylamide gel electrophoresis (BN-PAGE) for the analysis
of protein oligomers in plants. Curr. Protoc. Plant Biol. 5, e20107 (2020).
46. Lee, P. Y., Saraygord-Afshari, N. & Low, T. Y. The evolution of two-dimensional gel electrophoresis—from proteomics to emerging
alternative applications. J. Chromatogr. A 1615, 460763 (2020).
47. Toledo Silva, S. H., Bader-Mittermaier, S., Silva, L. B., Doer, G. & Eisner, P. Electrophoretic characterization, amino acid composi-
tion and solubility properties of Macauba (Acrocomia aculeata L.) kernel globulins. Food Biosci. 40, 100908 (2021).
Acknowledgements
Authors would like to extend their sincere thanks to The Research Council (TRC), Oman for supporting this
research under the grant number BFP/RGP/EBR/21/005. This work was also supported in part by the Basic Sci-
ence Research Program through the National Research Foundation of Korea (NRF) funded by the Ministry of
Education under Grant NRF-2019R1A2C1006159 and Grant NRF-2021R1A6A1A03039493, and in part by the
2021 Yeungnam University Research Grant.
Author contributions
T.K.M.: conceived the idea, collected and annotated the genome sequences, analyzed and interpreted the data,
drafted, and revised the manuscript. MSK, MO: analyzed and interpreted the data, drafted, and revised the
manuscript, designed and constructed the database. WA helped in database and interface design. GSC: revised
the manuscript, and arranged funding for publication.
Competing interests
The authors declare no competing interests.
Additional information
Supplementary Information The online version contains supplementary material available at https://doi.org/
10.1038/s41598-022-11077-z.
Correspondence and requests for materials should be addressed to T.K.M. or G.S.C.
Reprints and permissions information is available at www.nature.com/reprints.
Publisher’s note Springer Nature remains neutral with regard to jurisdictional claims in published maps and
institutional affiliations.
Open Access This article is licensed under a Creative Commons Attribution 4.0 International
License, which permits use, sharing, adaptation, distribution and reproduction in any medium or
format, as long as you give appropriate credit to the original author(s) and the source, provide a link to the
Creative Commons licence, and indicate if changes were made. The images or other third party material in this
article are included in the article’s Creative Commons licence, unless indicated otherwise in a credit line to the
material. If material is not included in the article’s Creative Commons licence and your intended use is not
permitted by statutory regulation or exceeds the permitted use, you will need to obtain permission directly from
the copyright holder. To view a copy of this licence, visit http://creativecommons.org/licenses/by/4.0/.
© The Author(s) 2022
Scientific Reports | (2022) 12:7421 | https://doi.org/10.1038/s41598-022-11077-z 7
Vol.:(0123456789)You can also read