POVERTY & SOCIAL P OLICY DISCUSSION PAPER
←
→
Page content transcription
If your browser does not render page correctly, please read the page content below
POVERTY & SOCIAL P OLICY DISCUSSION PAPER

 Evidence from Real-World Data from April to September 2021
 Elizabeth Ananata,b, Benjamin Glasnera, Christal Hamiltona, Zachary Parolina,c

 a
 Center on Poverty and Social Policy, Columbia University
 b
 Barnard College, Columbia University
 c
 Bocconi University

 Abstract
 Early studies have established that the expanded Child Tax Credit (CTC), which provides
 monthly cash payments to most families with children in the United States, has
 substantially reduced poverty and food hardship since its introduction in July 2021. Some
 researchers posit, however, that the CTC payments may generate negative employment
 effects that could offset its potential poverty-reduction effects. Scholars have simulated
 various employment scenarios using different assumed labor supply elasticities, but no
 study to date has empirically assessed how the CTC payments to date have affected
 employment outcomes using real-world data. To evaluate actual employment effects, we
 follow previously-established methodology used to estimate other actual CTC impacts,
 applying a series of difference-in-differences analyses using data from the monthly
 Current Population Survey files from April 2021 through August 2021 and the Census
 Household Pulse Survey microdata collected from April 14 through September 13, 2021.
 Across both samples and several model specifications, we find very small, inconsistently
 signed, and statistically insignificant impacts of the CTC both on employment in the prior
 week and on active participation in the labor force among adults living in households with
 children. Further, labor supply responses to the change in CTC do not differ for
 households previously earning within the phase-in range of the prior CTC, in striking
 contrast to the predictions of the simulation work. Thus, our analyses of real-world data
 do not support claims that the CTC has negative employment effects that offset its
 documented reductions in poverty and hardship.
Effects of the Expanded Child Tax Credit on Employment Outcomes

Introduction
In July 2021, most families with children in the United States (U.S.) began receiving monthly cash
payments of $300 per child under age six and $250 per child between the ages of 6 and 17. The first
monthly payment was distributed to families of 59.3 million children in July, while the second
payment reached 60.9 million children in August 2021 (U.S. Department of Treasury, 2021). Early
assessments of the expanded CTC payments suggest they have increased low-income families’
spending on food items (Perez-Lopez, 2021), have strongly reduced child poverty rates (Parolin,
Collyer, Curran, & Wimer, 2021), and have strongly reduced food insufficiency (Parolin, Ananat,
Collyer, Curran, & Wimer, 2021). Recent empirical research has not yet examined, however, the
expanded CTC’s initial effects on employment outcomes.

Economic theory predicts ambiguous effects of the expanded CTC on parental labor force
participation and employment. On one hand, the elimination of the phase-in portion of the
previous CTC raises incomes while lowering the return to work, which could reduce parental labor
force participation and employment. On the other hand, eliminating the phase-in, and therefore
providing cash to families that are not working, may provide credit-constrained parents with
resources to address barriers to employment, such as by allowing them to secure childcare or get
auto repairs, which could increase labor force participation and employment. Moreover, increased
aggregate demand as a result of higher incomes, particularly among populations such as low-
income families with children that have a high marginal propensity to consume, may have positive
macroeconomic effects that contribute to higher aggregate employment (Fisher, Johnson,
Smeeding, & Thompson, 2020).

In recent simulation work, scholars have modeled the potential employment effects of the CTC and,
in doing so, have reached varying conclusions. The National Academies of Sciences Engineering
and Medicine (2019) report on cutting child poverty in half suggests that a child allowance similar
to the reformed CTC might reduce employment by 150,000 workers. Focusing on the precise
parameters of the version of the monthly CTC passed into law, Goldin, Maag, and Michelmore
(2021) likewise estimate negligible employment responses. Corinth, Stadnicki, Meyer, and Wu
(2021), in contrast, estimate that the expanded CTC would lead 1.5 million working parents (2.6
percent of all working parents) to exit the labor force. The differences in the simulations, in short,
are driven by different assessments regarding the proper size of the employment elasticities and the
types of employment elasticities applied in the models.

This study diverges from the simulation approaches and related debates over the sizes of
employment elasticities, and instead builds on earlier work by empirically assessing the
employment effects of the expanded CTC using available data pre- and post-expansion.
Specifically, we apply a series of difference-in-differences analyses using data from the monthly
Current Population Survey files from April 2021 through August 2021, and the Census Household
Pulse Survey microdata collected from April 14, 2021 through September 13, 2021. In both datasets,
we leverage variation in policy eligibility between households with children and those without, as
well as variation in CTC payment amount received by households based on the ages of children,
number of children, and pre-reform income levels.
 2
Effects of the Expanded Child Tax Credit on Employment Outcomes

Across both samples and several model specifications, we find very small, statistically insignificant,
and inconsistently signed impacts of the CTC on employment in the prior week and on being active
in the labor force. Findings are similar when evaluating heterogeneous effects across income levels.
Of particular note, effects for families who earned less than $25,000 prior to the reform, and who
therefore face the largest decline in the return to work due to the elimination of the CTC phase-in,
are indistinguishable from the effects for higher-income families, in contrast to the predictions of
simulation work. These results are not consistent with claims that the expanded CTC has negative
employment effects that meaningfully offset its observed reductions in poverty and hardship
(Corinth et al., 2021). They are, instead, consistent with other real-world results showing declines in
poverty and food insufficiency in families with children as a result of the CTC expansion.

Policy Context
The Expanded Child Tax Credit

The expansion of the CTC represents a historic deviation from the direction of the U.S. welfare state
throughout the past three decades. Since the mid-1990s, the American welfare state has relied more
on in-kind transfers, including benefits from the Supplemental Nutrition Assistance Program
(SNAP), and work-conditional transfers, such as benefits from the Earned Income Tax Credit
(EITC), relative to cash-based income support (Bauer, Schanzenbach, & Shambaugh, 2018; Hoynes,
2019; Pac, Nam, Waldfogel, & Wimer, 2017). As a result, the share of children living in families with
very little cash income has grown (Shaefer & Edin, 2013). The lack of cash-based assistance and the
comparatively high rate of child poverty sets the U.S. apart from other high-income countries, most
of which have some form of child allowance (M Curran, 2015; Garfinkel, Harris, Waldfogel, &
Wimer, 2016; Shaefer et al., 2018).

Prior to the expanded CTC, tax filers could receive a maximum CTC of $2,000 per child per year,
but many children did not receive the full refundable amount. 1 The CTC credit phased in at a rate
of 15 cents per dollar of earnings, providing an effective wage subsidy but denying benefits to those
with low or no earnings. As a result, one in three children did not receive the full benefit value
because their families did not earn enough income to qualify. Children with single parents, those
in rural areas, Black and Latino children, and those in larger families were disproportionately
ineligible for the full credit (Collyer, Harris, & Wimer, 2019; Megan Curran & Collyer, 2020).

Following similar parameters to the American Family Act (a bill first introduced in both the Senate
and House of Representatives in 2017 and reintroduced in 2019), the American Rescue Plan (ARP)
temporarily transformed the CTC into a nearly-universal child allowance for 2021. 2 Specifically, the

1
 For additional information on the history of the Child Tax Credit, see Crandall-Hollick (2021), Crandall-Hollick
(2018), and Garfinkel et al. (2016).
2
 The expansion to the CTC in the ARP mirrors the proposed reforms in the American Family Act (AFA) with one
exception: in the AFA, the credit would begin to phase out for heads of household with earnings above $120,000
or and joint filers with Adjusted Gross Incomes (AGI) over $180,000. In the ARP, the credit begins to phase out for
families with AGIs above $112,500 or $150,000 per year, depending on filing status, but it only phases out until
 3
Effects of the Expanded Child Tax Credit on Employment Outcomes

ARP includes three fundamental changes to the CTC. First, it makes the CTC available to almost
all children—including those previously excluded due to their families’ low income—by removing
the earnings requirement and making the credit fully refundable. Second, it raises the maximum
annual credit amount to $3,000 for children ages 6–17 and $3,600 for children under age six. Third,
beginning mid-July 2021, the ARP delivers the credit in monthly installments of up to $250 per older
child or up to $300 per child under six years of age, for a period of six months. 3

Early research suggests the expanded CTC has generated large reductions in child poverty (Parolin,
Collyer, et al., 2021) and has reduced food insecurity among households with children (Parolin,
Ananat, et al., 2021). Additionally, recent studies evaluating similar child benefit programs in
Canada—the Canadian Universal Child Care Benefit (UCCB) and the Canada Child Benefit
(CCB)—found no evidence of a labor supply response (Baker, Messacar, & Stabile, 2021). To date,
however, it remains unclear whether the expanded CTC has causal effects on parents’ labor market
engagement. This study investigates the CTC’s impact by using nationally representative survey
data for the first two months post-CTC expansion to assess the impact of the CTC on adult
employment status and participation in the labor force.

Data and Methods
Data

This study uses data from the Current Population Survey (CPS) and the Census Household Pulse
Survey (Pulse). The CPS is a nationally representative monthly household survey conducted jointly
by the U.S. Census Bureau and the Bureau of Labor Statistics. As the primary source of employment
statistics for the US population, the CPS gathers data on labor force participation and demographics
in its basic monthly survey, as well as data on other dimensions of social and economic well-being
through various topic-oriented supplements. We use data from the April 2021 through August 2021
basic monthly surveys. We exclude the month of July, given that we cannot distinguish pre-
treatment versus post-treatment responses within July.

While the CPS provides rich information on the US labor force participation, due to the timing of
data release our analytical models are limited to only one month of post-policy data. We intend to
include additional CPS monthly data as they become available; however, to supplement our current
analyses we utilized data from the Pulse survey. The Pulse was introduced in April 2020 by the U.S.
Census Bureau to obtain up-to-date and nationally representative information on the social and
economic wellbeing of households across the U.S. Participants are randomly selected to participate
in the survey, which has been used to track trends in material hardship, subjective well-being, and
other social and economic indicators throughout the Covid-19 pandemic (Bauer et al., 2018; Bitler,
Hoynes, & Schanzenbach, 2020; Cai, Woolhandler, Himmelstein, & Gaffney, 2021; Morales,

matching the credit values that a family would receive under prior law. This alteration was made because the
Biden administration committed to not raising taxes for those with incomes below $400,000 per year.
3 Because the payments began halfway through the year, families will receive half of the full amount of their credit
in 2021 and the remainder when they file taxes in 2022.
 4
Effects of the Expanded Child Tax Credit on Employment Outcomes

Morales, & Beltran, 2020; Schanzenbach & Pitts, 2020; Twenge & Joiner, 2020; Ziliak, 2021). For this
study, we use data collected from April 14, 2021 through September 13, 2021 (Waves 28–37). The first
payment of the expanded CTC was delivered to recipients on July 15, 2021, which falls prior to the
beginning of Wave 34 of the Pulse (Wave 34 spans July 21 to August 2, 2021).

In Wave 34 of the Pulse, the U.S. Census Bureau altered the position of its employment question
within the survey, leading to different levels of item non-response for employment status relative
to prior waves. Given that the change in item non-response affects both our treatment and control
groups, it should not bias our findings. In particular, even if the change were to affect families with
children differently from childless families, one of our analytical strategies, discussed below,
identifies differences in the magnitude of the change in CTC benefit due to the expansion among
families with children. These differences are idiosyncratic functions of age and number of children
and family income, and do not correspond neatly to otherwise salient differences between families
that might drive differences in effects of the survey change. Thus, our robust approach of using
multiple difference-in-differences specifications allows us to produce credible estimates of the
CTC’s effects on employment within the Pulse, along with parallel estimates using the CPS, which
was unaffected by any such change.

Sample

Following the approach of Parolin, Ananat, et al. (2021), we limit our primary samples to adults
between the ages of 18–65 years old. The pooled CPS monthly data include 258,234 adults within this
age group. For our pooled Pulse data, we exclude adults residing in households that had imputed
values for the number of children in the household, as error in the imputed values could bias our
estimates. Our final Pulse primary analytical sample includes 375,676 adults. Of note, the results of
this analysis are robust to alternative age samples. When conducting analyses limiting to parental
ages of 18 to 30, 18 to 35, 18 to 40, 18 to 45, 18 to 50, 18 to 55, and 18 to 60 we find consistent results.

Measures

Outcomes
We investigate the impact of the CTC expansion on the extensive margin of the supply of labor
using both employment status, as measured by an indicator variable for employment at the time of
interview, and whether adults were members of the labor force in the week prior to their CPS
interview. The Pulse does not collect data on labor force participation, limiting our analyses of the
Pulse sample to only effects on employment status.
Receipt of the CTC

The Pulse includes its own question of whether anyone in the household received a CTC payment
under the American Rescue Plan (U.S. Department of Treasury, 2021), which we use to estimate
treatment-on-the-treated (TOT) effects in addition to intent-to-treat (ITT) effects based on the
presence of children. By contrast, the monthly CPS does not gather information on CTC receipt.
We therefore code a household as eligible for receiving CTC payments in the CPS if they had at
least one child present in the household, and we estimate only ITT effects in the CPS.
 5
Effects of the Expanded Child Tax Credit on Employment Outcomes

Income Subgroups
We also conduct subgroup analyses by pre-expansion household income. In the CPS, we define
subgroups using a categorical income variable that includes “money from jobs, net income from
business, farm or rent, pensions, dividends, interest, social security payments and any other money
income received” among family members in the prior year. In the Pulse, we use a similar categorical
income variable that includes “pre-tax income” from 2019 (waves 28 to 33) or 2020 (waves 34 onward).

Analytical Strategy

To assess the effect of the CTC on the labor market outcomes we employ difference-in-differences
models using the following equation:

 = 1 + 2 + 3 ( ∗ ) + 4 + (1)

where Yi is one of our two outcomes of interest (employment status; active in the labor force).
PostCTC is a binary indicator of whether the time of the survey was after July 15th, 2021, the date
when the expanded CTC was first administered. X is a vector of household head socioeconomic
characteristics—age, sex, and education status—and state fixed effects. 4

We specify our treatment variable, Treatment, in two separate ways, following Parolin, Ananat, et
al. (2021). First, we operationalize a binary treatment indicator that is equal to one if a household
had children and set to zero if no child was present in the household. Second, we estimate models
using a continuous measure of treatment intensity to capture the fact that the effects of the CTC are
likely to vary by the age of children (as families with children under age six receive larger monthly
benefit values), the number of children in the home, and the relative value of the new CTC benefits
compared to what the household likely received from the CTC prior to the reform. Because we do
not have information on pre-reform CTC receipt, we use data from the 2019 CPS to estimate the
mean pre- and post-reform benefit values for bins defined by the number of adults in the household
(ranging from 1 to 10), the number of children in the household (ranging from 0 to 10), and eight
categorical pre-tax income bins (from under $25,000 annually scaling up to more than $200,000 per
year). We compute the mean pre-reform refundable CTC benefits as observed for each family unit
in the CPS ASEC. We then simulate the additional post-reform benefits that each family is eligible
for (not yet taking into account imperfect coverage in benefit distribution) using detailed policy
rules from the CTC reform as specified in the 2021 American Rescue Plan. We subtract the pre-
reform benefit value from the post-reform benefit value to create a “net benefit” indicator for each
family unit. We then adjust the net benefit indicator for family size using the modified OECD
equivalence scale. 5 Finally, we calculate the weighted mean of the size-adjusted net benefit value

4 We have also included month fixed effects in this analysis and found no significant difference in the relationships
of interest. Note that in the case where month fixed effects are used, the PostCTC variable will be captured by the
month fixed effects. Alternative difference-in-differences methods will be explored in subsequent versions of this
paper.
5 The modified OECD scale begins with a value of 1 for a single adult, then adds 0.5 for each child in the home and
0.3 for each additional adult in the home. Alternative family-size adjustments include the square-root equivalence
scale or dividing by a family-size-adjusted poverty-threshold, such as that of the U.S. official poverty measure.
 6
Effects of the Expanded Child Tax Credit on Employment Outcomes

for each of the bins defined above. We then import this value into our 2021 CPS and Pulse data,
matching on the number of adults, number of children, and total family income of respondents. We
provide more details and descriptive statistics on the measure in Appendix B.

In each model, β3 is our primary coefficient of interest, as it identifies, when using the binary
treatment indicator, whether adults in households with children were more or less likely to be
engaged in the labor market relative to adults in childless households after the introduction of the
CTC changes; when using the continuous treatment, it represents the effect of eligibility for an
additional family-size-adjusted $100 per month in increased net benefits on labor market
engagement. Because we are unable to identify whether households actually received CTC
payments in the CPS, β3 in Equation (1) provides the intent-to-treat effect—the effect of the
treatment on the full treatment group, regardless of actual CTC receipt—of the CTC expansion for
this sample. In addition to estimating Equation (1) for the Pulse sample, we also utilize the
information on CTC receipt in the survey to provide estimates of the treatment effect on the treated,
or the local average treatment effect. To do so, we estimate two-stage least squares models (2SLS)
using the treatment group identifier as an instrumental variable and observed receipt of the
treatment as the endogenous variable. When applying our binary treatment measure, observed
receipt of the treatment reflects whether a family in the Pulse reports having actually received the
monthly CTC payment(s). When applying our continuous treatment indicator, the observed
treatment in the 2SLS model is a family’s projected net benefit increase from the CTC interacted
with their report of receipt. In other words, because levels of the benefit receipt of the CTC are not
directly measured in the Pulse, we apply our projected value of the net CTC benefit based on the
family’s income, number of children, and number of adults (as defined above) as the observed
treatment; however, we convert the projected benefit value to zero for families reporting that they
did not receive the CTC payment.

In addition to our main analytical specification, we also estimate effects separately for families in
different pre-period annual income bins, from less than $25,000 to over $200,000 in total family
income. These subgroup estimates allow us to test the fundamental prediction of prior simulation
work, namely that parental labor force participation and employment will decline (Corinth et al.,
2021). That work posits that the decline in the return to employment due to the elimination of the
phase-in will cause some parents to drop out of the labor force. Because the percentage drop in the
return to work is larger the lower the earnings of the parent, their simulations predict that the
lowest-income families will exhibit the largest reduction in employment after expansion of the
CTC. Evidence inconsistent with the lowest-income families responding differently from higher-
income families would thus represent prima facie evidence against the validity of the assumptions
driving recent simulations’ predictions that labor force decline will offset anti-poverty and anti-
material hardship effects of the CTC expansion (Corinth et al., 2021).

 7
Effects of the Expanded Child Tax Credit on Employment Outcomes

Findings
Descriptive Findings
Figure 1 shows the trend in employment and labor force participation from January 2021 to August
2021 using the monthly CPS. This window is in the middle of the COVID-19 pandemic, and begins
after the initial macro-level drop in employment and participation. Each point represents the
weighted average employment rate or the labor force participation rate separately by the presence
of children in the household.

Figure 1: Trends in Employment and Labor Force Participation by Presence of Child in
Household from January 2021 to August 2021, Current Population Survey

Note: This figure presents both the employment and labor force participation rates from the monthly CPS among
respondents between the ages of 18 and 65 from January 2021 to August 2021. These rates are split between childless
households and those with at least one child present in the household.

Figure 1 highlights the baseline difference in the labor market engagement between adults in
households with and without children, wherein adults in childless households tend to have lower

 8
Effects of the Expanded Child Tax Credit on Employment Outcomes

levels of employment and labor force participation throughout this sample window. Employment
and labor force participation increase among adults in both household types from January through
June 2021. For adults in households with children, employment continues to increase even after the
first CTC payment in July 2021.

Figure 2: Trends in Employment and Labor Force Participation by Presence of Child in
Household and Income Group from January 2021 to August 2021, Current Population Survey

Note: This figure presents both the employment and labor force participation rates from the monthly CPS among
respondents between the ages of 18 and 65 from January 2021 to August 2021. These rates are split between childless
households and those with at least one child present in the household, as well as three income groups, those with
household incomes less than $35,000, those with household incomes between $35,000 and $74,999, and those with
household incomes greater than or equal to $75,000.

Patterns are similar when evaluating differences by household income (Figure 2). Across three
income bins from $0 to $34,999, $35,000 to $74,999, and $75,000 or more, adults in households with
children are consistently more likely to be employed and participate in the labor market. In the
lower income bin, adults in households with children diverge from households without children
from January to March, but behave similarly after April. The middle income bin tends to behave
similarly across both household types from January to July. The highest household income bin
highlights the stability of both employment and labor force participation among individuals in
households with children, while individuals without children appear to be more volatile.
 9
Effects of the Expanded Child Tax Credit on Employment Outcomes

Estimation Results

Table 1 presents the results from difference-in-differences estimates on employment status and
labor force participation using data from the CPS sample. Columns 1 and 2 provide estimates from
models using our binary treatment measure, while Columns 3 and 4 provide estimates from our
continuous treatment measure as discussed above. Our results suggest that the CTC expansion had
no significant impact on employment outcomes.

Table 1: Difference-in-differences Estimates of the Effect of Expanded CTC on Employment
Outcomes (Current Population Survey, April 2021 through August 2021)

 Binary Treatment Continuous Treatment
 ($100s of Net Monthly Benefit Value)
 1: Employed 2: Active in Labor Force 3: Employed 4: Active in Labor Force

 Household with 0.043*** 0.036*** 0.007* 0.007**
 Children
 (0.004) (0.004) (0.003) (0.003)

 Post-July 15 0.010** 0.004 0.009** 0.003
 (0.004) (0.004) (0.003) (0.003)

 Household with -0.006 0.000 -0.001 0.003
 Children X
 Post-July 15 (0.006) (0.006) (0.004) (0.003)

 Pre-Treatment
 Mean among HH 0.728 0.769 0.728 0.769
 w/ Children

 Observations 258,234 258,234 257,155 257,155
Note: Sample: adults between ages 18-65. All models include state fixed effects and control for age, education, and
sex of household head. Robust standard errors in parentheses. * p < 0.05, ** p < 0.01, *** p < 0.001.

Specifically, estimated effects using the binary model of treatment show that relative to adults in
childless households, adults in households with children had a statistically insignificant 0.6
percentage point drop in employment (s.e.=0.6 percentage points) and 0.0 percentage point increase
in labor force participation (s.e.=0.6) after CTC expansion. Using the continuous treatment
measure—capturing variation based on pre-tax income and household size—we find that an
additional family-size-adjusted $100 in monthly CTC led to a statistically insignificant 0.1
percentage point reduction in employment (s.e.=0.4 percentage points) and a statistically
insignificant 0.3 percentage point increase in labor force participation (s.e.=0.3 percentage points).

 10
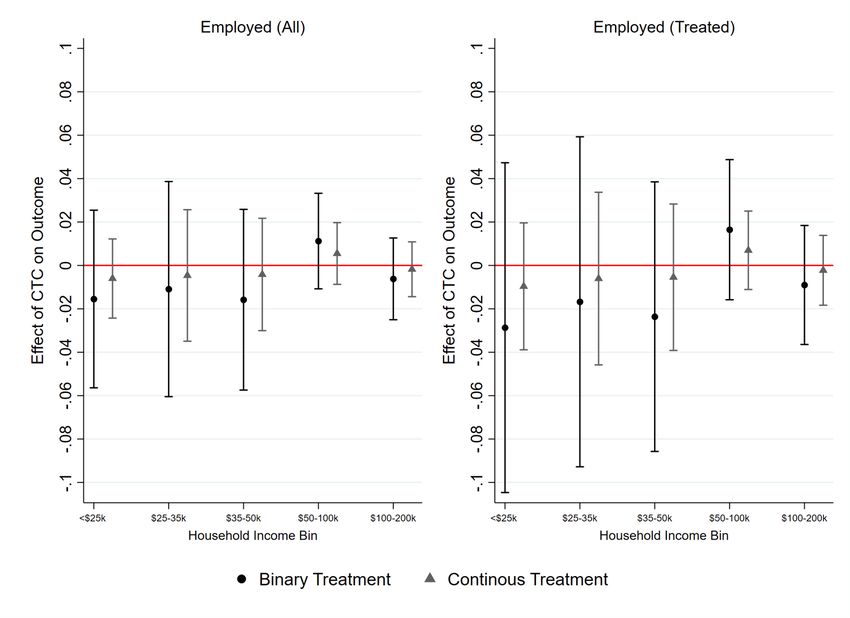
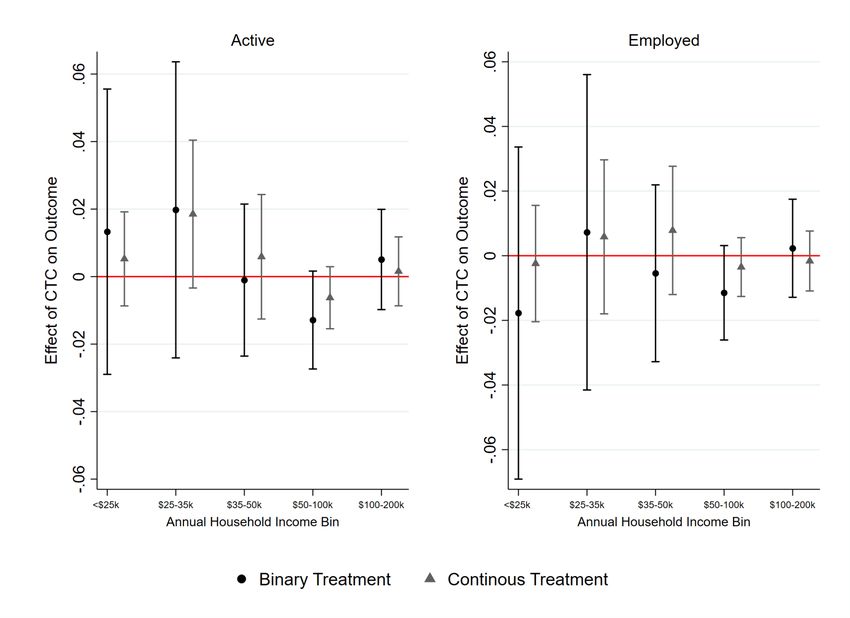
Effects of the Expanded Child Tax Credit on Employment Outcomes

Table 2: Difference-in-differences Estimates of the Effect of Expanded CTC on Employment
Outcomes (U.S. Census Household Pulse Survey, April 14 through September 13, 2021)

 Binary Treatment Continuous Treatment
 ($100s of Net Monthly Benefit Value)
 1: Employed 2: Employed 3: Employed 4: Employed
 (Intent to Treat) (Treatment on (Intent to Treat) (Treatment on
 Treated) Treated)

 Household with 0.006 0.006 -0.018*** -0.018***
 Children
 (0.004) (0.004) (0.003) (0.003)

 Post-July 15 -0.010* -0.010* -0.011* -0.011*
 (0.004) (0.004) (0.004) (0.004)

 Household with 0.002 0.003 0.000 0.000
 Children X
 Post-July 15 (0.007) (0.010) (0.005) (0.006)

 Pre-Treatment 0.701 0.701 0.701 0.701
 Mean among HH
 w/ Children

 Observations 375,676 375,676 326,543 326,543

Note: Sample: adults between ages 18-65. All models include state fixed effects and control for age, education, and
sex of household head. Robust standard errors in parentheses. * p < 0.05, ** p < 0.01, *** p < 0.001.

Table 2 displays the estimated effect of the CTC on being employed using data from the Pulse.
Again, we present estimated effects using our binary and continuous treatment measures. Due to
data limitations in the Pulse (which does not ask about labor force participation), Table 2’s estimates
are restricted to employment effects. Our analyses presented in Columns 1 and 3 estimate the effect
of the policy intending to treat (ITT) all households with children, regardless of whether they report
receiving the benefit. Columns 2 and 4 present the 2SLS estimates of the treatment effect on the
treated (TOT), using intent to treat as an instrument for actual treatment. Similar to analyses using
the CPS data, we find that CTC expansion had no statistically significant impacts on being
employed: the estimated change in employment ranges from 0.0 percentage points to +0.3
percentage points, with standard errors ranging from 0.5 to 1.0 percentage points.

Figures 3 and 4 visualize the effect of the CTC on employment outcomes across the income
distribution using the CPS and Pulse data respectively. Each point in Figures 3 and 4 represents the
coefficient from the interaction terms for our binary treatment (black circle) and continuous
treatment (gray triangle) when subsetting the sample to only include households with total incomes
under $25,000, then between $25,000 to $35,000, $35,000 to $50,000, $50,000 to $100,000, and
$100,000 to $200,000.
 11
Effects of the Expanded Child Tax Credit on Employment Outcomes

Figure 3: Heterogeneous effects by income bin (U.S. Current Population Survey)

Figure 3 and Figure 4 highlight the insignificant and inconsistently signed relationship between the
CTC expansion and employment at each point in the income distribution, using both data sets and
both the binary and continuous treatment measures. In the CPS, where we can also observe labor
force participation, we also find insignificant and inconsistently signed relationships between the
CTC expansion and engagement in the labor force at each point in the income distribution.
Notably, we find no significant differences between the effects of expansion on the lowest income
groups and higher income groups, nor do we find any evidence of a gradient in effects by income—
both of which would be predicted by the elasticity assumptions that drive Corinth et al.’s (2021)
predictions of labor force decline. In fact, in some cases estimates for the lowest income groups are
more positive than those for other groups.

 12
Effects of the Expanded Child Tax Credit on Employment Outcomes

Figure 4: Heterogeneous effects by income bin (U.S. Census Household Pulse Survey)

Note: Continuous treatment indicator represents the effect of a $100 net increase in monthly, size-adjusted benefit
value. “Treated” represents treatment effect (effect of CTC) on the treated (respondents reporting receipt of the CTC).

Discussion and Conclusion
The expansion of the Child Tax Credit in July 2021 into a more generous and inclusive monthly
payment represented a historic deviation from the direction of the U.S. welfare state throughout
the past three decades. Recent studies have shown that the CTC expansion has reduced poverty
rates (Parolin, Collyer, et al., 2021) and food insecurity (Parolin, Ananat, et al., 2021) among
households with children. Some researchers, however, suggest that the expansion may generate
negative employment effects. While recent simulation research has reached varying conclusions—
with some scholars finding negligible negative effects and others significant reductions in labor
force participation—no research to date has empirically evaluated the impact of the CTC expansion
on employment outcomes using real-world data.

This study uses nationally representative data from the April through August 2021 monthly CPS
and the April 14, 2021 through September 13, 2021 Census Household Pulse Survey microdata to
assess the effect of the expanded CTC on employment outcomes among adults ages 18–65. To
identify policy effects, we implemented a series of difference-in-differences models leveraging the
variation in policy eligibility and the structure of CTC payment amounts. In addition to our main
analytical specification, we also estimated effects separately for families in different pre-period
 13
Effects of the Expanded Child Tax Credit on Employment Outcomes

annual income bins, from less than $25,000 to $100,000-$200,000 in total pre-period family income.
 Our analyses reveal that the CTC expansion has had no meaningful impact on employment and
labor force participation. Among adults in the CPS sample, we find statistically insignificant
decreases in employment and statistically insignificant increases in labor force participation. Using
the Pulse data, in which we are able to observe a longer post-treatment period, we find a statistically
insignificant increase in employment among adults in eligible households in the two months
following the CTC expansion; moreover, this pattern holds when incorporating Pulse data on actual
receipt among eligible households.

Results from analyses exploring heterogeneity across income groups also reveal that the CTC
expansion has had no significant effect on employment and labor force participation for any income
group. Of note, we find no significant differences in policy effects between the lowest income groups
and higher income groups, or any evidence of a gradient in effects by income. Evidence inconsistent
with the lowest-income families responding differently from higher-income families represents
prima facie evidence against the validity of the assumptions driving recent simulations’ prediction
that labor force decline will offset anti-poverty and anti-material hardship effects of the CTC
expansion (Corinth et al., 2021).

Thus, we conclude that real-world data in the immediate wake of the CTC expansion do not support
claims that the elimination of the phase-in portion of the CTC has discouraged work among parents
in any meaningful way, much less that such effects are large enough to offset decreases in poverty
and material hardship driven by the expansion’s increased generosity and inclusivity. Our results
are, instead, consistent with other real-world analyses of the expansion’s effects, which show
dramatic observed declines in child poverty (Parolin, Collyer, et al., 2021) and strongly reduced food
insufficiency (Parolin, Ananat, et al., 2021). Our results suggest that the mechanism through which
these reductions have occurred is that the increase in income both intended and accomplished
through the expansion, combined with a lack of unintended effects on parental work, have led to
improved well-being for families with children.

We will update our analyses in future months as more data become available (in the CPS and, if it
is extended, in the Pulse). Moreover, if the expanded CTC payments expire after December 2021 (as
planned in current law), we will analyze the effects of their removal using parallel analysis.

Suggested Citation
Ananat, Elizabeth, Benjamin Glasner, Christal Hamilton, and Zachary Parolin. 2021. "Effects of the
Expanded Child Tax Credit on Employment Outcome: Evidence from Real-World Data from
April to September 2021." Poverty and Social Policy Discussion Paper. Center on Poverty and
Social Policy, Columbia University. Access at:
povertycenter.columbia.edu/publication/2021/expanded-child-tax-credit-impact-on-employment

Acknowledgements
The authors appreciate helpful feedback from Sophie Collyer, Megan A. Curran, Irwin Garfinkel,
Robert Paul Hartley, Jane Waldfogel, and Christopher Wimer. This brief is made possible with
the support of the The JPB Foundation and the Annie E. Casey Foundation.
 14
Effects of the Expanded Child Tax Credit on Employment Outcomes

 References

Baker, M., Messacar, D., & Stabile, M. (2021). The Effects of Child Tax Benefits on Poverty and Labor
 Supply: Evidence from the Canada Child Benefit and Universal Child Care Benefit (No.
 w28556). National Bureau of Economic Research.

Bauer, L., Schanzenbach, D. W., & Shambaugh, J. (2018). Work requirements and safety net
 programs. The Hamilton Project.

Bitler, M., Hoynes, H. W., & Schanzenbach, D. W. (2020). The social safety net in the wake of
 COVID-19 (No. w27796). National Bureau of Economic Research.

Cai, C., Woolhandler, S., Himmelstein, D. U., & Gaffney, A. (2021). Trends in Anxiety and
 Depression Symptoms During the COVID-19 Pandemic: Results from the US Census
 Bureau’s Household Pulse Survey. Journal of General Internal Medicine, 36(6), 1841-1843.

Collyer, S., Harris, D., & Wimer, C. (2019). Left behind: The one-third of children in families who
 earn too little to get the full Child Tax Credit. Poverty & Social Policy Brief, 3(6).

Corinth, K., Stadnicki, M., Meyer, B. D., & Wu, D. (2021). The anti-poverty, targeting, and labor
 supply effects of the proposed Child Tax Credit expansion University of Chicago, Becker
 Friedman Institute for Economics Working Paper, No. 2021-115.

Crandall-Hollick, M. L. (2018). The Child Tax Credit: Current Law. CRS Report R41873. Washington,
 DC: Congressional Research Service

Crandall-Hollick, M. L. (2021). The Child Tax Credit: Proposed Expansion in the American Rescue Plan
 Act of 2021 (ARPA; H.R. 1319). CRS Report IN11613. Washington, DC: Congressional Research
 Service

Curran, M. (2015). Catching up on the cost of raising children: Creating an American child
 allowance. In Big Ideas: Pioneering Change, Innovative Ideas for Children and Families.
 Washington DC: First Focus.

Curran, M., & Collyer, S. (2020). Children left behind in larger families: The uneven receipt of the
 federal Child Tax Credit by children’s family size. Poverty & Social Policy Brief, 4(4). Retrieved
 from https://www.povertycenter.columbia.edu/s/Child-Tax-Credit-Larger-Families-CPSP-
 2020.pdf

Fisher, J. D., Johnson, D. S., Smeeding, T. M., & Thompson, J. P. (2020). Estimating the marginal
 propensity to consume using the distributions of income, consumption, and wealth. Journal
 of Macroeconomics, 65, 103218.

Garfinkel, I., Harris, D., Waldfogel, J., & Wimer, C. (2016). Doing more for our children: Modeling a
 universal child allowance or more generous child tax credit. New York: The Century Foundation.

Goldin, J., Maag, E., & Michelmore, K. (2021). Estimating the Net Fiscal Cost of a Child Tax Credit
 Expansion. NBER Chapters.

Hoynes, H. (2019). The earned income tax credit. The Annals of the American Academy of Political and
 Social Science, 686(1), 180-203.
 15
Effects of the Expanded Child Tax Credit on Employment Outcomes

Morales, D. X., Morales, S. A., & Beltran, T. F. (2020). Racial/ethnic disparities in household food
 insecurity during the COVID-19 pandemic: a nationally representative study. Journal of
 Racial and Ethnic Health Disparities, 1-15.

National Academies of Sciences Engineering and Medicine. (2019). A roadmap to reducing child
 poverty. Washington, DC: National Academies Press

Pac, J., Nam, J., Waldfogel, J., & Wimer, C. (2017). Young child poverty in the United States:
 Analyzing trends in poverty and the role of anti-poverty programs using the Supplemental
 Poverty Measure. Children and youth services review, 74, 35-49.

Parolin, Z., Ananat, E., Collyer, S. M., Curran, M., & Wimer, C. (2021). The Initial Effects of the
 Expanded Child Tax Credit on Material Hardship (No. w29285). National Bureau of Economic
 Research.

Parolin, Z., Collyer, S., Curran, M., & Wimer, C. (2021). Monthly Poverty Rates among Children after
 the Expansion of the Child Tax Credit. Poverty & Social Policy Brief 5(4).

Perez-Lopez, D. (2021). Economic hardship declined in households with children as Child Tax Credit
 payments arrived. U.S. Census Bureau Retrieved from
 https://www.census.gov/library/stories/2021/08/economic-hardship-declined-in-households-
 with-children-as-child-tax-credit-payments-arrived.html

Schanzenbach, D., & Pitts, A. (2020). Food insecurity in the census household pulse survey data
 tables. Institute for Policy Research, 1-15.

Shaefer, H. L., Collyer, S., Duncan, G., Edin, K., Garfinkel, I., Harris, D., . . . Yoshikawa, H. (2018). A
 universal child allowance: A plan to reduce poverty and income instability among children
 in the United States. RSF: The Russell Sage Foundation Journal of the Social Sciences, 4(2), 22-42.

Shaefer, H. L., & Edin, K. (2013). Rising extreme poverty in the United States and the response of
 federal means-tested transfer programs. Social Service Review, 87(2), 250-268.

Twenge, J. M., & Joiner, T. E. (2020). US Census Bureau‐assessed prevalence of anxiety and
 depressive symptoms in 2019 and during the 2020 COVID‐19 pandemic. Depression and
 Anxiety, 37(10), 954-956.

U.S. Department of Treasury. (2021). Treasury and IRS announce families of nearly 60 million
 children receive $15 billion in first payments of expanded and newly advanceable Child Tax
 Credit [Press release]. Retrieved from https://home.treasury.gov/news/press-
 releases/Treasury-and-IRS-Announce-Families-of-Nearly-60-Million-Children-Receive-
 %2415-Billion-Dollars-in-First-Payments-of-Expanded-and-Newly-Advanceable-Child-Tax-
 Credit

Ziliak, J. P. (2021). Food hardship during the COVID‐19 pandemic and Great Recession. Applied
 Economic Perspectives and Policy, 43(1), 132-152.

 16
Effects of the Expanded Child Tax Credit on Employment Outcomes

Appendices

Appendix A: Descriptive Statistics

Table A1: Descriptive Statistics for Analytical Samples

 CPS Pulse

 Mean St. Dev. Mean St. Dev.

 Employment rate 0.746 0.435 0.795 0.404

 Labor force participation rate 0.781 0.413 - -

 Age 36.28 10.47 35.98 6.42

 Percent female 0.508 0.5 0.628 0.483

 Family size 3.17 1.63 3.21 1.56

 Number of children 0.918 1.22 1.10 1.23

Note: Sample: adults between ages 18-65.

 17
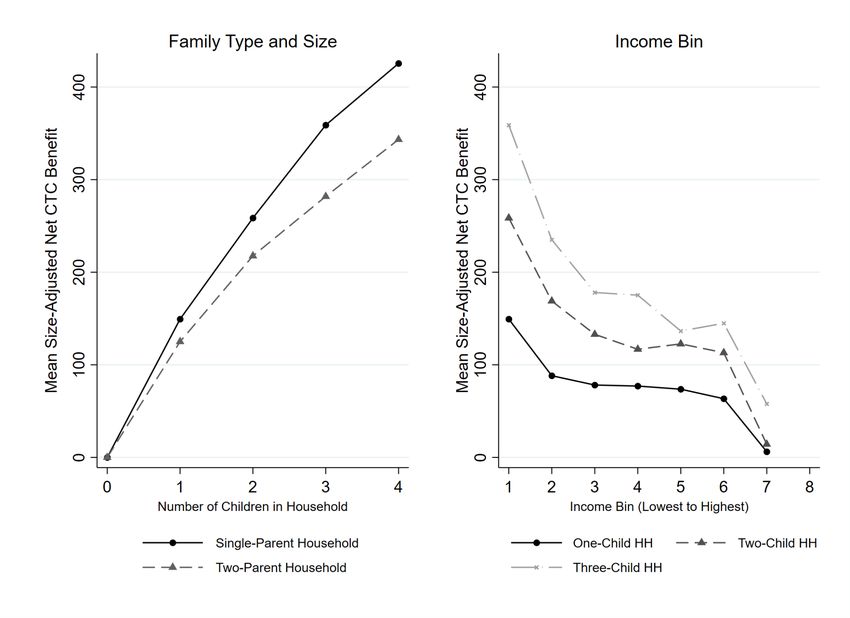
Effects of the Expanded Child Tax Credit on Employment Outcomes

Appendix B: Continuous Indicator of Treatment Intensity

Our continuous indicator of treatment intensity captures variation in expanded CTC benefits based
on age of the children, the number of children in the home, and the relative value of the new CTC
benefits compared to what the family likely earned from the existing CTC prior to the reform. We
use data from the 2019 U.S. Current Population Survey to estimate the mean pre- and post-reform
benefit values for bins defined by the number of adults in the household (ranging from 1 to 10), the
number of children in the household (ranging from 0 to 10), and eight categorical income bins (from
under $25,000 annually scaling up to more than $200,000 per year). We then import this value into
the monthly CPS and Pulse files, matching on the number of adults, number of children, and
income bin. Below, we visualize the mean size-adjusted net CTC benefits by income bin and family
size.

Figure B1: Mean size-adjusted net CTC benefits per month by number of children in
household and family type (left) and net adjusted gain post-expansion among households
by income (right)

 18
You can also read