2019 PRE-ELECTION REPORT Information for voters and potential candidates He kōrero mā ngā kaipōti me ngā kaitono pōti - Knowledge Auckland

Page created by Dan Rios
 
CONTINUE READING
2019 PRE-ELECTION REPORT Information for voters and potential candidates He kōrero mā ngā kaipōti me ngā kaitono pōti - Knowledge Auckland
HE PŪRONGO I MUA I NGĀ PŌTI

PRE-ELECTION REPORT
He kōrero mā ngā kaipōti me ngā kaitono pōti
Information for voters and potential candidates

Local Elections

2019
2019 PRE-ELECTION REPORT Information for voters and potential candidates He kōrero mā ngā kaipōti me ngā kaitono pōti - Knowledge Auckland
NGĀ IHIRANGI
CONTENTS
                              Message from the Chief Executive ................................................................................................. 		 3

                              How do we keep Auckland moving? .............................................................................................. 		 4

                              Housing – How do we keep pace with demand? ........................................................................ 		 6

                              How do we support thriving, inclusive and resilient communities? ........................................ 		 8

                              How do we enhance Māori identity and wellbeing? ................................................................... 		11

                              How should we invest in facilities to support our communities? ............................................ 		12

                              How do we protect our natural environment? ............................................................................ 		14

                              How do we respond to climate change? ....................................................................................... 		16

                              How do we pay for it? ....................................................................................................................... 		18

                              Major projects ..................................................................................................................................... 		20

                              Financial Overview............................................................................................................................... 		22

2   |   PRE-ELECTION REPORT
2019 PRE-ELECTION REPORT Information for voters and potential candidates He kōrero mā ngā kaipōti me ngā kaitono pōti - Knowledge Auckland
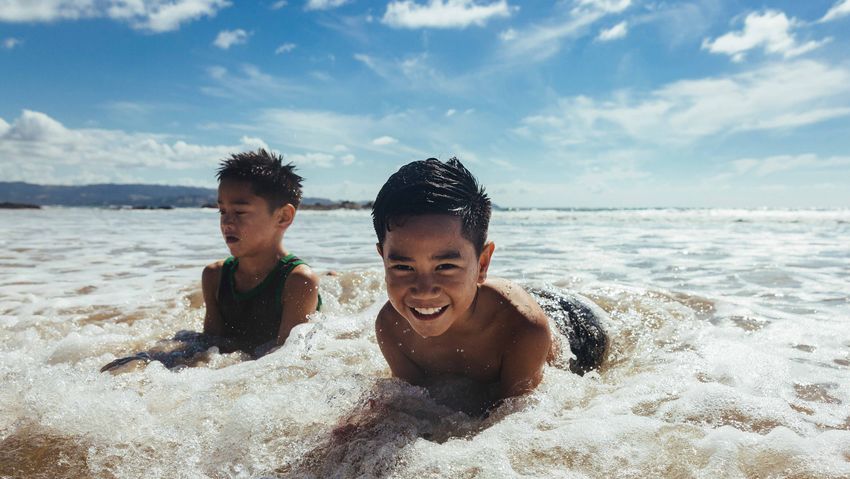
HE KARERE NĀ TE TUMU WHAKARAE
MESSAGE FROM THE CHIEF EXECUTIVE
Auckland is home to around 1.7 million people and our numbers are growing at a significant rate.
By 2028, it is expected around two million people will call Auckland home.

                                                                  Transport is an issue that we know Aucklanders care about            The introduction of the natural environment and water
                                                                  strongly. We’ve already made huge strides in improving our           quality targeted rates are helping to address the issues
                                                                  transport network and it’s important we continue to focus on         with our natural environment. Through these rates we’re
                                                                  this area. In July 2018 we introduced the Regional Fuel Tax to       financing the improvement in the quality of our waterways,
                                                                  support further improvements to our roads, public transport,         tackling the spread of Kauri dieback and assisting in our bid
                                                                  walking and cycleways. We’ve also invested in delivering             to make Auckland pest free by 2050. Climate change also
                                                                  the City Rail Link, which doubles our rail capacity and deals        poses a huge threat to our environment, and ultimately the
                                                                  with the growth in the number of people travelling around            way of life for all Aucklanders. The declaration of Auckland’s
                                                                  Auckland on a daily basis.                                           climate change emergency has further brought into focus
                                                                                                                                       the urgent need to address climate change at a local level.
                                                                  With a global economic environment of rising construction            Climate change adaption will be a significant feature of the
                                                                  costs, we’re always checking in on these major projects to           10-year budget 2021-2031.
                                                                  ensure we’re still getting value for money.
                                                                                                                                       Our work requires investment, and while not all costs fall
                                                                  And it’s not just about the city centre – transport infrastructure   exclusively to Auckland Council, maintaining our current
                                                                  is also a vital part of unlocking our town centres, and ensuring     services, procuring and developing new services, driving
While the increase in size and density will have some positive    our communities have good transport links. We need to
economic effects, stimulate innovation and boost our diversity,                                                                        efficiencies, managing our debt, generating income, while
                                                                  support vibrant communities with a more diverse housing              keeping rate increases to an acceptable level, is a significant
the unprecedented pace of our region’s population growth          stock, ensuring more Aucklanders can benefit from the social
also presents us with a number of challenges. This means,                                                                              challenge. We all want to live in an Auckland that can be
                                                                  and economic prosperity our growth brings.                           enjoyed by us, our children and our grandchildren.
following the October local elections, our newly elected
mayor, councillors and local board members will have to make      To become a truly world class city our growth must be more           Stephen Town
some tough decisions about the prioritisation of our funding      inclusive. Prosperity and opportunity must be shared. Our            Chief Executive
and resources.                                                    Tiriti o Waitangi Partner – Māori – must thrive. The diverse
                                                                  populations of Tāmaki Makarau must thrive too.

3   |   PRE-ELECTION REPORT
2019 PRE-ELECTION REPORT Information for voters and potential candidates He kōrero mā ngā kaipōti me ngā kaitono pōti - Knowledge Auckland
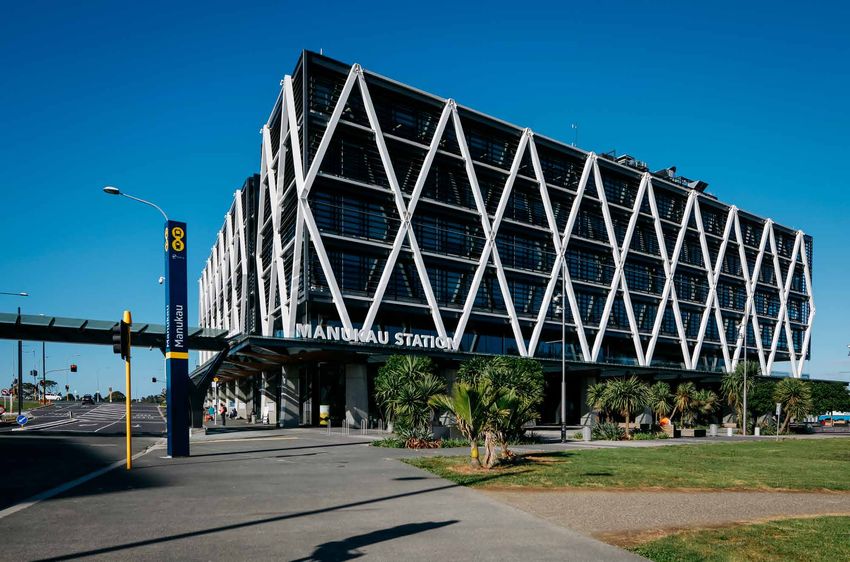
ME AHA TĀTOU E NEKE WHAKAMUA TONU AI A TĀMAKI MAKAURAU?
                HOW DO WE KEEP AUCKLAND MOVING?
We accelerate the changes in our transport network to make our city safer and easier to move around.

                                                                                                       Auckland is a city dominated by cars, but things are changing.
                                                                                                       Over the last year, Aucklanders made more than 100 million
                                                                                                       public transport journeys and 3.67 million bike trips.

                                                                                                       Despite this, death and serious injury on our roads is too
                                                                                                       common, and traffic congestion is an ongoing problem.

                                                                                                       In response, we’ve already pledged to invest over $12 billion in
                                                                                                       transport infrastructure over 10 years, made possible in part by
                                                                                                       the Regional Fuel Tax that was introduced on 1 July 2018.

                                                                                                       This will build on current activity. Park and ride facilities are
                                                                                                       now available at several bus and ferry terminals with more
                                                                                                       expected. The new transport interchange under construction at
                                                                                                       Puhinui Station will connect rail and buses to Auckland Airport,
                                                                                                       and the roll out of double decker buses will continue.

                                                                                                       The construction of the City Rail Link is underway and will more
                                                                                                       than double the capacity of our rail network and significantly
                                                                                                       reduce journey times. Road improvements throughout the
                                                                                                       region are also ongoing.

                                                                                                       Future choices may need to be made beyond this investment.
                                                                                                       These could include how greater use of public transport is
                                                                                                       encouraged, how roads can be adapted for bus and cycle lanes,
                                                                                                       whether congestion charging or road tolls should be introduced
                                                                                                       and how smarter use of technology could improve traffic flow.

4   |   PRE-ELECTION REPORT
2019 PRE-ELECTION REPORT Information for voters and potential candidates He kōrero mā ngā kaipōti me ngā kaitono pōti - Knowledge Auckland
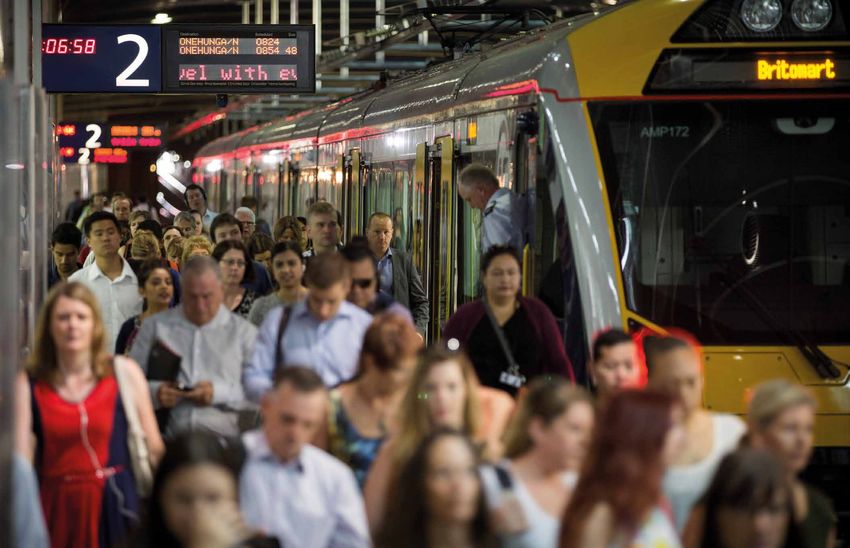
TRANSPORT BY NUMBERS

        7452km                7137km             41            21           15              10            818
         of roads             of footpaths   rail stations   wharves   bus and busway   multi-storey   pay by plate
                                                                           stations      car park         units
                                                                                         buildings

5   |   PRE-ELECTION REPORT
2019 PRE-ELECTION REPORT Information for voters and potential candidates He kōrero mā ngā kaipōti me ngā kaitono pōti - Knowledge Auckland
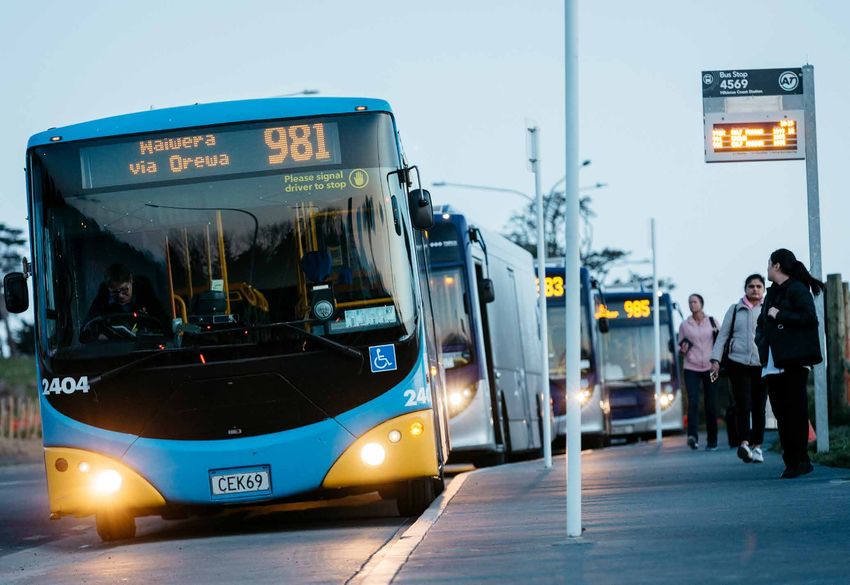
NGĀ TAKE Ā-WHARE - ME AHA E ŌRITE AI Ā TĀTOU MAHI KI TĀ TĒRĀ E HIAHIATIA ANA?
                HOUSING – HOW DO WE KEEP PACE WITH DEMAND?
We enable healthy houses to be built, supporting the development of existing town centres.

                                                                                     Auckland’s rapid population increase places pressure on existing housing, and housing supply
                                                                                     has not kept pace with demand. The estimated shortfall is 45,000 dwellings. We do not
                                                                                     build houses ourselves but play our part through planning, consenting and the delivery of
                                                                                     supporting infrastructure.

                                                                                     Through the Unitary Plan, an additional one million homes have been enabled in existing residential
                                                                                     areas, and a further 15,000 hectares of future urban land has been earmarked to support another
                                                                                     137,000 homes.

                                                                                     Intensification of existing urban areas has been identified as the most efficient approach as this
                                                                                     optimises existing infrastructure. And, by increasing housing around transport corridors and town
                                                                                     centres, Aucklanders will have more transport options and employment opportunities, which also
                                                                                     has environmental, economic and social benefits.

                                                                                     Our biggest challenge is providing the infrastructure, such as water, wastewater, stormwater and
                                                                                     transport, in a way that offers value for money for current and future ratepayers. New financing and
                                                                                     funding tools are needed to give council more flexibility to meet these growth demands.

                                                                                     Collaborating with the Crown to find new ways to pay for the infrastructure needed for new homes
                                                                                     in Auckland, advocating for national legislative improvements to deliver more quality homes more
                                                                                     quickly and continuing to improve our regulatory and compliance process to speed up the delivery
                                                                                     of consents, could be options to explore.

6   |   PRE-ELECTION REPORT
2019 PRE-ELECTION REPORT Information for voters and potential candidates He kōrero mā ngā kaipōti me ngā kaitono pōti - Knowledge Auckland
HOUSING BY NUMBERS

        4 out of                313,000                2.4              13,874
        every 10              dwellings needed   million residents   new dwellings
     Kiwis will live in         in the next           by 2048        were consented
    Auckland by 2048             30 years                            in the last year

7   |   PRE-ELECTION REPORT
ME PĒHEA TĀTOU E TAUTOKO AI I TE HAPORI TAURIKURA, MANAHAU ME TE MANAWAROA?
                HOW DO WE SUPPORT THRIVING,
                INCLUSIVE AND RESILIENT COMMUNITIES?
We want to ensure that all Aucklanders are valued, can participate, connect and feel they belong.
                                                                                                    Auckland is experiencing increasing diversity and inequality.
                                                                                                    This presents challenges and opportunities for the way we
                                                                                                    work with communities.

                                                                                                    We want to ensure that all communities and groups who call
                                                                                                    Auckland home feel a sense of belonging and are given the
                                                                                                    chance to develop their own, and in turn, our region’s potential.

                                                                                                    We support organisations to deliver arts, cultural activities
                                                                                                    and events that encourage interaction between different
                                                                                                    communities and help build local identity and pride. We work
                                                                                                    with community groups to provide local facilities and services.
                                                                                                    And, we reach out to our diverse, and often minority groups,
                                                                                                    to encourage participation in our decision-making process
                                                                                                    through membership of panels and advisory boards.

                                                                                                    We enable and embrace, but should we do more?

                                                                                                    Many Aucklanders are prosperous and have good living
                                                                                                    standards, yet we still have significant levels of socio-economic
                                                                                                    deprivation, often concentrated in geographic areas. Income,
                                                                                                    employment, health and education outcomes are different
                                                                                                    in various parts of Auckland, and there are distinct patterns
                                                                                                    across broad ethnic and age groups. We need to ensure that
                                                                                                    future services, at both regional and local level, respond to the
                                                                                                    evolving needs of our communities.

8   |   PRE-ELECTION REPORT
AUCKLAND
    Auckland is a dynamic and attractive place to
    live. Its people are diverse in age, lifestyle, culture
    and community.

    • Māori                       • Urban residents
    • Pasifika                    • Rural residents
    • Ethnic Communities          • Faith based
    • Children and Youth          • Diversity in languages     Built along the Te Auaunga Awa (Oakley Creek walkway), this new
                                                               playground in Mt Roskill brings together a collection of ancient
    • Older Aucklanders           • New and
                                                               Māori play artefacts into a single space to create a traditional
    • Disabled                      established migrants
                                                               Māori playground.
    • LGBTI

    Auckland Council has a role in
    fostering a strong, inclusive and
    equitable society.
    We do this by providing opportunities for all people
    to meet, interact and build relationships through our
    community services and facilities, parks and open space,
    and arts and cultural activities.

9    |   PRE-ELECTION REPORT
DIVERSITY IS OUR STRENGTH

                           Our diversity delivers many benefits to the city                                                       Auckland has                               Tamariki Māori
                                                                                                                                  180                     175
                                                                                                                                                                             More than
                                                                                                                                  ethnicities       and
                                                                                                                                                    languages                50%
                                                                                                                                                                             speak some
                                                                                                                                                                             Te Reo
                                                                                                                                                                             in the home.
                                                                                                                                                                             Whānau with young
       Promotes                            Attracts talent,             Increases global                 Helps us compete                                                    tamariki have identified
                                                                                                                                                                             that access to Te Reo
   a culturally rich,                       tourists and                 awareness and                   on an international                                                 and tikanga Māori is
                                                                                                                                                                             important to them.
 vibrant, exciting city                    entrepreneurs                   tolerance                            stage
                                                                                                                                             Inequitable outcomes between
       65%                          AUCKLAND                                    Changes in age distribution                                      Māori and non-Māori
           of Auckland’s
           population
                                     IN 2036                            Children and young
                                                                        people represent                    11.5%                      Māori are more likely to experience disparities in:
                                 Māori, Asian and Pacific                                                   of Auckland’s
                                                                        1/3
           in 2036.
                                                                                                            population are
                               ethnic populations are growing at a      of Auckland’s                       residents 65+
  This proportion was        higher than average rate, which means      population
                             that their share of the total population
 49%            in 2013            will increase in most areas.                   Both numbers are expected to continue growing   injuries and         housing and              severe child            education
                                                                                                                                    disease             residential               poverty               outcomes
                             13%       of the population
                                       from 11% in 2013
                                                            Māori                                                                                        mobility

                             18%                                                    LGBTI
                                       of the population
                                       from 15% in 2013
                                                            Pacific
                                                                                                                                                              Disability
                                                                                 Auckland region has the largest                  One in five Aucklanders was
                             34%        of the population Asian
                                        from 23% in 2013
                                                                               Rainbow population in New Zealand.                 identified as disabled in the
                                                                          Nearly 45%                   nearly        33%            2013 Disability survey.
                             47%        of the population European
                                        from 59% in 2013  or other
                                                                          of gay men and         of female same sex couples in
                                                                                                 New Zealand live in Auckland
                                                                                                                                        People aged 65+ were more likely to experience some form of disability.
                                                                                                                                           Māori and Pacific people had higher than average disability rates.

10 |   PRE-ELECTION REPORT
ME PĒHEA TĀTOU E HIKI AI I TE TUAKIRI ME TE ORANGA O TE IWI MĀORI?
               HOW DO WE ENHANCE MĀORI IDENTITY AND WELLBEING?
Maori identity is our unique point of difference in Tāmaki Makaurau. We want strong and vibrant
Māori communities that thrive, socially, culturally, economically and environmentally.

                                                                                                  Auckland Council is strongly committed to recognising
                                                                                                  Te Tiriti o Waitangi. Our region’s cultural roots provide a
                                                                                                  strong foundation for our intercultural society by providing
                                                                                                  opportunities for all Aucklanders to understand and engage in
                                                                                                  Māori culture and language, local Māori history, perspective
                                                                                                  and values. Our region is home to the country’s largest Māori
                                                                                                  population, and mana whenua retain cultural traditions and
                                                                                                  heritage that make Auckland unique.

                                                                                                  We focus on building relationships with mana whenua and
                                                                                                  mataawaka to help build strong Māori communities. Auckland
                                                                                                  Council’s co-governance model means working in partnership.
                                                                                                  We are a partner in several co-governance arrangements with
                                                                                                  iwi and have an important relationship with the Independent
                                                                                                  Māori Statutory Board.

                                                                                                  From frameworks developed to improve council services to
                                                                                                  Māori and public artworks that celebrate stories and history
                                                                                                  across Tāmaki Makaurau, opportunities are many. We now
                                                                                                  need to work together to successfully deliver on agreed
                                                                                                  priorities that will contribute to, and promote, Māori identity
                                                                                                  and wellbeing.

11 |   PRE-ELECTION REPORT
ME PĒHEA TĀ TĀTOU HAUMI KI NGĀ WHAKAURUNGA HEI TAUTOKO I Ō TĀTOU HAPORI?
              HOW SHOULD WE INVEST IN FACILITIES
              TO SUPPORT OUR COMMUNITIES?
We need to respond to the changing needs of Aucklanders, ensuring our facilities are safe and well maintained.

                                                                                                                 We know the importance of providing a place for communities
                                                                                                                 to meet, have access to books and internet, as well as
                                                                                                                 encouraging general health and fitness at our leisure facilities.
                                                                                                                 Our first challenge is to evolve our services to ensure they are
                                                                                                                 relevant to our diverse and changing communities. Secondly,
                                                                                                                 we need to balance ongoing development and maintenance
                                                                                                                 costs alongside ‘big-ticket’ issues such as weathertightness and
                                                                                                                 seismic strength.

                                                                                                                 Funding of $961 million has been allocated from now until
                                                                                                                 2028 for refurbishing our current facilities and we will prioritise
                                                                                                                 this spending to those buildings and communities that need
                                                                                                                 it most. However, simply to maintain all existing assets to an
                                                                                                                 acceptable standard would require an additional $750 million.
                                                                                                                 Future planning for our spaces and places requires innovative
                                                                                                                 thinking around ownership, design, partnership and operation.

                                                                                                                 We will continue to encourage communities across the region
                                                                                                                 to participate in the decisions we need to make in their area
                                                                                                                 as we resolve what to fund and where. The challenge will be
                                                                                                                 making trade-offs between rebuilding our old facilities and
                                                                                                                 investing in new facilities that better meet our communities’
                                                                                                                 needs now and into the future.

12 |   PRE-ELECTION REPORT
COMMUNITY FACILITIES

            32                   3575                 190                54
       regional parks          local parks        sports parks       cemeteries

                                                                                      The newly-opened multipurpose facility, Te Manawa, is the first of its
                                                                                      kind in Auckland – both a community hub and library built for the city
            55                    191                 42                 40           of the future and generations to come.

         libraries           community halls     recreational        art facilities
                                /centres       /aquatic facilities

13 |   PRE-ELECTION REPORT
ME PĒHEA TĀTOU E TIAKI AI I TŌ TĀTOU TAIAO TAKETAKE?
               HOW DO WE PROTECT OUR NATURAL ENVIRONMENT?
We invest in programmes and practices that safeguard our environment.

                                                                        Looking after the environment is a key component of planning
                                                                        for our future. As a council, our role is to nurture, look after and
                                                                        monitor our environment and we are working hard to protect our
                                                                        region from a variety of threats – both natural and manmade.

                                                                        The introduction of the Natural Environment Targeted Rate
                                                                        in July 2018 will enable investment of $311 million (over 10
                                                                        years) across a variety of areas. This includes programmes that
                                                                        protect parks, islands, marine and freshwater areas and measures
                                                                        to combat Kauri dieback disease. Meanwhile, our Pest Free
                                                                        Auckland initiative, has increased possum patrols, biosecurity
                                                                        measures and control of pests and weeds within Auckland
                                                                        Council parks.

                                                                        The introduction of the Water Quality Targeted Rate has also
                                                                        enabled additional investment of $452 million over 10 years to
                                                                        improve water quality by rehabilitating streams and reducing
                                                                        wastewater and septic tank run-off.

                                                                        There’s more that could be done; the challenge is to decide
                                                                        what should be done and how. Emerging technologies provide
                                                                        opportunities for change and more partnerships with central
                                                                        government and volunteer groups can make a big impact.
                                                                        Growing our public transport network and encouraging people
                                                                        out of their cars will have a positive effect on air quality and
                                                                        shrink our carbon footprint.

14 |   PRE-ELECTION REPORT
OUR ENVIRONMENT

        6000km                  541           150,000            12         9096km               515
       of stormwater            ponds          manholes         dams       of water pipes     wastewater
            pipes            and wetlands                                                    pump stations

            13                    3               15             91         7999km                18
         bores and              river       water treatment   reservoirs   of wastewater       wastewater
          springs              sources          plants                         pipes        treatment plants

15 |   PRE-ELECTION REPORT
ME AHA TĀTOU E URUPARE AI KI TE REREKĒTANGA O TE ĀHUARANGI?
               HOW DO WE RESPOND TO CLIMATE CHANGE?
Auckland Council has joined a growing community of cities around the world who have formally and
publicly recognised the urgency for action on climate change by declaring a climate emergency.

                                                                                                   The scientific consensus and evidence of climate change is
                                                                                                   widespread, and research and reports have shifted primarily
                                                                                                   toward better understanding of the pace and patterns of
                                                                                                   change and impacts. Recent research commissioned by the
                                                                                                   council to better understand regional climate impacts for the
                                                                                                   Auckland region shows Auckland’s mean annual temperature
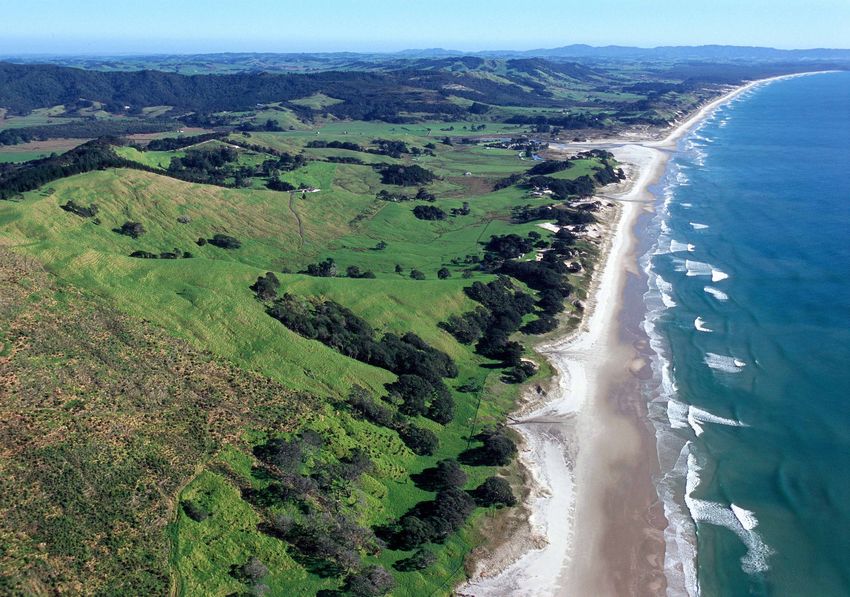
                                                                                                   is rising, rainfall patterns are changing, and our coastlines are
                                                                                                   being increasingly impacted by ongoing sea level rise.

                                                                                                   In response, Auckland’s ambitious targets and leadership
                                                                                                   on tackling climate change have earned recognition at a
                                                                                                   global level. And, on 11 June 2019, council approved public
                                                                                                   consultation of a draft climate framework for Auckland
                                                                                                   – Te Tāruke-ā-Tāwhiri: Auckland’s Climate Action Framework.

                                                                                                   The draft framework outlines key actions to increase Auckland’s
                                                                                                   resilience to climate change and reach our emissions target.
                                                                                                   What does this mean? It means every decision we make is
                                                                                                   done with the aim of creating a more resilient, zero carbon,
                                                                                                   healthy Auckland.

                                                                                                   The task for Auckland Council will be to lead many of the
                                                                                                   actions needed and assume advocacy, partnership, support,
                                                                                                   delivery or facilitation roles in others. This will be a key part of
                                                                                                   the 10-year budget 2021-2031.

16 |   PRE-ELECTION REPORT
THE CLIMATE CHANGE THREAT

           Increasing             Sea level rise
         temperatures                One metre
        over 90 extra hot days        by 2100
               by 2110

       Changing rainfall            Increase in
          patterns               extreme weather
                                    (storm intensity,
                                  flooding, droughts)

17 |   PRE-ELECTION REPORT
ME PĒHEA TE UTU ATU?
$
                   HOW DO WE PAY FOR IT?
    Supporting our growth requires investment in infrastructure while supporting current services and
    maintaining and renewing current assets.

                                                                                                        In our 10-year Budget 2018-2028 we pledged $26 billion capital
                                                                                                        investment for new and existing projects. We fund expenditure
                                                                                                        from different sources, including general rates, but with a
                                                                                                        current cap on average increases of 3.5 per cent each year, we
                                                                                                        must generate funding from other sources.

                                                                                                        The planned sale of non-strategic and surplus assets is forecast
                                                                                                        to raise $800 million. Our Corporate Property Strategy will
                                                                                                        also make the best use of the money tied up in our office
                                                                                                        building portfolio and avoid a budget shortfall of an estimated
                                                                                                        $117 million in servicing and maintenance costs. Value for
                                                                                                        Money benefits are projected to be $500 million over the next
                                                                                                        10 years and our efficiency savings target of $63 million by
                                                                                                        2021 is currently on track.

                                                                                                        Even with the practices outlined above, the impact of our
                                                                                                        record investment will see debt increase to more than
                                                                                                        $13 billion by June 2028. However, this would still fall within
                                                                                                        council’s own self-imposed, and prudent debt ceiling, which
                                                                                                        enables council to maintain an AA credit rating.

    18 |   PRE-ELECTION REPORT
So what else could be done?

Traditional funding mechanisms will not satisfy the levels of funding we need and additional
demands such as the increased investment for the City Rail Link have increased pressure on our
finances. Looking to the future, we have the opportunity to work in partnership with central
government and the private sector to find significant new infrastructure financing and funding
streams. Additionally, we could look at further asset sales, increasing service fees or public transport
fares and rates.

These options will need to be considered by the newly elected council in 2020, as it prepares the
10-year budget 2021-2031, for public consultation in early 2021.

19 |   PRE-ELECTION REPORT
NGĀ KAUPAPA MATUA
MAJOR PROJECTS
Over the next term our elected members will need to make key decisions to support the delivery of the
capital investment programme included in the 10-year Budget 2018-2028.

The major projects being invested in during the three years 2020/2021, 2021/2022 and 2022/2023 include:

INVESTING IN OUR WATER                                         Western isthmus water quality programme                         Auckland Zoo

NETWORKS                                                       This collaborative project leverages the investment in the      We are continuing to develop Auckland Zoo as a world
                                                               Central Interceptor to enable significant improvements in the   class zoo and conservation facility. We’re addressing the
Central Interceptor                                            stormwater network, reduce wastewater overflows into our        aging infrastructure and long-term under-investment to
The $1.2 billion project will reduce wastewater overflows,     waterways and improve our streams and beaches. The Water        ensure the zoo meets modern standards of animal
reduce environmental risks, increase network flexibility and   Quality Targeted Rate has allowed us to accelerate this work.   welfare, visitor amenity, wildlife exhibition and health
provide increased capacity to support our growth.                                                                              and safety obligations.

                                                               CCO INVESTMENTS
                                                               Transform and Unlock programme

                                                               Panuku is leading the redevelopment and regeneration of
                                                               town centres, creation of public spaces and facilitation of
                                                               housing development.

                                                               Ports of Auckland capital investment programme

                                                               Ports of Auckland is in the midst of a major investment
                                                               programme to increase capacity, efficiency and returns.
                                                               This includes container terminal automation, construction
                                                               of a car handling facility and capital investment at its
                                                               Waikato Freight Hub.

20 |   PRE-ELECTION REPORT
NGĀ KAUPAPA MATUA
MAJOR PROJECTS
TRANSPORT INVESTMENT                                                                                                               COMMUNITY ASSETS
By far the largest area of investment in our plans is in         Eastern Busway                                                    Open space land acquisition programme
improvements to our transport networks. Major projects in
this period include:                                             Delivery of a busway from Panmure to Pakuranga and through        We continue to acquire land across the region to provide a
                                                                 to Botany. This project will improve transport options by         variety of different types of parks for Aucklanders to enjoy.
City Rail Link                                                   making public transport, walking and cycling realistic options
                                                                 between the area and the rest of Auckland.                        City centre development programme
Our top priority transport project is the construction of twin
rail tunnels connecting Britomart with Mt Eden station. This     Rosedale and Constellation bus stations                           Over the next 10 years, Auckland Council has a vision to
project will more than double the capacity of our rail network                                                                     transform the waterfront into an attractive, people friendly
and significantly reduce journey times. Auckland Council will    New and improved busway stations to improve transport             environment. The transformation will support the 36th
contribute half of the $4.4 billion cost of the project.         options in these busy areas.                                      America’s Cup, Asia-Pacific Economic Forum (APEC), and Te
                                                                                                                                   Matatini in 2021.
                                                                 Road safety programmes

                                                                 Auckland Council is investing significantly in projects to
                                                                 combat the substantial increases in deaths and serious injuries
                                                                 on our road network. The investment covers both rural and
                                                                 urban safety programmes as well as initiatives such as speed
                                                                 management and increased red light cameras.

                                                                 Active transport programmes

                                                                 Auckland Council encourages walking and cycling. Key
                                                                 initiatives are underway such as walking and cycling
                                                                 connection to the Glen Innes to Tamaki Drive Shared Path and
                                                                 extending the walking and cycling network across Barrowcliffe
                                                                 bridge. We are also delivering events, trainings, campaigns and
                                                                 activities that promote cycling and cycle safety.

21 |   PRE-ELECTION REPORT
TE TIROHANGA TAKE PŪTEA WHĀNUI
FINANCIAL OVERVIEW
Auckland Council’s financial strategy
Our financial strategy sets out our approach to balancing the
need for investment in our city with ensuring the costs of that                                     Auckland Council Group debt to revenue ratio
investment are acceptable.
                                                                  280%
Limits on rates increases are consulted on through the
10-year Budget to ensure that rates costs are acceptable to
                                                                  270%                                                                                       Debt limit
the community.

Limits on the level of borrowing ensure costs remain              260%                                                                                       Internal ceiling
acceptable both in the short term through providing access
to lower interest rates and in the long term by not burdening     250%                                                                                       Updated
future generations with high interest and principal repayments.                                                                                              projection
The chart below shows the projected debt to revenue ratio         240%
included in the 10-year Budget and when updated to account                                                                                                   10-year Budget
for subsequent decisions.                                         230%                                                                                       2018-2028

                                                                         9

                                                                                                            3

                                                                                                                                                         8
                                                                                                                    24
                                                                                                      2
                                                                                  0

                                                                                                                             5

                                                                                                                                        26
                                                                                             1

                                                                                                                                                  7
                                                                         01

                                                                                                            02
                                                                                         02

                                                                                                    2

                                                                                                                                                       02
                                                                                                                            02
                                                                                    2

                                                                                                                                                2
                                                                                                 20

                                                                                                                  20
                                                                                 20

                                                                                                                                     20

                                                                                                                                             20
                                                                     -2

                                                                                                          -2
                                                                                        -2

                                                                                                                                                      -2
                                                                                                                            -2
                                                                                                 1-

                                                                                                                    -
                                                                              9-

                                                                                                                                   5-

                                                                                                                                             6-
                                                                    18

                                                                                                        22

                                                                                                                          24
                                                                                        20

                                                                                                                 23

                                                                                                                                                    27
                                                                                                2
                                                                             1

                                                                                                                                    2

                                                                                                                                           2
                                                                   20

                                                                                             20

                                                                                                      20

                                                                                                                                                  20
                                                                          20

                                                                                                            20

                                                                                                                        20
                                                                                   20

                                                                                                                                 20

                                                                                                                                        20
22 |   PRE-ELECTION REPORT
TE TIROHANGA TAKE PŪTEA WHĀNUI
FINANCIAL OVERVIEW
Performance against Financial Strategy

 Rates                                                        Annual Report            Forecast         Return on Investments                                       Annual Report           Forecast
                                                        2016/2017      2017/2018      2018/2019                                                                2016/2017      2017/2018    2018/2019
 Rates income ($ billion)                Limit                  1.51           1.58           1.69      Return on equity investments in        Target                  7%            7%          3.0%**
                                         Actual                 1.49           1.54           1.68      commercial activities                  Actual                 10%           24%          10.4%
 Rates increases                         Limit                3.50%          3.50%          3.50%       Return on Diversified Assets           Target                 7.0%             –               –
                                         Actual               2.57%          2.31%          2.85%       Portfolio*                             Actual                8.6%              –               –
                                                                                                        Return on Trusts and reserves          Target               2.26%         1.75%          1.50%
                                                                                                                                               Actual               3.86%         3.25%          3.10%
 Borrowing                               Limit                Annual Report             Forecast
                                                                                                        Return on council's investment in      Target               4.50%         4.50%                –
                                                        2016/2017      2017/2018      2018/2019         NZLGFA                                 Actual               5.56%         5.14%                –
 Net debt as a percentage of total       275%                  199%          206%                  –
 revenue                                                                                               * Diversified Assets Portfolio was sold down in September 2017 and all measures and targets were
                                                                                                       reviewed for the financial strategy included in the 10-year budget 2018-2028.
 Net interest as a percentage of         15%                    10%            10%                 –
 total revenue                                                                                         ** From 2018/2019 this target relates to annual growth in dividends.
 Net interest as a percentage of         25%                    18%            18%                 –
 annual rates income
 Group debt to revenue                   270%                      –              –         246%
Note: Limit on borrowing was reduced to a single measure in the financial strategy included in the
10-year Budget 2018-2028.

23 |   PRE-ELECTION REPORT
TE TIROHANGA TAKE PŪTEA WHĀNUI
FINANCIAL OVERVIEW
Operating and capital expenditure
The Annual Budget 2019/2020 included updated projections for both capital and operating    Capital investment
expenditure for the 10-year Budget period to reflect the impact of decisions made in the
preparation of the budget including:                                                       $ million                  2019/2020    2020/2021    2021/2022    2022/2023
                                                                                           10-year Budget 2018-2028        2,510        2,515        2,597        2,587
• The increased funding commitment for the CRL project
                                                                                           Updated projection              2,762        2,691        2,912       2,669
• Updated timing projections for capital projects
• Updated interest rates
                                                                                           Operating expenditure
                                                                                           $ million                  2019/2020    2020/2021    2021/2022    2022/2023
                                                                                           10-year Budget 2018-2028        4,172       4,347         4,521       4,688
                                                                                           Updated projection              4,236       4,363        4,545        4,724

24 |   PRE-ELECTION REPORT
TE TIROHANGA TAKE PŪTEA WHĀNUI
FINANCIAL OVERVIEW
Funding Impact Statement

 ($ millions)                                                                   Annual Report               Forecast        Annual Budget           10-year Budget 2018-2028
                                                                           2016/2017        2017/2018       2018/2019        2019/2020       2020/2021       2021/2022       2022/2023
 Sources of operating funding:
 General rates, UAGCs, rates penalties                                           1,463            1,514           1,579             1,654          1,752           1,849           1,950
 Targeted rates                                                                   185              200             212               230            220             227             232
 Subsidies and grants for operating purposes                                      272              286             299                321           306             314             321
 Fees and charges                                                                1,193            1,261           1,366              1,411         1,530           1,594           1,657
 Interest and dividends from investments                                               17           94                 75              71            71               71             72
 Local authorities fuel tax, fines, infringement fees and other receipts          331              308             446               445            440             456             471
 Total operating funding                                                        3,461            3,663           3,948              4,130         4,318           4,510           4,704
 Applications of operating funding:
 Payment to staff and suppliers                                                  2,375            2,444           2,577             2,822          2,744           2,817           2,911
 Finance costs                                                                    424              456             466               453            562             594             611
 Other operating funding applications                                                  0                0               0                0               0               0               0
 Total applications of operating funding                                        2,799            2,900           3,043              3,274         3,307            3,412          3,522

 Surplus (deficit) of operating funding                                           662              763             905               856           1,011          1,098            1,181

25 |   PRE-ELECTION REPORT
TE TIROHANGA TAKE PŪTEA WHĀNUI
FINANCIAL OVERVIEW
Funding Impact Statement continued...

($ millions)                                        Annual Report              Forecast        Annual Budget           10-year Budget 2018-2028
                                               2016/2017       2017/2018       2018/2019        2019/2020       2020/2021       2021/2022       2022/2023
Sources of capital funding:
Subsidies and grants for capital expenditure           187             211            256                517            475             471             431
Development and financial contributions               164             180             203               258             307            298              301
Increase (decrease) in debt                           629             308             308                792            712            485             543
Gross proceeds from sale of assets                     77              231                62             255             71             174              65
Lump sum contributions                                     0               0               0                0               0               0               0
Other dedicated capital funding                            0               0               0                0               0               0               0
Total sources of capital funding                     1,057            930             829              1,821          1,565           1,428          1,340
Application of capital funding:
Capital expenditure:
- to meet additional demand                           504             625             657               887             775            806              679
- to improve the level of service                     633             426             736               824             739             719            845
- to replace existing assets                          523              619            612                760            601            623             689
Increase (decrease) in reserves                        53              34             109                160             79             39               17
Increase (decrease) in investments                         6           (11)          (379)               46            383             338              292
Total applications of capital funding                1,719           1,693           1,734             2,678          2,577          2,526            2,521

Surplus (deficit) of capital funding                 (662)           (763)           (905)             (856)         (1,011)        (1,098)          (1,181)

Funding balance                                            0               0               0                0               0               0               0

26 |   PRE-ELECTION REPORT
TE TIROHANGA TAKE PŪTEA WHĀNUI
FINANCIAL OVERVIEW
Growing council’s asset base

We continue to grow our infrastructure asset base as we
seek to provide for a growing city, catch up on previous                         New assets and growth in borrowings
underinvestment and provide improved services to
Aucklanders. To ensure alignment with our financial          2.5
strategy this investment has increasingly been funded from
non-debt sources, leading to faster asset growth than
growth in borrowing.                                         2.0

The chart below shows our updated projections of growth in                                                             New works
borrowings and non-renewals capital investment.              1.5                                                       capital expenditure
                                                                                                                       (incl CRL)

                                                             1.0                                                       Growth in
                                                                                                                       borrowings
                                                             0.5

                                                             0.0
                                                                   2019/20   2020/21       2021/22       2022/23

27 |   PRE-ELECTION REPORT
TE TIROHANGA TAKE PŪTEA WHĀNUI
FINANCIAL OVERVIEW
Summary Balance Sheet                                                                                                                   Basis of preparation

 ($ millions)                Annual Report               Forecast       Annual Budget             10-year Budget 2018-2028              • Financials for 2016/2017 and 2017/2018 are taken from the
 As at 30 June             2017            2018            2019              2020             2021            2022         2023           audited accounts included in the Auckland Council Group
                                                                                                                                          annual reports.
 Assets:
 Financial assets              1,278           1,568            1,109               1,159          1,071          1,093        1,110    • Final accounts for the 2018/2019 were not available at
                                                                                                                                          the time of preparing this report. Officers have therefore
 Property, plant             43,361          46,730           48,128            50,644           53,865          55,220      57,708
                                                                                                                                          prepared forecast figures based on the quarter three results
 and equipment
                                                                                                                                          to 31 March 2019.
 Intangible assets                511             563             615                525             499             485          466
                                                                                                                                        • Figures for the current financial year (2019/2020) are taken
 Investment                       735             761             792                761             735             735          735
                                                                                                                                          from the recently adopted Annual Budget.
 property
 Investment in                 1,096           1,751            1,816             2,032           2,268            2,614      2,925     • Financial information for the three years following election
 associates and                                                                                                                           is taken from the 10-year Budget 2018-2028.
 joint ventures*
 Other assets                     378             89              68                 194             224             115           95
 Total assets                47,359          51,462           52,528            55,316          58,662          60,262       63,039
 Liabilities:
 Council debt                 8,300            8,832           8,956              9,720          10,656           11,142     11,685
 Other liabilities            3,283            3,828            4,379             3,955           3,777           3,816       3,905
 Total liabilities           11,583          12,660           13,335             13,675         14,433           14,958      15,590

 Ratepayer equity            35,776          38,802           39,193            41,642          44,229          45,304       47,449

* This represents Auckland Council’s investments in City Rail Link Limited and Auckland International Airport Limited.

28 |   PRE-ELECTION REPORT
You can also read