Predicting Wetland Occurrence in the Arid to Semi- Arid 1 Interior of the Western Cape, South Africa, for Improved 2 Mapping and Management ...
←
→
Page content transcription
If your browser does not render page correctly, please read the page content below
Predicting Wetland Occurrence in the Arid to Semi— Arid 1 Interior of the Western Cape, South Africa, for Improved 2 Mapping and Management Donovan Charles Kotze ( kotzed@ukzn.ac.za ) University of KwaZulu-Natal https://orcid.org/0000-0001-9048-1773 Nick Rivers-Moore University of KwaZulu-Natal Michael Grenfell University of the Western Cape Nancy Job South African National Biodiversity Institute Research Article Keywords: drylands, hydrogeomorphic type, logistic regression, probability, vulnerability Posted Date: August 17th, 2021 DOI: https://doi.org/10.21203/rs.3.rs-716396/v1 License: This work is licensed under a Creative Commons Attribution 4.0 International License. Read Full License
1 Predicting wetland occurrence in the arid to semi—arid
 2 interior of the Western Cape, South Africa, for improved
 3 mapping and management
 4
 5 D. C. Kotze1*, N.A. Rivers-Moore1,2, N. Job3 and M. Grenfell4
 1
 6 Centre for Water Resources Research, University of KwaZulu-Natal, Private Bag X01,
 7 Scottsville, 3209, South Africa
 2
 8 Freshwater Research Centre, Cape Town, South Africa
 3
 9 Kirstenbosch Research Centre, South African National Biodiversity Institute, Private Bag X7,
10 Newlands, Cape Town, 7945, South Africa
 4
11 Institute for Water Studies, Department of Earth Science, University of the Western Cape,
12 Private Bag X17, Bellville, 7535, South Africa
 *
13 Corresponding author: kotzed@ukzn.ac.za
14
15 Abstract
16 As for drylands globally, there has been limited effort to map and characterize such wetlands in
17 the Western Cape interior of South Africa. Thus, the study assessed how wetland occurrence and
18 type in the arid to semi-arid interior of the Western Cape relate to key biophysical drivers, and,
19 through predictive modelling, to contribute towards improved accuracy of the wetland map layer.
20 Field-verified test areas were selected to represent the aridity gradient, rainfall seasonality,
21 hydrogeomorphic (HGM) types and physiographic zones encompassed in the study area. The arid
22 areas of the Karoo physiographic zones had: (1) a low (3%) proportional area of wetland; and (2) wetlands
26 being predominantly hillslope seepages, but also including valley bottom wetlands.
27
28 A spatial probability surface of wetland occurrence was generated based on the statistical
29 relationship of verified wetland presence and absence data points with a range of catchment-scale
30 predictor variables, including topographic metrics and hydrological/climatic variables. This layer
31 was combined with raster images of most likely HGM type within the landscape to provide a final

 1
32 product of wetland occurrence, attributed by HGM type. Vulnerabilities of the wetlands were
33 identified based on key attributes of the different wetland types, and recommendations were
34 provided for refining the wetland map for the Western Cape.
35
36 Keywords: drylands; hydrogeomorphic type; logistic regression; probability; vulnerability
37
38 Declarations
39 Funding: the research was supported by the South African National Biodiversity Institute
40 Conflicts of interest/Competing interests: none are known
41 Availability of data and material: available from authors on request
42 Code availability: NA
43
44 Acknowledgements
45 The South African National Biodiversity Institute (SANBI) is thanked for supporting and funding
46 this research and Nacelle Collins is thanked for his assistance with refining the wetland mapping
47 recommendations arising from this study.
48
49
50
51 Introduction
52
53 Globally, much of the effort to map and characterize wetlands at a landscape scale has been in
54 humid temperate areas, where wetlands tend to be more extensive than in drylands (Hu et al. 2017).
55 In sub-Sharan Africa, the wetlands in drylands literature has largely focused on either the large
56 fluvial systems (Tooth and McCarthy 2007; Ellery et al. 2009) or endorheic depressions (pans)
57 (Goudie and Thomas 1985; Allan et al. 1995). Landscape-level examinations of the occurrence of
58 the full range of different wetland types represented in drylands appear to have been limited to a
59 few studies, notably that of Melly et al. (2016; 2017). This also holds true in the Western Cape,
60 South Africa, where much of the mapping effort and field verification has focused on the relatively
61 high precipitation areas near the coast, with the result that the extensive arid to semi-arid interior
62 of the province, especially to the east, has the lowest level of confidence in wetland spatial extent

 2
63 and hydrogeomorphic (HGM) type (Van Deventer et al. 2020). However, wetlands in drylands
64 tend to be hydro-geomorphologically distinct from wetlands in humid areas (Tooth and McCarthy
65 2007) and have an especially important role to play within the landscape in terms of the supply of
66 provisioning services for cultivators, pastoralists and other natural resource users (Scoones 1991).
67 This, coupled with the relatively poor level of mapping in these areas, identifies a clear research
68 gap. Although the occurrence of wetlands is expected to be generally lower in the interior of the
69 Western Cape compared with the coastal areas, there are areas of the interior where climate and
70 other environmental drivers are locally conducive to a higher wetland occurrence. Describing this
71 heterogeneity and the underpinning landscape-level drivers is valuable for baseline mapping and
72 characterization of wetlands and to assist in predicting how land-use change, climate change and
73 other stressors might affect wetlands.
74
75 The practical outcomes of the low accuracy of mapping include either delay in projects because of
76 false positives of wetlands, or wetlands being lost to other land developments because they have
77 not been mapped. Furthermore, it results in the true value of natural capital not being accurately
78 audited. There is thus a pressing need for improving the accuracy of South Africa’s national
79 wetland map, particularly for the extensive areas of the country which have lacked field
80 verification, including those in the present study.
81
82 Wetland HGM types show variable levels of vulnerability to different forces of degradation
83 (Rivers-Moore and Cowden 2012). Since the supply of ecosystem services can typically be
84 inferred based on HGM types, it is important for a wetland occurrence map to be correctly
85 attributed. Mapping wetland presence on its own typically produces a polygon layer that is
86 unattributed. Such maps only become truly useful as the product of integrated ancillary data layers
87 which provide probability values for occurrence, type, and ecological condition, from which
88 wetland practitioners will be able to make statements such as “at this location, there is an 85%
89 probability of a wetland occurring, which is five times more likely to be a seep than a floodplain”
90 (Rivers-Moore et al. 2020).
91
92 This study sought to better understand how the occurrence of wetlands generally (and specific
93 wetland HGM types) in the Western Cape interior relate to key biophysical drivers, and, through

 3
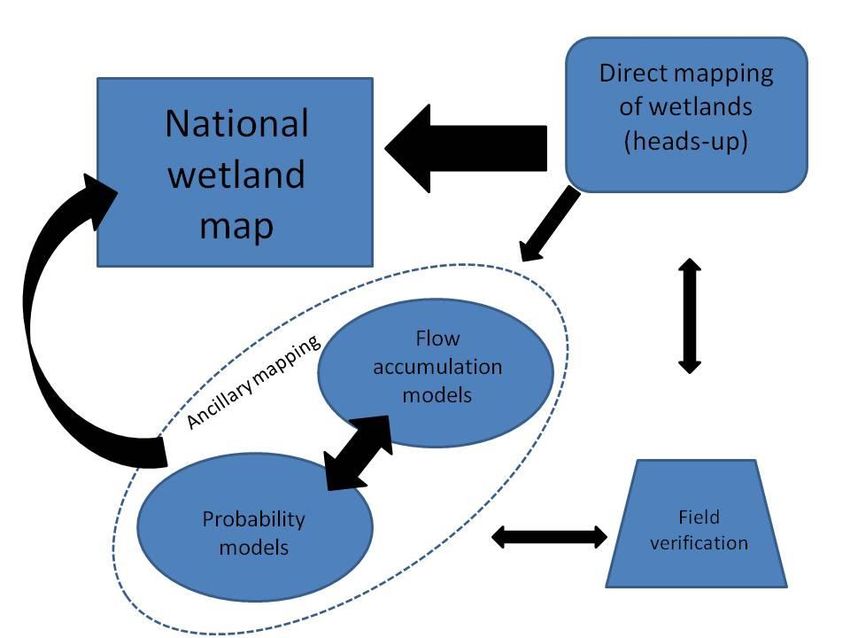
94 predictive modelling to contribute towards cost-effectively improving the accuracy of the wetland
 95 layer for the province. The study further demonstrates how the enhanced understanding of
 96 biophysical drivers affecting wetlands generally (and specifically of different wetland types) can
 97 be used to improve future mapping effort for the province and for dryland environments across the
 98 globe.
 99
100 Methods
101 Study area
102 The study area was defined as the central and western interior of the entire Western Cape Province.
103 This coincides with a mean aridity index of 0.133±0.04, calculated from the ratio of mean annual
104 precipitation (MAP) to mean annual evapotranspiration, where values < 0.2 are classified as arid
105 conditions (Trabucco and Zomer 2019). The boundary was defined according to hydrologically
106 correct sub-catchments rather than strictly along the administrative boundary (Figure 1), provided
107 by the South African National Biodiversity Institute (SANBI) and based on the sub-quaternary
108 catchments derived from the National Freshwater Ecosystem Priority Areas (NFEPA) (Nel et al.
109 2011) dataset. This translated into 547 catchment polygons with a median area of ~70km2. Field
110 test sites were selected to represent the aridity gradient, main rainfall seasons (i.e. winter rainfall
111 vs. summer rainfall), main hydrogeomorphic (HGM) types and physiographic zones represented
112 in the study area.
113 The study area comprised five primary physiographic zones, which encompass diverse geology
114 and climate (Table 1). The zones represent three mountain ranges, each with relatively high mean
115 annual precipitation (MAP; > 400mm), and two areas of flatter terrain in between, the first being
116 part of the Great Karoo and the second the Little Karoo, both with relatively low MAP (< 200mm;
117 Table 1).
118
119 Data collection
120 Foundational to the approach of the study was the identification of field-verified test areas within
121 the overall study area. In this study, a test area refers to a geographically-delimited area (preferably
122 >20 km2) within which wetlands have been classified according to hydrogeomorphic (HGM) type
123 and mapped with at least an intermediate level of confidence. This means that at least 20% of the
124 mapped wetlands have been observed in the field close enough to identify whether the dominant

 4
125 plant species are hydrophytes. In addition, most of the wetlands which have not been observed in
126 the field appear to have the same HGM type and a similar landscape setting and spectral signature
127 to a comparable wetland which has been observed in the field (and from which inferences can be
128 drawn). Given that the resources for collecting primary data were limited, the test areas were
129 derived as far as possible from existing sources. However, where major gaps were found in terms
130 of representing key environmental gradients represented in the study area (in particular, mean
131 annual rainfall and rainfall seasonality) test sites were generated from scratch by collecting primary
132 data.
133
134 The criteria used in the selection of test sites were chosen as follows:
135 • The spread of sites should achieve good representation of the aridity gradient represented in
136 the province, particularly along the drier end of the continuum, which covers much of the
137 interior of the province and has thus far received relatively little attention in terms of wetland
138 mapping effort.
139 • The spread of sites should achieve good representation of the main rainfall seasons
140 (aseasonal, mainly in the west vs. late summer rainfall, mainly in the east) represented in the
141 study area.
142 • The spread of sites should achieve good representation of the main hydrogeomorphic types
143 represented in the province.
144 • Sites with relatively low levels of wetland loss/alteration/creation are preferable to where
145 such levels are high because such impacts “interfere” with the predictive relationship between
146 wetland occurrence and biophysical drivers.
147 • Sites involving a shorter travel distance and with wetlands which are generally more
148 accessible are preferable to those with longer distances and lower accessibility.
149 • Sites with existing information on the wetlands are preferable to those without.
150
151 All of the datasets outlined above were used, to varying degrees, to inform probability models of
152 wetland occurrence and HGM type. These rely on binary data (e.g. wetland presence or absence)
153 correlated with associated environmental predictor data (for example, elevation). The
154 environmental data included a number of core datasets common across regions and model types,

 5
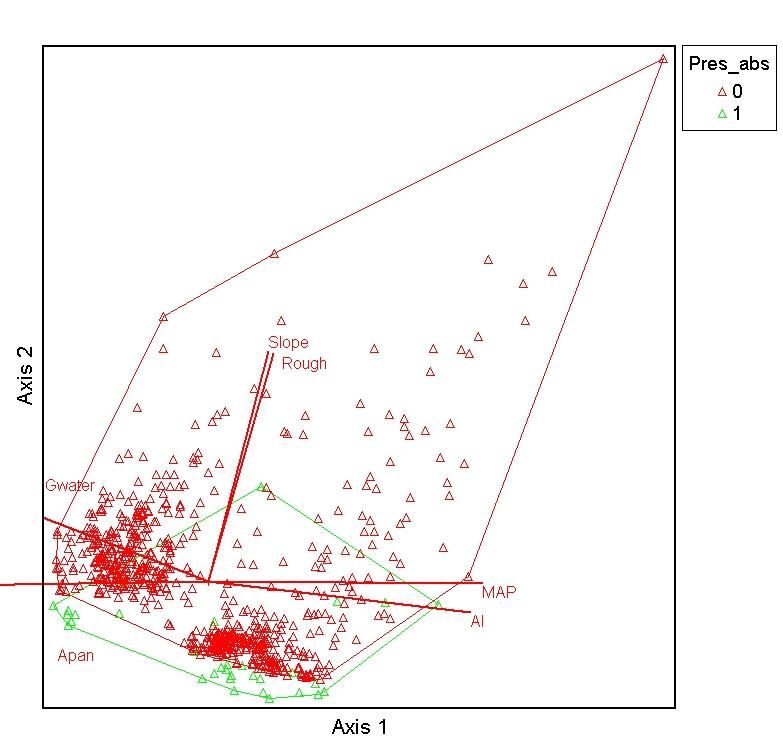
155 and use of variables specific to regions or model output. The study included 13 test areas (Table
156 2) covering a total of 2 520 km2.
157
158 Predictor variables and spatial datasets
159 Raster layers for nine predictor variables were used for the wetland models (Table 3). Raster layers
160 comprised a combination of primary data or were DEM-derived. The digital elevation model
161 (DEM) was obtained by first downloading the appropriate 3 arc-second SRTM (~90m resolution)
162 data tiles from the USGS website (USGS 2021), and then merging these together into a single
163 image. Data sinks were filled prior to calculating the DEM-derived surfaces: GRASS r.flow
164 routine for the flow accumulation surface; and SAGA Terrain model roughness for the roughness
165 index. All raster layers were standardised to the spatial extent of the study region.
166
167 Model development
168 Using field-verified datasets of wetland presence and absence across these landscapes, a spatial
169 probability surface of wetland occurrence was generated for the study area. This was based on the
170 statistical relationship of wetland presence and absence data points with a range of catchment-
171 scale predictor variables. These included topographic metrics (elevation, slope, terrain roughness)
172 and hydrological/ climatic variables (mean annual precipitation, flow accumulation, aridity index).
173 This layer was combined with raster images of most likely HGM type within the landscape.
174
175 A coverage of random points at a fixed density per sub-catchment was generated using the
176 “random point inside polygons (fixed)” tool in QGIS. Various point densities were evaluated,
177 with the best option being a density of ~0.28 points.km-2, or approximately 20 points per sub-
178 catchment. Next, a subset of these points coincident with where wetland data were used was
179 selected using the “select by location” tool.
180
181 The point sampling tool was used to obtain data values from raster images for all predictor
182 variables, with these exported as a data matrix. A PCA biplot was undertaken to assess
183 relationships between wetland presence/ absence and environmental predictor variables (McCune
184 and Mefford 2011).
185

 6
186 The same data matrix was used to define a stepwise logistic regression model for calculating the
187 probability of wetland occurrence (R Development Core Team 2009). Wetland probability of
188 occurrences was spatially represented by multiplying the variable coefficients against their raster
189 images using the Raster calculator in QGIS (QGIS 2018; Figure 1). The probability surface was
190 verified using a receiver operating curve (ROC) to calculate the Area under Curve (AUC) statistic
191 (Medcalc 2021).
192
193 Wetland HGM type
194 The Bayesian network model developed by Rivers-Moore et al. (2020) was configured according
195 to which variable states would most effectively predict which wetland areas would be most likely
196 be seeps. For this model, the probability of a wetland being a particular HGM type was
197 conditionally based on four interacting topographic variables classified into state classes.
198 Probability of HGM type was based on case files where each HGM occurrence was associated
199 with the variable state class for elevation, slope, relief ratio and groundwater depth. The raster
200 layers for each variable were reclassified (QGIS: r.reclass) according to the threshold values for
201 variable states; values below this threshold were assigned a NULL value. In the case of seeps,
202 raster images were classified into binary layers: “high” elevation > 500m; “shallow” groundwater
203 < 8m below ground; “steep slopes > 5°. To spatially represent where seeps would be likely to
204 occur, the raster images were multiplied together using the raster calculator. This output image
205 was multiplied with the wetland occurrence probability map to indicate probabilities of wetland
206 seep occurrence.
207
208 HGM type vulnerabilities
209 A rating of the vulnerabilities of wetland types in the study area was undertaken based on: (1) the
210 wetlands’ key biophysical features and likely key water inputs which are sustaining these wetlands;
211 and (2) current impacts on the different wetland types. The level of vulnerability to a specific
212 threat was based on a joint consideration of: (1) the intensity of the anticipated impact if a specific
213 threat was to occur; and (2) the observed current extent of the threat. For example, while the
214 anticipated impact intensity of sewage/ effluent/ pollution on hillslope seeps in the TMG (Table
215 Mountain Group) sandstone mountains is potentially high if it were to occur, the occurrence of

 7
216 this wetland type subject to sewage/ effluent/ pollution is extremely low, and therefore the overall
217 level of threat for this wetland type and threat type combination is low.
218
219 Results
220 Wetland presence
221 Based on the field data collected, the arid areas of the Great Karoo and the Little Karoo
222 physiographic zones had the following key results: (1) a similarly very low (0.7%) proportional
223 area of wetland; (2) an almost complete absence of seepage slope wetlands (Figure 1); (3) locally
224 common ephemeral depressions in some areas, with all of these depressions being non-vegetated;
225 and (4) most of the wetland associated with valley bottoms having high stream order, with some
226 being floodplains but many confined entirely to a vegetated channel (Figure 1). The less arid
227 mountain zones of the Great Escarpment, Swartberg/Klein Swartberg and Langeberg had the
228 following key results: (1) a much higher proportional area of wetland (5,2%, 2.6% and 3.6%
229 respectively); and (2) wetlands being predominantly hillslope seepages (Figure 1), with some on
230 very steep (>45%) slopes, but also including valley bottom wetlands.
231
232 The relative frequency of occurrence of different HGM types varied markedly across the five
233 physiographic zones (Figure 2). In all three mountain zones, depressions and floodplains were
234 lacking and the hillslope seep (Supplementary Plates 1-4) was the most frequently occurring HGM
235 type, while in the Great Karoo zone, hillslope seep wetlands were entirely absent and in the Little
236 Karoo hillslope seep wetlands had one of the lowest occurrences, with a total of only three seeps
237 recorded, all in close proximity to the Warmwaterbad hot springs, suggesting deep artesian
238 groundwater supply. In the Table Mountain Group (TMG) sandstone mountains, many hillslope
239 seep wetlands were located on steep (>10%) slopes, and some on very steep (>45%) slopes. These
240 seeps varied from permanent to strongly seasonal, suggesting both: (a) relatively “shallow”, rapid
241 recharge-discharge response resulting in seasonal and interflow contribution to seeps; and (b)
242 deeper, higher storage and longer flow paths resulting in a sustained, often constant discharge, as
243 shown by Colvin et al. (2009) and Meyer (2002). In the Great Escarpment, hillslope seep wetlands
244 were most prominent in the Sneeuberg, with the largest of these occurring on south-facing aspects
245 of the Toorberg mountain, which comprises inclined dolerite sills (Clark et al. 2009). No hillslope
246 seep wetlands were recorded in the Great Escarpment in the Nuweveld mountains between

 8
247 Beaufort West and Loxton and between Murraysburg and Victoria West, characterized by lower
248 MAP than the Sneeuberge.

249 In all three mountain zones, the channelled valley bottom (Supplementary Plate 7) was the second
250 most frequently occurring HGM type. This was followed in the Great Escarpment and South Cape
251 fold mountains by the unchannelled valley bottom (Supplementary Plates 5-6), but the latter was
252 absent in the Swartberg Cape fold mountains (Figure 2). In the Great Karoo and Great Escarpment,
253 the unchanelled valley bottom occurred mainly in areas with reasonable (>300 mm) MAP onsite
254 and/or higher MAP in their catchments, and the three largest of these wetlands were all seasonally
255 saturated and located in a broad valley floor with a dolerite dyke across their outflows, from where
256 flow proceeded through a narrow, confined valley, locally referred to as a “poort”. The Langeberg
257 TMG sandstone mountains contained the only known permanently saturated unchanneled valley
258 bottoms, and were the only wetlands in the study area with known peat accumulations.

259 The most frequently occurring HGM type in both of the Karoo zones was the vegetated channel
260 (i.e. such wetlands were confined to the main river channel, generally with a stream order >2, and
261 did not extend up onto the valley floor, if present) (Supplementary Plates 9-10). In both Karoo
262 zones it was rare to find wetlands extending out of the channel across the valley floor, and where
263 present (Supplementary Plate 8), these were generally located within 10 km of the higher rainfall
264 mountain areas, from which they likely receive surface flows following major rainfall events. In
265 addition, some are supplied by groundwater, for which direct evidence is found for the Prins River
266 (Grenfell et al. 2021). In the Great Karoo, the next most frequently occurring HGM type was the
267 depression, with all depressions being unvegetated, as was the case in the Little Karoo. Most
268 depressions were in some of the lowest rainfall areas of the study area, even occurring where
269 MAP
276 calculator (Figure 4). This output indicates distinct regions where wetland occurrence, irrespective
277 of HGM type, is likely to be high (Figure 4). The variable with greatest leverage was slope,
278 succeeded by roughness (Table 5).
279
 5.982−0.004( − )…+0.002( )
280 ( ) = [1]
 1+ 5.982−0.004( − )…+0.002( )

281
282 Model performance
283 Based on the verified wetlands and the authors’ knowledge of known wetland rich and wetland
284 poor areas respectively within the study area, indications are that the model is a sound reflection
285 of the situation on the ground. This was supported by the quantitative model assessment of wetland
286 occurrence, based on the ROC, which showed a high level of classification accuracy based on the
287 Area Under Curve (AUC) statistic (Figure 6).
288
289 HGM types
290 The spatial product from the Bayesian network model for predicting wetland HGM type was
291 successful, resulting in a raster image indicating distinct zones within the study area where the
292 prevalent wetlands are most likely to be seeps (Figure 5). Overlaying this image with the
293 probability model indicated that the highest probabilities for seeps were with their being associated
294 with the Cape fold mountain regions (Figure 5).
295
296 Discussion
297 Patterns of wetlands relative to aridity
298 The following key trends in the study were noted in relation to the gradient of increasing aridity:
299 (1) a decreasing overall extent of wetlands; (2) a general narrowing of the diversity of HGM types
300 towards the most arid extreme, with hillslope seep wetlands confined almost entirely to moderate
301 aridity and unchanelled valley bottoms to moderate and moderately high aridity; (3) an increasing
302 confinement of wetlands in the most arid areas to vegetated channels and unvegetated depressions;
303 and (4) excluding the depressions, an increasing “dependence” on groundwater sources for wetland
304 maintenance, mainly within the channel and at a few hillslopes associated with the artesian
305 discharge of deep groundwater, which were identified at only a single location.
306

 10
307 Melly et al. (2016; 2017) also reported a declining overall extent of wetland with increasing aridity
308 and a declining occurrence of hillslope seep wetlands relative to depression wetlands. However,
309 a key difference between this study and that of Melly et al. (2016; 2017) is that while this study
310 included areas with MAP
338 relatively high MAP areas at high altitudes to the lower portions then some of the last hillslope
339 wetlands that one encounters before entering the Karoo zone (where hillslope seep wetlands are
340 almost entirely absent) would be amongst those close to this threshold.
341
342 In the Great Karoo and Little Karoo, a key factor affecting specific vulnerabilities of a wetland is
343 whether it is groundwater fed. As evident in the most recent drought, groundwater abstraction is
344 widespread and is continuing to increase, exposing groundwater-dependent wetlands to high
345 vulnerabilities. Several of the channel and channelled valley bottom wetlands appear to be
346 groundwater fed, and in the Little Karoo these wetlands, such as the Prins River wetland referred
347 to earlier, appear to be mainly associated with sandstone lithologies. For much of the remaining
348 areas of the little Karoo, lithologies are predominantly shales and siltstones, and aquifers are
349 generally deep and typically of poor quality, and here groundwater abstraction is of a lesser threat
350 to wetlands. As described earlier, in the Great Karoo and Great Escarpment, some of the valley
351 bottom wetlands are associated with dolerite dykes, which are also favoured sites for boreholes
352 (Woodford and Chevallier 2002). Thus, some of these valley bottom wetlands are likely to be
353 vulnerable to groundwater abstraction, but further investigation is required to establish the
354 surface/groundwater connections and degree to which these dolerite dykes (and sills) might act as
355 both geomorphological and hydrological controls.
356
357 The verified depressions were predominantly in the lowest MAP areas of the study area in the
358 Great Karoo and Little Karoo. All were unvegetated (which appears to be the natural state of these
359 wetlands), are flooded very infrequently and for short duration (from direct precipitation and run-
360 on from their local catchment) and are likely to at least be somewhat saline. These factors provided
361 the primary motivation for assigning a negligible vulnerability of this wetland type to grazing
362 pressure and cultivation, although it is recognized that livestock may potentially impact such
363 systems through physical disturbance of biocrusts, if present (Elliot et al. 2019). In addition, these
364 depressions do not appear to be connected to groundwater and therefore are not vulnerable to
365 groundwater use. Furthermore, they are unlikely to change appreciably in structure as a result of
366 the predicted aridification of climate. However, they could already be close to the minimum
367 flooding duration and frequency required by their current micro fauna and flora, such that even a
368 fairly modest climate-induced reduction in inundation frequency and/or duration would render

 12
369 these areas no longer suitable for much of this fauna and flora. However, this is not known and
370 would require further investigation. Furthermore, impacts on microbes have potential
371 geomorphological implications given that microbes in the soil surface of drylands form biocrusts
372 which reduce erodibility by wind and water (Elliot et al. 2019). This also requires further
373 investigation.
374
375 Model performance and potential
376 Spatial products of wetland occurrence and type are encouraging. Prediction accuracy was
377 commensurate with other arid-zone studies from non-winter rainfall regions, with Melly et al.
378 (2016) reporting an AUC of 0.66. However, both studies reported lower AUC values than those
379 from Hiestermann and Rivers-Moore (2015), who reported an AUC of 0.84 for a wetter summer
380 rainfall region of South Africa. This suggests that best model accuracy is achieved through
381 regional models, and that dryland regions are likely to have other confounding factors yet to be
382 accounted for.
383
384 Wetland presence could be predicted using landscape characteristics (slope, catchment roughness,
385 and elevation), and moisture regime (level of aridity based on A-pan evapotranspiration). This
386 suggests that understanding of wetland presence in the landscape is not only a function of
387 catchment characteristics, but also available water, with higher levels of aridity decreasing the
388 probability of wetland occurrence. The utility value of having climate-related variables in a
389 predictive model is in providing the capability of assessing impacts of climate change on extent of
390 wetland areas. However, the predictor model is only as accurate as the data layers underpinning
391 it. Further refinements include accounting more specifically for topographic heterogeneity linked
392 to rainfall patterns, for example the Cape fold mountains. This could better account for the fact
393 that the aquifer potential varies greatly across TMG areas, with the highest potential areas tending
394 to be associated with faults and strongly folded strata (de Beer 2002) and for which the resolution
395 of the current model did not account but which could potentially be modelled using an approach
396 such as that applied by Blake et al (2010). This refinement could also be extended to exploring in
397 more detail the influence of geology (in particular, the dolerite) on aquifer potential in the Great
398 Escarpment. In addition, aspect may also play a role in improving model accuracy for wetlands in
399 steep slopes, where steep southern aspect slopes may be shaded for much of the day, and

 13
400 consequently provide areas in the landscape where temperatures and evaporative demand are
401 significantly lower than would otherwise be the case (Clark et al 2009).
402
403 Recommendations for mapping
404 An important limitation of the spatial output of the modelling in this study is that, given its scale,
405 it does not accurately represent individual wetland extent. The current approach has the capacity
406 to be combined with additional spatial layers derived using complementary methods, such as the
407 likelihood of occurrence of different HGM types based exclusively on a flow accumulation surface
408 to indicate regions of probable wetness. By combining both approaches, it is then possible to
409 identify: (1) specific areas of the landscape with a high likelihood of occurrence of hillslope seep
410 wetlands; and (2) specific areas of the landscape where despite having the highest flow
411 accumulation values in the local landscape, the likelihood of the area being a wetland is very
412 low. Both approaches constitute ancillary data that will support the national wetland mapping
413 process (Figure 7). In practical terms, polygons defined as potential wetlands, which have a high
414 probability of occurrence, would be confidently categorized as wetland areas. Conversely,
415 polygons defined as potential wetlands, which have a low probability of occurrence, are unlikely
416 to be wetlands but rather non-wetland drainage lines.
417
418 References
419 Allan D G, Seaman M T, Kaletja B (1995) The endorheic pans of South Africa. In Cowan G I
420 (ed.) Wetlands of South Africa. Department of Environmental Affairs and Tourism,
421 Pretoria.
422 Blake D, Mlisa A, and Hartnady C (2010) Large scale quantification of aquifer storage and
423 volumes from the Peninsula and Skurweberg Formations in the southwestern Cape.
424 Water SA 36: 177-184
425 Clark VR, Barker NP, Mucina L (2009) The Sneeuberg: A new centre of floristic endemism on
426 the Great Escarpment, South Africa. South African Journal of Botany 75:196–238.
427 Collins, N.B. 2018. Chapter 5: Modelling of probable wetland extent. FS DESTEA internal report,
428 in Van Deventer et al. South African National Biodiversity Assessment 2018: Technical
429 Report. Volume 2a: South African Inventory of Inland Aquatic Ecosystems (SAIIAE).
430 Version 3, final released on 3 October 2019. Council for Scientific and Industrial

 14
431 Research (CSIR) and South African National Biodiversity Institute (SANBI): Pretoria,
432 South Africa. Report Number: CSIR report number CSIR/NRE/ECOS/IR/2018/0001/A;
433 SANBI report number http://hdl.handle.net/20.500.12143/5847.
434 Colvin C, le Maitre D, Saayman I, and Hughes S (2007) An Introduction to Aquifer Dependent
435 Ecosystems in South Africa. WRC Report No. TT301/07 Water Research Commission,
436 Pretoria.
437 Colvin C, Riemann K, Brown C, Le Maitre D, Mlisa A, Blake D, Aston T, Maherry A, Engelbrecht
438 J, Pemberton C, Magoba R, Soltau A, Prinsloo E (2009) Ecological and environmental
439 impacts of large-scale groundwater development in the Table Mountain Group (TMG)
440 aquifer system. WRC Report No. 1327/1/08. Water Research Commission, Pretoria,
441 South Africa.
442 De Beer (2002) The stratigraphy, lithology and structure of the Table Mountain Group. In:
443 Peterson K and Parson R (eds.) A synthesis of the hydrogeology of the Table Mountain
444 Group – formation of a research strategy. WRC Report No. TT 158/1. Water Research
445 Commission, Pretoria.
446 Department of Water and Sanitation (DWS) (2015) Reserve Determination Studies for Surface
447 Water, Groundwater, Estuaries and Wetlands in the Gouritz Water Management Area:
448 Wetland Report. Prepared by Rountree, M (Fluvius Consultants) for Scherman Colloty
449 & Associates cc. Report no. RDM/WMA16/03/CON/0513.
450 Ellery W, Grenfell M, Grenfell S, Kotze D, McCarthy TS, Tooth S, Grundling PL, Beckedahl H,
451 Le Maitre D, Ramsay L (2009) WET-origins: controls on the distribution and dynamics
452 of wetlands in South Africa. Water Research Commission Report TT334/09, Pretoria.
453 Elliott DR, Thomas AD, Strong CL, Bullard J (2019) Surface stability in drylands is influenced
454 by dispersal strategy of soil bacteria. Journal of Geophysical Research: Biogeosciences,
455 124(11), pp.3403-3418.Goudie AS, Thomas DSG (1985) Pans in southern Africa with
456 particular reference to South Africa and Zimbabwe. Zeitschrift fur Geomorphologie NF
457 29: 1-19.
458 Grenfell MC, Grenfell SE, Mazvimavi D (2021) Morphodynamic modelling of dryland non-
459 perennial riverscapes, with implications for environmental water allocation. Prog. Phys.
460 Geog. Earth. Enviro. March 2021. https://doi.org/10.1177/0309133321996639.

 15
461 Hiestermann J, Rivers-Moore N A (2015) Predictive modelling of wetland occurrence of
462 KwaZulu-Natal, South Africa. S. Afr. J. Sci. 111:10. doi: 10.17159/sajs.2015/20140179
463 Hu S, Niu Z, Chen Y, Li L, Zhang H (2017) Global wetlands: potential distribution, wetland loss,
464 and status. Science of The Total Environment 586:319-327.
465 McCune B, Mefford MJ (2011) PC-ORD. Multivariate Analysis of Ecological Data. Version 6.16
466 MjM Software, Gleneden Beach, OR.
467 MedCalc® (2021) Statistical Software version 20 (MedCalc Software Ltd, Ostend, Belgium;
468 https://www.medcalc.org).
469 Melly BL, Schael DM, and Gama PT (2017) Perched wetlands: An explanation to wetland
470 formation in semi-arid areas. Journal of Arid Environments 141:34-39
471 Melly BL, Schael DM, Rivers-Moore NA, and Gama PT (2016) Mapping ephemeral wetlands:
472 manual digitisation and logistic regression modelling in Nelson Mandela Bay
473 Municipality, South Africa. J. Environ. Manage. 25, 313–330. doi: 10.1007/s11273-
474 016-9518-7
475 Meyer PS (2002) Springs in the Table Mountain Group, with Special Reference to Fault Controlled
476 Springs, In Pietersen K and Parsons R (eds.) A Synthesis of the hydrogeology of the
477 TMG Formation of a research strategy, WRC Report No. TT 158/01.Water Research
478 Commission, Pretoria.
479 Mucina L, Rutherford MC (eds.) (2006) The Vegetation of South Africa, Lesotho and Swaziland.
480 Strelitzia, vol. 19. South African National Biodiversity Institute, Pretoria
481 QGIS (2018). QGIS Geographic Information System. Open Source Geospatial Foundation Project.
482 http://qgis.osgeo.org.
483 R Development Core Team (2009) R: A Language and Environment for Statistical Computing.
484 Vienna: R Foundation for Statistical Computing. Available online at: http://www.R-
485 project.org
486 Rivers-Moore NA, Cowden C (2012) Regional prediction of wetland degradation in South Africa.
487 Wetlands Ecology and Management 20:491-502.
488 Rivers-Moore NA, Kotze DC, Job N, Mohanlal S (2020) Prediction of wetland hydrogeomophic
489 type using morphometrics and landscape characteristics. Frontiers in Environmental
490 Science 8:58. DOI: 10.3389/fenvs.2020.00058.

 16
491 Schulze RE (ed) (2007) South African Atlas of climatology and agrohydrology. WRC Report
492 1489/1/06. Water Research Commission, Pretoria
493 Scoones I (1991). Wetlands in drylands: key resources for agricultural and pastoral production in
494 Africa. Ambio, 20:366–371.
495 Thomas AD, Dougill AJ, Elliott DR, Mairs H (2014) Seasonal differences in soil CO2 efflux and
496 carbon storage in Ntwetwe Pan, Makgadikgadi Basin, Botswana. Geoderma, 219:72-81.
497 Tooth S, McCarthy TS (2007). Wetlands in drylands: key geomorphological and sedimentological
498 characteristics, with emphasis on examples from southern Africa. Progress in Physical
499 Geography 31:3–41.
500 Trabucco A, Zomer R (2019) Global Aridity Index and Potential Evapotranspiration (ET0)
501 Climate Database. https://doi.org/https://doi.org/10.6084/m9.figshare.7504448.v3
502 USGS (2021) SRTM Digital Elevation/SRTM Void Filled 3-Arc. Available online at:
503 https://earthexplorer.usgs.gov/
504 Van Deventer H, Van Niekerk L, Adams J, Dinala MK, Gangat R, Lamberth SJ, Lotter M, Mbona
505 N, MacKay F, Nel JL, Ramjukadh CL, Skowno A, Weerts SP (2020) National Wetland
506 Map 5: An improved spatial extent and representation of inland aquatic and estuarine
507 ecosystems in South Africa. Water SA 46:66-79.
508 Woodford A C, and Chevallier L (Eds.) 2002. Hydrogeology of the Main Karoo Basin: Current
509 knowledge and future research needs. WRC Report No. TT 179/02. Water Research
510 Commission, Pretoria.
511

 17
512 Table 1 The primary physiographic zones of the Western Cape interior, based on DWS (2015) and Mucina and
513 Rutherford (2012), given in order of occurrence from the north to the south
514
 Physiographic General description Climate Main Vegetation Types
 zones according to Mucina and
 Rutherford (2012)
 Great A semi-continuous mountain system MAP predominantly Karoo Escarpment
 escarpment on the edge of South Africa’s inland 400-600 mm (very late Grassland, Eastern Upper
 (PZ1) plateau, characterized by dolerite- summer) Karoo, Upper Karoo
 capped mountains. Hardeveld
 Plains of the Predominantly low-relief plains, with MAP predominantly Gamka Karoo,
 Great Karoo Karoo Supergroup sedimentary 100-200 mm (very late Koedoesberge-
 (PZ2) rocks, broken by river valleys and summer) Moerdenaars Karoo,
 dolerite-capped koppies (hills). Tanqua Karoo, Southern
 Karoo Reviere
 Swartberg Cape A continuous mountain system of MAP from 900 mm in the
 Klein mountains in the Western Cape. mountains (all year)
 Swartberg)
 (PZ3)
 Little Karoo A predominantly gently undulating MAP is generally low Western Little Karoo,
 (PZ4) terrain with Bokkeveld shales, broken (
517 Table 2 An overview of the test areas included in the study, with PZ1-6 refering to the numbers designating the
518 different Physiographic zones described in Table 1
519
 Test areas Brief description

 Van Wyksdorp (Groot River Predominantly gently sloped lowlands of the Klein Karoo (PZ41) and including some of
 and Touws River) its major rivers. Mean annual rainfall is generally low (
521 Table 3 List of raster-based predictor variables for modelling probability of wetland occurrence and most likely HGM type
 Data layer Source
 Elevation (m) USGS (2021) 90m Digital Elevation Model
 Slope (degrees) DEM-derived
 Roughness DEM-derived
 Relief ratio DEM-derived
 Flow accumulation/ runoff DEM-derived
 Groundwater depth (metres below ground) Colvin et al. (2007)
 Aridity index Trabucco & Zomer (2019)
 A-pan evaporation (mm) Schulze (2007)
 Mean annual precipitation (mm) Schulze (2007)
522
523

 20
524 Table 4 Eigenvalues for PCA in Figure 3

 Variable 1 2
 % Cum. Var. 38.496 63.718
 Presence/ Absence 0.0176 -0.1274
 Aridity Index 0.4857 -0.2061
 A-pan evap. -0.4837 -0.0761
 Slope 0.233 0.5621
 Runoff 0.0683 0.0246
 Elevation -0.1266 0.4623
 MAP 0.497 -0.0576
 Roughness 0.2414 0.5597
 Groundwater -0.3867 0.2976
525
526

 21
527 Table 5 Variables for wetland occurrence model for predicting wetland probability of based on data for the arid interior
528 zone of the Western Cape Province (n = 1292; Presence/ Absence of 231 vs.1061). All coefficients were significant
529 for p < 0.05
530
 Variables Estimate Std. error z-value Pr(>|z|)
 Intercept 5.98213 1.18684 5.040 4.65E-07
 A-Pan evap. (mm) -0.00410 0.00053 -7.756 8.74E-15
 Roughness (m) 0.03848 0.00950 4.049 5.14E-05
 Slope (°) -0.12285 0.03905 -3.146 0.00165
 Elevation (m) 0.00196 0.00021 9.515 2.00E-16
531
532

 22
533 Table 6 A preliminary rating of the level of vulnerability 1 of the main wetland types in the Western Cape interior to
534 selected major threats
 Major threat types
 Climate Local Upstream IAPs Sewage/ Grazing Cultivation
 Broad wetland types change groundwater dams/ effluent/
 use abstractions/ pollution
 diversions
 Hillslope seeps – *** * * ** *
 TMG mountains
 Hillslope seeps – *** * * * ** *
 Great Escarpment
 mountains
 Hillslope seeps – ** ** ** * **
 Karoo
 Channelled valley ** * * **
 bottom – TMG
 Mountains
 Channelled valley ** *** *** *** * * **
 bottom and floodplain
 – Karoo
 Unchannelled vb – *** *
 TMG mountains
 Unchannelled vb – *** ** *** ** * ** *
 Great Karoo
 Depressions - Karoo ** *

535 Vulnerability is scored on the following scale: [ ]=Negligible; [ * ]=Low; [ ** ]=Intermediate; [ *** ]=High
536
537

 23
538

539 Figure 1 Study area, showing physiographic regions, with presence/ absence wetland data points indicated. Inset
540 (left) location of the Western Cape Province in South Africa, while inset (right) shows the arid interior study region
541 within the overall aridity gradient of the Western Cape Province.
542

 24
543
 100
 80
 60
 40
 20
 0
 Great Plains of the Swartberg/Klein Little Karoo South Cape fold
 escarpment Great Karoo Swartberg cape (n=41) mountains
 (n=28) (n=64) fold mountains (n=44)
 (n=89)

 Depression floodplain
 channel Channelled valley bottom
 Unchannelled valley bottom Hillslope seep
544
545
546 Figure 2 Proportional contributions of wetland HGM types to overall wetland area per physiographic region
547

 25
548
549
550 Figure 3 Principal components analysis of wetland presence/ absence relative to predictor variables (see Table 2 for
551 further details). Convex hulls indicate wetland presence (1) versus absence (0) sites.
552
553

 26
554

555
556 Figure 4 Probability of occurrence of wetlands within the arid interior study region of the Western Cape Province,
557 represented as a continuous probability layer reclassified into probability class intervals
558

 27
559 Figure 5 Raster image of potential seep regions in the study area, based on corresponding variable states from rivers-
560 Moore et al. (2020) (top), and the associated probability surface for seeps using the probability of wetland occurrence
561 model for the study area (lower)
562

 28
563

564
565 Figure 6 Receiver operating curve of false positive versus true positive classification rate for prediction of wetland
566 occurrence model the study region (AUC = 0.78)
567

 29
568
569 Figure 7 Mixed modeling approach within the context of the national wetlands mapping process
570
571

 30
Supplementary Files
This is a list of supplementary les associated with this preprint. Click to download.

 WetlandWCapeinteriorSupplementaryplates.pdf
You can also read