Probation and Prisons in Europe, 2020: Key Findings of the SPACE reports
←
→
Page content transcription
If your browser does not render page correctly, please read the page content below
Probation and Prisons in Europe, 2020:
Key Findings of the SPACE reports

Marcelo F. Aebi, Yuji Z. Hashimoto and Mélanie M. Tiago∗

1. Introduction
This document summarises the main findings of the 2020 Council of Europe Annual Penal Statistics on Persons
under the Supervision of Probation Agencies 1, better known under the acronym SPACE II, and compares them to
those of the 2020 Council of Europe Annual Penal Statistics on Prison Populations, SPACE I, which was published
in April 2021 2.

The rates and percentages presented here correspond to the European median values and averages computed
on the basis of figures weighted by the population and the number of probationers —or, respectively, of
inmates— in each jurisdiction (see Methodology for further details). Forty-six (46) out of the 52 probation
agencies (or equivalent institutions) in the 47 Council of Europe member states answered the 2020 SPACE II
questionnaire, which corresponds to a participation rate of 88%. Their answers are compared to those of the 48
prison services that replied to the 2020 SPACE I questionnaire. The countries that did not answer the
questionnaire are the following: Albania, Bosnia & Herzegovina, Germany, Hungary, Liechtenstein, Russian
Federation, and San Marino 3.

It must also be mentioned that the 46 probation agencies and the 48 prison services that filled in the SPACE
questionnaires did not necessarily provide data for all the items included in them. Thus, in the title of each Figure
and Table included in this document we indicate the number (N) of probation agencies —or, respectively, of
prison services— that provided the data required for the analysis 4.

∗ The authors are, respectively, professor and researchers at the Research Unit in Criminology of the School of Criminal Sciences at the University
of Lausanne, Switzerland. The opinions expressed in this publication are the responsibility of the authors and do not necessarily reflect the official
policy of the Council of Europe.
1
  Aebi, M. F. & Hashimoto, Y. Z. (2020). SPACE II – 2020 – Council of Europe Annual Penal Statistics: Persons under the Supervision of Probation
Agencies. Strasbourg: Council of Europe. Available at: www.unil.ch/space.
2
  Aebi, M. F. & Tiago, M. M. (2020). SPACE I – 2020 – Council of Europe Annual Penal Statistics: Prison Populations. Strasbourg: Council of Europe.
Available at: www.unil.ch/space.
3 According to the latest information provided, probation agencies do not exist in Bosnia & Herzegovina, and Germany does not produce

probation statistics at the federal level.
4 Many Figures include data from the two Spanish probation agencies (Catalonia and the State Administration) as well as the overall total for

Spain. In these cases, only two probation agencies are counted in the N indicated in the title of the Figures. That N also excludes the European
median values and averages. Readers counting the bars included in each Figure are kindly asked to keep these exceptions in mind.

____________________________________________________________________________________________________________

                                                                                                        Series UNILCRIM 2021/2
                                                                              Strasbourg and Lausanne: Updated on 08 June 2021
2. Defining probation and community sanctions and measures (CSM)
According to Appendix I to the Council of Europe’s Recommendation CM/Rec (2010)1, probation “relates to the
implementation in the community of sanctions and measures, defined by law and imposed on an offender. It
includes a range of activities and interventions, which involve supervision, guidance and assistance aiming at the
social inclusion of an offender, as well as at contributing to community safety”. At the same time, according to
the Council of Europe’s Recommendation CM/Rec(2017)3, “the expression ‘community sanctions and measures’
means sanctions and measures which maintain suspects or offenders in the community and involve some
restrictions on their liberty through the imposition of conditions and/or obligations. The term designates any
sanction imposed by a judicial or administrative authority, and any measure taken before or instead of a decision
on a sanction, as well as ways of enforcing a sentence of imprisonment outside a prison establishment”.

These conceptualizations show that the Council of Europe adopts broad definitions of probation and of
community sanctions and measures. For example, according to the Council of Europe’s Recommendation
Rec(2003)22 on conditional release (parole), “[c]onditional release is a community measure” that “means the
early release of sentenced prisoners under individualised post-release conditions”. This implies that persons
conditionally released and placed under the supervision of probation agencies are considered as probationers
and not as a separate category (usually called parolees in common law jurisdictions). As the distinction between
these two large categories is useful when analyzing the use of probation, Figure 1 presents the percentage of
persons conditionally released among the total number of probationers on 31st January 2020 in the 39
jurisdictions that provided the necessary data. That percentage varies widely across Europe, from 0.01% in
Turkey to 44% in Greece. In broad terms, the highest percentages are found in Western and Nordic European
countries. Nevertheless, five of the probation agencies included in Figure 1 do not use the person as the counting
unit in their probation statistics (presented in blue stripes) and nine do so partially (presented in orange stripes).

Whenever a probation agency does not use the person as the counting unit in its statistics, there is a risk of
double counting. This means that the same probationer can be counted more than once when, for example, he
or she is serving two or more community sanctions or measures. As the reader will soon realize, that
methodological issue —which affects all the indicators presented in SPACE II—is addressed in every analysis
presented in this document. All in all, 24 probation agencies use the person as the counting unit for their stock,
seven do not use it, and nine do so partially 5; however, not all of them are included in every Figure. That explains
why in Figure 1, for example, we mention five probation agencies not using the person as their counting unit,
while in Figure 2 we mention six.

5The seven probation agencies that do not use the person as the counting unit of their statistics are those of Belgium, Denmark, Luxembourg,
Malta, the Slovak Republic, Slovenia, and Ukraine. The nine ones that only use partially the person as their counting unit are those of the Czech
Republic, France, Ireland, Portugal, Romania, Serbia, Sweden, Scotland, and the State Administration of Spain. Consequently, the total figures for
Spain are also based only partially on persons, even if the Catalan probation agency does use the person as the counting unit of its statistics.

                                                                                                                                                2
Figure 1. Percentages of persons on conditional release among probationers on 31st January 2020 (N=39) 6
Note to Figure 1: Probation agencies not using the person as the counting unit of their statistics are presented in blue stripes, while those
using it only partially are presented in orange stripes.
6 The European median and average values shown in Figure 1 are calculated on the basis of data from the probation agencies that use the
person as the counting unit of their statistics (in blue in the Figure). These include France, Ireland, Portugal, Spain, Sweden, which count the
person for the total stock of probationers, but use other counting units (such as the cases) for the different forms of probation; consequently,
these five countries mentioned that they only partially use the person as the counting unit of their statistics (and are presented in orange
stripes in the Figure). Although the Czech Republic, Romania, Serbia and Scotland also partially use the person as their counting unit (and
therefore are also presented in orange stripes), they do not use it when calculating their probation stock and are as a result excluded —
together with the probation agencies using other counting units (in blue stripes in the Figure)— from the computation of the European
median and average values (see note 5 for details).
33. Probation and prison populations on 31st January 2020
Among the 46 probation agencies that completed the SPACE II questionnaire, 40 answered the item on the total
number of persons under their supervision (stock). However, nine among these specified that they do not use
the person as the counting unit for the total probation stock (see note 6), which leaves 31 agencies to be included
in any analyses based on the total number of probationers. On 31st January 2020, there were 1,512,765
probationers under the supervision of these 31 probation agencies, which corresponds to a median probation
population rate of 149 probationers per 100,000 inhabitants. The probation population rates of each probation
agency are presented in Figure 2. The European median and average rates are calculated on the basis of the data
provided by the 31 probation agencies that use the person as the counting unit for their stock of probationers
(see note 6).
Figure 2. Probation population rates (probationers per 100,000 inhabitants) on 31st January 2020 (N=40)
Note to Figure 2: Probation agencies not using the person as the counting unit of their statistics are presented in blue stripes, while those
using it only partially are presented in orange stripes.
The highest probation population rates are found in Lithuania, Turkey, and Poland, while the lowest are in North
Macedonia, Serbia, and Switzerland. However, as noted earlier, comparisons across jurisdictions must be
conducted carefully because the way in which data are collected varies across them. As in the previous Figure,
data provided by the probation agencies that do not use the person as the counting unit for the total number of
probationers are presented in a striped pattern. More specifically, Belgium, Denmark, the Slovak Republic,
Slovenia and Ukraine reported that their counting unit is the case or the file. Luxembourg does not count persons,
but did not specify its counting unit. Romania, Serbia and Scotland indicated that they partially count the person;
however, they specified that they count the case, the verdict, or the order for the probation stock. These different
counting units could explain the high probation population rates observed in Belgium and Scotland. Romania
specified that “[t]he vast majority of persons are registered only once, but a small part of them […] are registered
twice or several times […]” (see page 24 of the 2020 SPACE II report). Unfortunately, we do not have information
on the percentage of probationers counted more than once in the rest of the probation agencies that do not use
the person as their counting unit.
Even if all probation agencies were applying the same statistical counting rules, the interpretation of the ranking
of jurisdictions that stems from Figure 2 would not be straightforward. For example, the probation agency of
Serbia was created only in 2011, which suggests that its low probation population rate could be due to the fact
that probation is still developing in the country. The same interpretation can be made for North Macedonia,
4where the first probation office was opened in November 2017 and the rest of the offices started operating only
in November 2019.
Finally, there is no “magic formula” to estimate a rate of probationers that would be appropriate for a
jurisdiction. The reason is that probationers are serving community sanctions and measures, which are
frequently referred to as alternatives to imprisonment because they aim at the social inclusion of the offender
by keeping him/her in the community. Consequently, the probation rate cannot be interpreted without
comparing it to the prison population rate. For that reason, Figure 3 shows the probation and prison population
rates for the 40 prison services and probation agencies that answered both SPACE questionnaires in 2020.
Figure 3. Probation and Prison population rates (per 100,000 inhabitants) on 31st January 2020 (N=40)
Note to Figure 3: Probation agencies not using the person as the counting unit of their statistics are presented in blue stripes, while those
using it only partially are presented in orange stripes.
In Figure 3, jurisdictions are sorted by their probation population ranked in ascending order. It can easily be seen
that this distribution is completely different from the one that would be obtained if they were ranked by their
prison population rate. One striking result of this comparison is that, in 34 out of the 40 prison services and
probation agencies included in Figure 3, the probation population rate is higher than the prison population rate.
The exceptions are (in order of magnitude) North Macedonia, Serbia, Switzerland, Norway, Bulgaria, and
Azerbaijan, where the rates of inmates are higher than the rates of probationers per 100,000 inhabitants. Again,
it is important to emphasize the fact that not all probation agencies use the same counting unit. Accordingly, the
European median and the European average rates for both the probation population rate and the prison
population rate were computed excluding the probation agencies that do not count persons (see note 6).
Nevertheless, there are still major divergences across jurisdictions. In order to better illustrate these divergences,
Figure 4 shows the ratio of probationers per 100 inmates.
5Figure 4. Ratio of probationers per 100 inmates on 31st January 2020 (N=40)
Note to Figure 4: Probation agencies not using the person as the counting unit of their statistics are presented in blue stripes, while those
using it only partially are presented in orange stripes.
Figure 4 shows that, in jurisdictions using the person as the counting unit, the highest ratio of probationers per
inmates can be found in the Netherlands —where there are 350 probationers per 100 inmates— and the lowest
in North Macedonia, where the ratio is 6 probationers per 100 inmates. As explained above (see the comments
to Figure 2), the low ratio observed in North Macedonia seems due to the short history of its probation service,
while the elevated ratio observed in Belgium is partially explained by the fact that the country counts cases
instead of persons in its probation statistics.
In order to categorize the jurisdictions according to the relationship between their probation and prison
population rates, Table 1 presents the different ways in which both rates are combined in practice. Given that
the median prison population shown in Figure 3 is 103 per 100,000 inhabitants, the jurisdictions in Table 1 are
categorized as follows: a probation or prison population rate up to 100 per 100,000 inhabitants is considered as
low, a rate higher than 100 but lower than 200 per 100,000 inhabitants is considered as relatively high, and a
rate equal or superior to 200 is considered as high. Entries in italics mean that the probation agency (or
equivalent institution) specified that it does not use the person as the counting unit for the stock of probationers
(see note 6).
6Table 1. Relationship between probation and prison population rates on 31st January 2020 (N=41, 8 categories)
Jurisdiction Probation population rate Prison population rate
1. Jurisdictions with a low probation population rate (≤ 100 per 100,000 inhabitants) and a low prison population rate (≤ 100
per 100,000 inhabitants)
Switzerland 46.8 80.2
Norway 48.8 58.8
Finland 53.5 49.9
Iceland 75.0 45.0
Slovenia 87.8 69.1
Croatia 90.6 87.1
Monaco 92.3 33.3
Cyprus 98.9 93.4
2. Jurisdictions with a low probation population rate (≤ 100 per 100,000 inhabitants) and a relatively high prison population
rate (>100 to 100 to 100 to 100 to 100 to 200 per 100,000 inhabitants)
Azerbaijan 140.8 208.7
6. Jurisdictions with a high probation population rate (≥ 200 per 100,000 inhabitants) and a low prison population rate
(≤100 per 100,000 inhabitants)
Netherlands 204.9 58.5
UK: Northern Ireland 221.8 82.8
Belgium 480.6 93.6
7. Jurisdictions with a high probation population rate (≥ 200 per 100,000 inhabitants) and a relatively high prison population
rate (>100 toThe countries in the first category of Table 1 (Switzerland, Norway, Finland, Iceland, Slovenia, Croatia, Monaco,
and Cyprus) are those that seem to be using prison and probation most parsimoniously, because they show low
rates in both indicators. Countries in the eighth category (Georgia, Lithuania, and Turkey) are exactly in the
opposite situation. These countries appear to be using community sanctions not as alternatives to imprisonment,
but rather as supplementary sanctions. The reason is that their probation population rate is remarkably high, but
their prison population rate remains above the European median value. This observation also applies to the
probation services included in the seventh and most populated category. In between these categories, the
situation of the jurisdictions differs considerably.
Adding the total number of probationers (1,512,765) and the total number of inmates (1,528,343) reported by
the jurisdictions that participated in at least one of the two 2020 SPACE surveys and use the person as the
counting unit for both indicators of stock, one reaches the impressive number of 3,041,108 persons which are,
in one way or another, under the supervision of state institutions of formal criminal justice control in Europe.
Moreover, that number can be considered as a low estimate of the so-called correctional population, because it
is based only on the 31 probation agencies that provided data on their total number of probationers (Andorra,
Malta, and Montenegro answered some items of the SPACE II questionnaire, but they could not assess their total
number of probationers) and which use the person as the counting unit (see note 6), and the 50 prison services
that reported their total number of inmates when answering the 2020 SPACE I questionnaire.
Forty out of all these jurisdictions provided data on both their total number of probationers (or number of
cases/files/orders) and their total number of inmates. Adding both numbers one obtains the correctional
population of each jurisdiction, which can then be put in relationship with the jurisdiction’s population in order
to estimate the correctional population rate (number of probationers and inmates per 100,000 inhabitants).
Figure 5 presents the estimated correctional population rates for these 40 prison services and probation
agencies. Once more, it must be stressed that these rates are estimates, instead of fully reliable figures allowing
direct comparisons. The reason, once more, is that the person is not systematically used as the counting unit in
probation statistics across the continent; in particular, there is a risk of double counting in the jurisdictions
presented in a striped pattern (blue or orange) in Figure 5 (see note 6).
Figure 5. Estimated correctional population rate (inmates + probationers) per 100,000 inhabitants on 31st January
2020 (N=40)
Note to Figure 5: Probation agencies not using the person as the counting unit of their statistics are presented in blue stripes, while those
using it only partially are presented in orange stripes.
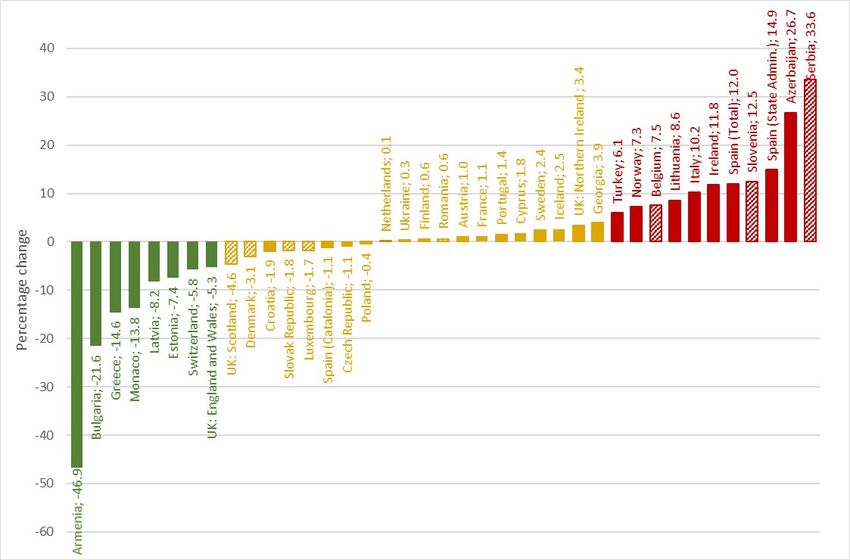
84. Year-on-year trend of the probation population rates
The high rates of probationers observed in several jurisdictions corroborates the expansion of community
sanctions and measures across the continent since the 1990s. However, this increase has not necessarily been
accompanied everywhere by a parallel decrease of imprisonment, which community sanctions and measures are
supposed to substitute (see the SPACE I series). In order to continue monitoring that trend —which can be seen
as a signal of the development of mass probation in some jurisdictions— Figure 6 shows the annual variation of
the probation population rate in the 38 probations agencies that provided data for 2019 and 2020.
As the aim of this analysis is to measure the trend in the use of probation in each jurisdiction, the use of different
counting units in different jurisdictions does not affect the comparison, as long as they do not change their
counting unit from one year to the other. Hence, Figure 6 includes data on 29 probation agencies that count the
number of probationers and on nine that count the number of cases, files, or orders (presented in a striped
pattern). North Macedonia is excluded because there were no probationers in 2019. Figure 6 shows that,
comparing 2020 to 2019, more than half of these jurisdictions (22) registered an increase of their overall rate of
probationers, cases or orders. However, if one considers increases and decreases between -5% and 5% as
indicating stability, there were 10 probation agencies that registered significant increases (5% or more), eight
that experienced significant decreases (-5% or more), and 20 where the situation remained stable.
Figure 6: Annual percentage change in probation population rates from 2019 to 2020 (N=38)
Note to Figure 6: Probation agencies not using the person —or using it only partially— as the counting unit of their statistics are presented
in stripes.
Finally, if we restrict the comparison to the 29 probation agencies that count persons and provided data both for
2019 and 2020, the total number of probationers grew from 1,456,192 in 2019 to 1,500,547 in 2020, which
represents a 3% increase (see Table 2 towards the end of this document). In particular, the probation population
rate grew in 17 probation agencies, but only in seven was that increase equal to or higher than 5%. At the same
time, the probation population rate fell in 12 probation agencies, but only in eight by 5% or more. This means
that, considering changes between -5% and 5% as reflecting stability, from 2019 to 2020 there was a significant
growth in the rate of probationers in seven probation agencies, a decrease in eight, and a stable rate in 14 of
them. If the comparison is based on the actual number of probationers (instead of on the rates per 100,000
population), there has been increases in 17 probation agencies –including seven where the number increased by
5% or more– and decreases in 12, but only in seven by 5% or more.
95. Characteristics of the probationers under the responsibility of European
probation agencies, and comparison with the inmates held in penal institutions
5.1. Gender
In the 34 probation agencies that provided data on both the gender of probationers and the total probation
stock, the median percentage of males was 89% and the median percentage of females was 11%. The same
percentage of 11% women among probationers is reached when the estimations are restricted to the 33
jurisdictions that provided data both for their probation (SPACE II) and their prison (SPACE I) population
characteristics by gender, as well as when we consider only the 27 probation agencies counting persons. The low
proportion of women corroborates the gender distribution of offending, an activity disproportionately
concentrated on the male population. At the same time, the comparison of the percentage of women on
probation to that of women in prison, presented in Figure 7, reveals major differences. In fact, with the exception
of Serbia, the percentage of women is systematically higher on probation than in prison. Roughly speaking, the
former is the double of the latter, as 11% of the probationers are women, while in prison women represent only
around 5% of the total prison population. This discrepancy could be explained by the fact that probation is being
used for the less serious offences and, while women are in general underrepresented among offenders, this
underrepresentation is particularly important for serious offences (namely violent offences), which are the ones
that usually lead to a prison sentence. For the same reason, women could be seen as less likely to recidivate and
therefore they would be more easily placed on probation or granted conditional release. Another reason for that
differential treatment could be that women remain the primary caregivers of minor children (i.e., men are
seldom placed on probation or granted conditional release because they are fathers of young children).
Figure 7. Percentage of female probationers in the probation population and percentage of female inmates in
the prison population on 31st January 2020 (N=33)
Note to Figure 7: Probation agencies not using the person —or using it only partially— as the counting unit of their statistics are presented
in stripes.
105.2. Nationality
In the 26 probation agencies that provided data on both the number of foreign probationers and the total
probation stock, 92% of the probationers were nationals and 8% were foreign citizens (7% if we restrict the
analysis to counts of persons; see note 6). Although there is a great diversity in these percentages, most of the
foreign probationers are placed under supervision in Western and Central Europe. Indeed, information on
nationality is not collected in several Eastern European countries, which suggests that the issue has no relevance
for policy makers in that region. This overall distribution of foreign probationers across the continent is similar
to the one observed for foreign inmates in the 2020 SPACE I report, although the percentages of the latter are
much higher. In particular, on 31st January 2020, 15% of the inmates placed in European penal institutions were
foreigners, but that percentage was usually lower than 5% in Eastern Europe, while in Central and Western
Europe it varied from 2% to 70% in countries with at least one million inhabitants.
When the estimations are restricted to the 22 jurisdictions that provided demographic data for both their
probation (SPACE II) and their prison (SPACE I) populations, the median percentage of foreign probationers is 6%
(the same is true when we restrain the analysis to counts of persons; see note 6) while the median percentage
of foreign inmates reaches 17%. The reason is that these jurisdictions are in EU and Western European countries,
where the percentages of foreign inmates are the highest.
As can be seen in Figure 8, in all jurisdictions the percentage of foreign inmates is higher —usually it is at least
the double— than that of foreign probationers. This difference is at least partially due to the fact that it is more
difficult for a foreign citizen than for a national to meet the conditions required to be placed on probation. The
main obstacle in that context is the requirement of having a stable address in the country where probation is
being served. In some cases, it is furthermore plausible to assume that some of the foreign inmates have also
been the object of a deportation order to be applied after release, which means that they will be expelled from
the country after serving their prison term and have no possibility of being placed on probation.
Figure 8. Percentage of foreign probationers in the probation population and percentage of foreign inmates in
the prison population on 31st January 2020 (N=22)
Note to Figure 8: Probation agencies not using the person —or using it only partially— as the counting unit of their statistics are presented
in stripes.
116. Mortality rates
In the 29 probation agencies that provided data on both the deaths of probationers and the total probation
stock 7, the median mortality rate was 63 deaths per 10,000 probationers (64 per 10,000 if we restrict the analysis
to counts of persons 8). Figure 9 presents the probation mortality rates for the year 2019 as well as the prison
mortality rates (deaths per 10,000 inmates) for the same year. For comparison purposes, Iceland and Monaco
are not represented in the Figure and are not included in the computation of the median and average European
rates. Both countries have very high mortality rates per 10 000 inmates in 2019, which are the result of having
had 1 and 2 deaths among small prison populations (see Table 3 for the relevant data).
Figure 9 shows that the probation mortality rates are usually higher than the prison mortality rates. In fact, in a
number of jurisdictions, the probation mortality rates are several times higher than the prison mortality rates.
There are at least three plausible explanatory hypotheses for that difference: (a) the constraints of the prison
environment reduce the risk of engaging in risky behaviour or suffering a fatal accident; (b) inmates suffering
terminal or serious illnesses are frequently released from prison and placed on probation; and (c) suicide is more
common while on probation than while in prison. In order to test the latter hypothesis, the 2020 SPACE II
questionnaire asked for data on suicides among probationers. However, none of the Council of Europe member
states was able to provide data on that issue.
Figure 9. Deaths of inmates per 10,000 inmates and deaths of probationers per 10,000 probationers during 2019
(N = 27)
Note to Figure 9: Probation agencies not using the person —or using it only partially— as the counting unit of their statistics are presented
in stripes.
7 These 29 nations also provided data on deaths of inmates in 2009 (SPACE I).
8As deaths are a subcategory of the flow of exits, the European median and average mortality rates exclude nations that do not use the person
as the counting unit to compute their flow. See note 5 for the general approach.
127. Methodology
Throughout this document, the term jurisdiction is often preferred to country because some countries (namely
Spain and the United Kingdom) have more than one probation agency.
Unless stated otherwise, the remarks made in the body of this document refer, for each indicator, to the
European median value. The median is the value that divides the data in two equal groups so that 50% of the
countries are above the median and 50% are below it. The median is preferred to the arithmetic mean
(commonly referred to as the average) because the latter is extremely sensitive to very high or very low values
(technically known as outliers). Outliers are quite common in the sample of countries included in the SPACE
reports because some member states, like Liechtenstein, Monaco or San Marino, have a very a small number of
inhabitants and, as a consequence, a change in only one person can have a big impact on their percentages and
rates. The average value is, however, regularly included in the Figures presented troughout the document.
The European median values are weighted according to the population and the number of probationers in each
country. This means that they are estimated on the basis of the percentages and rates per 100,000 inhabitants
of each country (or jurisdiction of the country) and not on the absolute numbers for the whole continent. Using
the latter would produce different values, which could hide the diversity observed across countries. For example,
on 31st January 2020, there were 1,512,765 probationers under the supervision of the 31 probation agencies of
the Council of Europe member states which use the person as the counting unit for their stock of probationers.
At the same time, the total population of the territories in which these probation agencies are located was 487
million inhabitants, which would lead to a probation population rate of 311 probationers per 100,000
inhabitants. However, when the European median value is estimated on the basis of the population and the
number of probationers of each country, it corresponds to 149 probationers per 100,000 inhabitants, as stated
at the beginning of this document (see Figure 2).
The questionnaire used for the SPACE II series of Council of Europe Annual Penal Statistics asks countries to
provide data on stock indicators using the person as the counting unit. For example, the number of probationers
on 31st January (stock) should correspond to the number of persons placed under the supervision of probation
agencies on that day. However, some probation agencies do not use the person as the counting unit of their
statistics. The risk when an agency uses files, cases or orders as their counting unit is that the same person may
be counted more than once (e.g., a person placed in home arrest with electronic monitoring could be counted
as two persons: one for the home arrest order and another for the electronic monitoring order). This issue is
addressed systematically throughout this document, which indicates for each indicator, Figure and Table the
jurisdictions that do not use the person as the counting unit of their probation statistics. These jurisdictions are
presented in stripes in the Figures, unless they have specified that they use the person as the counting unit for
the specific indicator presented in the Figure. For example, nine jurisdictions mentioned that they only use
partially the counting unit in their probation statistics (for details, see note 5), but five of them specified that
they do use it when computing the stock of probationers on 31st January (for details, see note 6). Consequently,
the latter are not presented in stripes in the relevant Figures (see, for example, Figure 2). In order to allow
comparisons, the same logic was applied when computing the European median and average values as well as
other measures based on the number of probationers: jurisdictions not using the person as the counting unit in
their probation statistics are excluded from the computation, unless they have stated that they use the person
for that specific indicator.
The Tables presented include one decimal but, in the comments, all numbers equal or superior to 10 are in
principle presented in round numbers (i.e., without decimals), while those inferior to 10 are presented with one
decimal. In order to facilitate the reading, numbers have also been rounded in the Figures except when the
majority of them were lower than 10.
The sample size (N) indicated on top of each Figure and Table is computed excluding the bars and lines that
present the European average and the European median, as well as the total figures for Spain whenever data for
the two probation agencies of the country (Catalonia and the State Administration) are also included. This
13explains why the N is smaller than the number of columns or lines found in the Figures and Tables. To avoid
double counting, the overall total for Spain is also excluded from the computation of the European averages and
median whenever data for the two probation agencies of the country are available.
148. Tables
Table 2. Stock indicators on 31st January 2020
Total
Ratio of
Total number Probation Prison correctional Correctional
Total number probationers
Country of population population population population
of inmates per 100
probationers rate rate (probationers rate
inmates
+ inmates)
Figure 2&3 3 4 5
Albania 5 063 177.9
Andorra 50 64.5
Armenia 3 320 112.2 2 221 75.0 149.5 5 541 187.2
Austria 14 964 168.1 9 189 103.2 162.8 24 153 271.3
Azerbaijan 14 178 140.8 21 012 208.7 67.5 35 190 349.6
Belgium 55 512 480.6 10 808 93.6 513.6 66 320 574.2
BH: state level
BiH: Fed. BiH 1 813 82.9
BiH: Republika Srpska 743 65.0
Bulgaria 3 866 55.6 7 340 105.6 52.7 11 206 161.2
Croatia 3 675 90.6 3 533 87.1 104.0 7 208 177.6
Cyprus 878 98.9 829 93.4 105.9 1 707 192.2
Czech Republic 23 805 222.6 21 048 196.8 113.1 44 853 419.4
Denmark 7 837 134.6 4 140 71.1 189.3 11 977 205.7
Estonia 4 047 304.5 2 450 184.4 165.2 6 497 488.9
Finland 2 957 53.5 2 756 49.9 107.3 5 713 103.4
France 178 116 265.5 70 651 105.3 252.1 248 767 370.7
Georgia 20 883 561.8 9 806 263.8 213.0 30 689 825.7
Germany 63 399 76.2
Greece 17 453 163.0 10 972 102.4 159.1 28 425 265.4
Hungary 16 783 171.8
Iceland 273 75.0 164 45.0 166.5 437 120.0
Ireland 7 191 144.9 4 052 81.6 177.5 11 243 226.5
Italy 89 756 149.0 60 971 101.2 147.2 150 727 250.2
Latvia 5 673 297.4 3 414 179.0 166.2 9 087 476.3
Liechtenstein 14 36.1
Lithuania 15 874 568.1 6 138 219.7 258.6 22 012 787.8
Luxembourg 962 153.6 594 94.9 162.0 1 556 248.5
Malta 793 154.1
Moldova 12 092 299.8 6 716 166.5 180.0 18 808 466.2
Monaco 36 92.3 13 33.3 276.9 49 125.6
Montenegro 1 108 178.2
Netherlands 35 667 204.9 10 179 58.5 350.4 45 846 263.4
North Macedonia 126 6.1 2 114 101.8 6.0 2 240 107.9
Norway 2 619 48.8 3 158 58.8 82.9 5 777 107.6
Poland 244 199 643.3 74 130 195.3 329.4 318 329 838.6
Portugal 31 125 302.3 12 793 124.3 243.3 43 918 426.6
Romania 69 812 361.4 20 570 106.5 339.4 90 382 467.9
Russian Federation 519 618 356.1
San Marino 0 0.0
Serbia 2 420 34.9 11 077 159.9 21.8 13 497 194.9
Slovak Republic 12 998 238.2 10 555 193.4 123.1 23 553 431.5
Slovenia 1 840 87.8 1 449 69.1 127.0 3 289 156.9
Spain (Total) 67 950 143.6 58 372 123.3 116.4 126 322 266.9
Spain (State Admin.) 56 959 143.8 49 998 126.2 113.9 106 957 270.0
Spain (Catalonia) 10 991 142.3 8 374 108.4 131.3 19 365 250.8
Sweden 10 530 102.0 6 709 65.0 157.0 17 239 166.9
Switzerland 4 025 46.8 6 906 80.2 58.3 10 931 127.0
Turkey 521 151 626.7 297 019 357.2 175.5 818 170 983.9
Ukraine 58 058 139.1 52 609 126.1 110.4 110 667 265.2
UK: England and Wales 172 110 286.7 82 868 138.0 207.7 254 978 424.7
UK: Northern Ireland 4 226 221.8 1 578 82.8 267.8 5 804 304.6
UK: Scotland 20 830 379.1 8 056 146.6 258.6 28 886 525.8
Notes: (1) Data refers to 31st January 2020 (for exceptions, see the SPACE reports); (2) Average and median values were calculated from
the original database, which contains all the decimals not shown in this Table.
15Table 3. Composition of the probation and prison populations on 31st January 2020 and mortality during 2019
Percentage of Percentage of Deaths of
Percentage of Percentage of Deaths of
female foreign probationers
female inmates foreign inmates inmates per
Country probationers in probationers in per 10,000
in the prison in the prison 10,000 inmates
the probation the probation probationers
population population (2019)
population population (2019)
Figure 6 6 7 7 8 8
Albania 2.0 2.3 53.3
Andorra 8.9 68.0 0.0
Armenia 7.3 3.2 0.8 7.0 48.2 45.0
Austria 15.2 6.2 25.3 53.1 37.4 40.3
Azerbaijan 2.9 2.4 73.4 44.3
Belgium 14.1 13.3 44.0 25.0
BH: state level
BiH: Fed. BiH
BiH: Republika Srpska
Bulgaria 5.1 3.0 4.2 2.5 54.3 28.6
Croatia 10.3 5.3 0.7 13.6 98.0 73.6
Cyprus 10.1 5.1 42.0 24.1
Czech Republic 17.8 7.6 8.5 41.6 17.1
Denmark 11.5 4.3 9.6 30.1 29.0
Estonia 8.1 4.8 22.4 33.3 76.6 61.2
Finland 10.5 7.0 5.7 18.5 128.5 21.8
France 7.3 3.6 8.0 23.2 2.8 23.9
Georgia 4.7 1.1 7.4 50.8 9.2
Germany 6.9 22.1
Greece 6.0 5.3 7.2 57.8 73.3 21.0
Hungary 7.3 5.0 29.8
Iceland 12.5 7.6 8.4 18.9 0.0 122.0
Ireland 13.4 4.5 4.4 14.8 54.2 37.0
Italy 12.0 4.3 16.5 47.5 23.8
Latvia 14.6 7.8 1.4 1.9 72.3 49.8
Liechtenstein 0.0 64.3 0.0
Lithuania 9.4 4.7 2.1 86.9 39.1
Luxembourg 10.9 5.1 48.4 73.9 104.0 16.8
Malta 51.5 75.7
Moldova 6.5 1.3 129.0 53.6
Monaco 11.1 14.3 61.1 100.0 0.0 769.2
Montenegro 2.6 20.0 36.1
Netherlands 12.3 5.7 21.6 16.7
North Macedonia 9.5 3.3 0.0 6.5 47.3
Norway 6.0 29.2 91.6 25.3
Poland 4.1 1.8 15.4
Portugal 10.3 6.4 6.7 15.4 58.5 50.0
Romania 9.2 4.6 0.5 1.1 19.9
Russian Federation 7.9 46.6
San Marino 0.0 0.0 0.0
Serbia 3.0 4.1 0.3 3.1 24.8 56.9
Slovak Republic 7.5 2.4 63.1 16.1
Slovenia 5.3 28.7 13.8
Spain (Total) 10.4 7.5 4.3 28.1 49.0 27.1
Spain (State Admin.) 10.2 7.6 25.1 42.7 28.4
Spain (Catalonia) 11.4 7.1 26.4 46.0 81.9 19.1
Sweden 12.1 5.6 16.1 100.7 4.5
Switzerland 12.4 5.7 37.5 69.6 26.1
Turkey 9.4 3.9 3.4 3.5 3.2
Ukraine 9.7
UK: England and Wales 12.1 4.6 11.1 68.9 36.2
UK: Northern Ireland 11.1 4.3 11.0 25.3
UK: Scotland 13.4 4.5 91.7 45.9
Notes: (1) Data on females and foreigners refer to 31st January 2020 (for exceptions, see the SPACE reports); (2) Data on deaths refer to
the entire year 2019; (3) Average and median values were calculated from the original database, which contains all the decimals not
shown in this Table.
169. Definitions
Conditional release: According to the Council of Europe’s Recommendation Rec(2003)22 on conditional release
(parole), “Conditional release is a community measure” that “means the early release of sentenced prisoners
under individualised post-release conditions”. As a consequence, persons conditionally released and placed
under the supervision of probation agencies are considered as probationers.
Community sanctions and measures: According to the Council of Europe’s Recommendation CM/Rec(2017)3,
“the expression ‘community sanctions and measures’ means sanctions and measures which maintain suspects
or offenders in the community and involve some restrictions on their liberty through the imposition of conditions
and/or obligations. The term designates any sanction imposed by a judicial or administrative authority, and any
measure taken before or instead of a decision on a sanction, as well as ways of enforcing a sentence of
imprisonment outside a prison establishment.” Community sanctions and measures are frequently referred to
as alternatives to imprisonment and some of them are also referred to as diversionary measures.
Correctional population rate: Corresponds to the addition of the number of inmates (including pre-trial
detainees) and probationers per 100,000 inhabitants of a given country, as of 31st January of each year.
Probation agency: Council of Europe’s Recommendation CM/Rec(2014)4 defines a probation agency as “a body
responsible for the execution in the community of sanctions and measures defined by law and imposed on an
offender. Its tasks include a range of activities and interventions, which involve supervision, guidance and
assistance aiming at the social inclusion of offenders, as well as at contributing to community safety. It may also,
depending on the national legal system, implement one or more of the following functions: providing
information and advice to judicial and other deciding authorities to help them reach informed and just decisions;
providing guidance and support to offenders while in custody in order to prepare their release and resettlement;
monitoring and assistance to persons subject to early release; restorative justice interventions; and offering
assistance to victims of crime. A probation agency may also be, depending on the national legal system, the
‘agency responsible for supervising persons under electronic monitoring’.”
Probation: According to Appendix I to the Council of Europe’s Recommendation CM/Rec (2010)1, probation
“relates to the implementation in the community of sanctions and measures, defined by law and imposed on an
offender. It includes a range of activities and interventions, which involve supervision, guidance and assistance
aiming at the social inclusion of an offender, as well as at contributing to community safety”.
Probationers: Persons placed under the supervision of probation agencies.
Probation population rate: Corresponds to the number of persons placed under the supervision of probation
agencies per 100,000 inhabitants of a given country, as of 31st January of each year. This indicator is also known
as the probation stock or the stock of probationers.
Suggested citation [APA Style 7th edition]:
Aebi, M. F., Hashimoto, Y. Z. & Tiago, M. M. (2021). Probation and Prisons in Europe 2020: Key Findings of the
SPACE reports. Series UNILCRIM 2021/2. Council of Europe and University of Lausanne.
© Council of Europe & University of Lausanne, 2021
Reproduction is authorised, except for commercial purposes, provided that the source is acknowledged.
Series UNILCRIM - ISSN: 2673-1983
17You can also read